The Honeybee Associate Galleria mellonella Can Acquire Arsenophonus apicola Through Oral and Parenteral Infection Routes
Trefor Simmons, Pol Nadal‐Jimenez, Gregory D. D. Hurst

TL;DR
This study shows that the bacterium Arsenophonus apicola can infect wax moths through both oral and injection methods, potentially impacting hive health and offering new research opportunities.
Contribution
The study demonstrates that Arsenophonus apicola can infect Galleria mellonella through multiple routes, expanding its known host range and suggesting new research directions.
Findings
Arsenophonus apicola can infect Galleria mellonella larvae via injection at low doses.
Oral infection with A. apicola impacts waxworm development and causes mortality.
A. apicola crosses from gut to hemocoel in G. mellonella, inducing melanisation.
Abstract
Members of the genus Arsenophonus are classically considered to be vertically transmitted endosymbiotic associates of invertebrates. Acquisition of Arsenophonus apicola by Apis mellifera honeybees through social and environmental pathways raises the possibility that this species can infect a broader range of host species. In this study, we tested whether a natural inhabitant of bee hives, the wax moth Galleria mellonella, was a suitable host for A. apicola. We first demonstrated A. apicola colonised G. mellonella larvae following injection at doses as low as 104 CFU. A similar capacity of A. apicola to infect G. mellonella orally was evidenced, impacting waxworm development and mortality. Microscopy indicated that A. apicola crossed from gut to hemocoel in the G. mellonella crop, inducing melanisation. PCR screening of Galleria individuals in an apiary sample confirmed exposure of…
Genes, proteins, chemicals, diseases, species, mutations and cell lines named across the full text — each resolved to its canonical identifier and authoritative record.
Click any figure to enlarge with its caption.
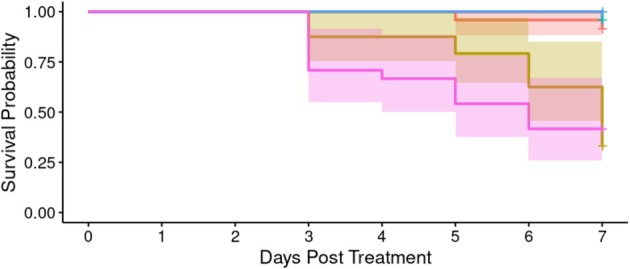 FIGURE 1
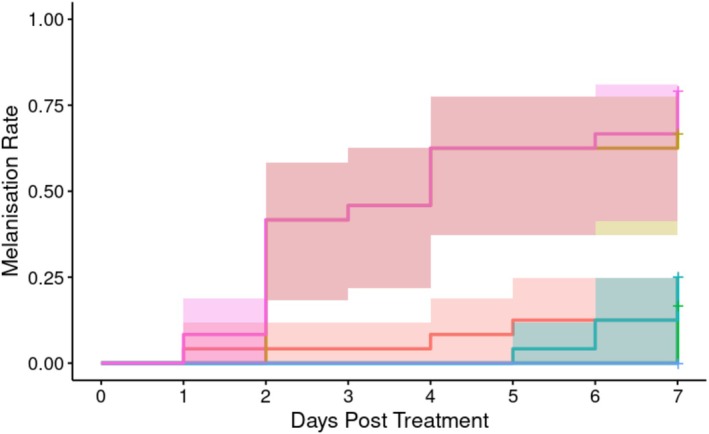 FIGURE 2
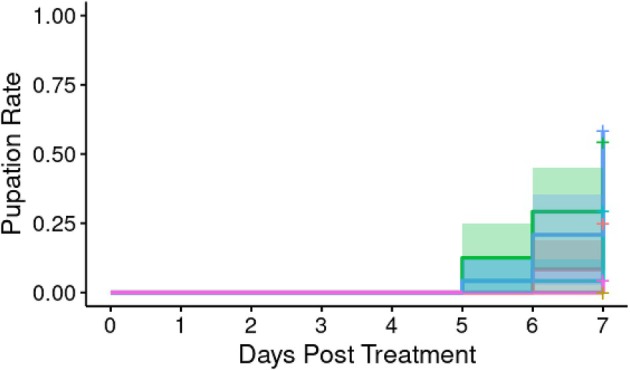 FIGURE 3
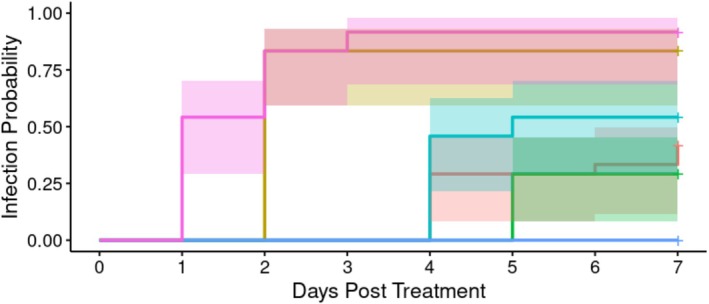 FIGURE 4
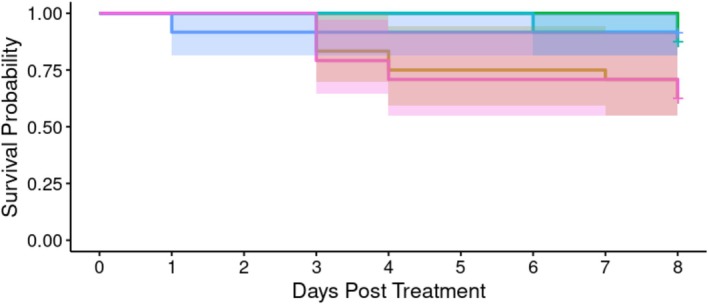 FIGURE 5
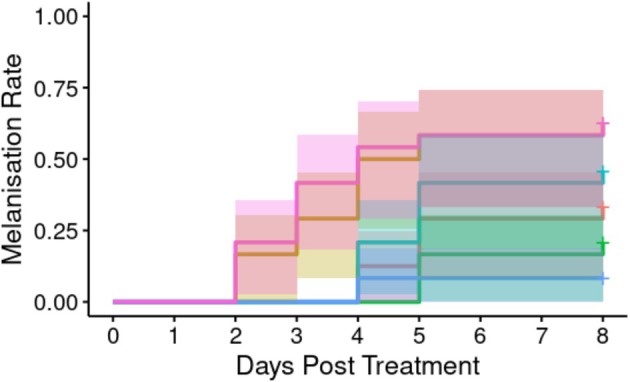 FIGURE 6
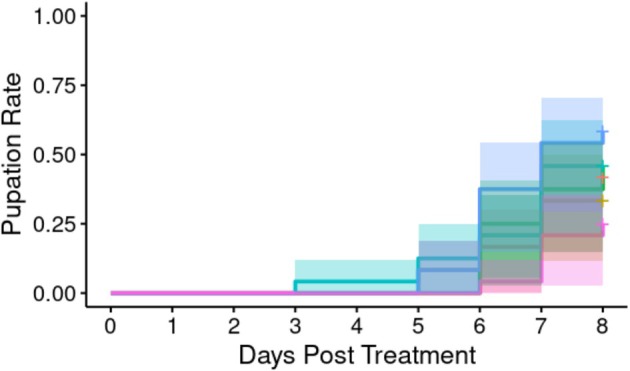 FIGURE 7
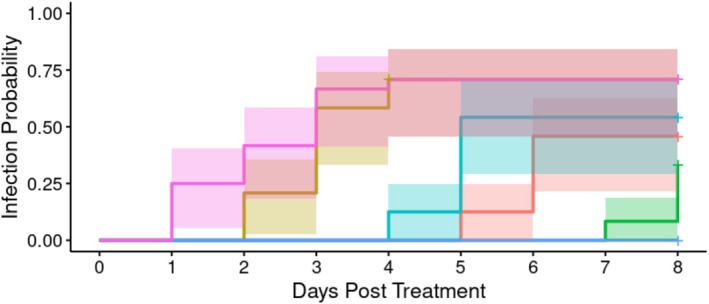 FIGURE 8
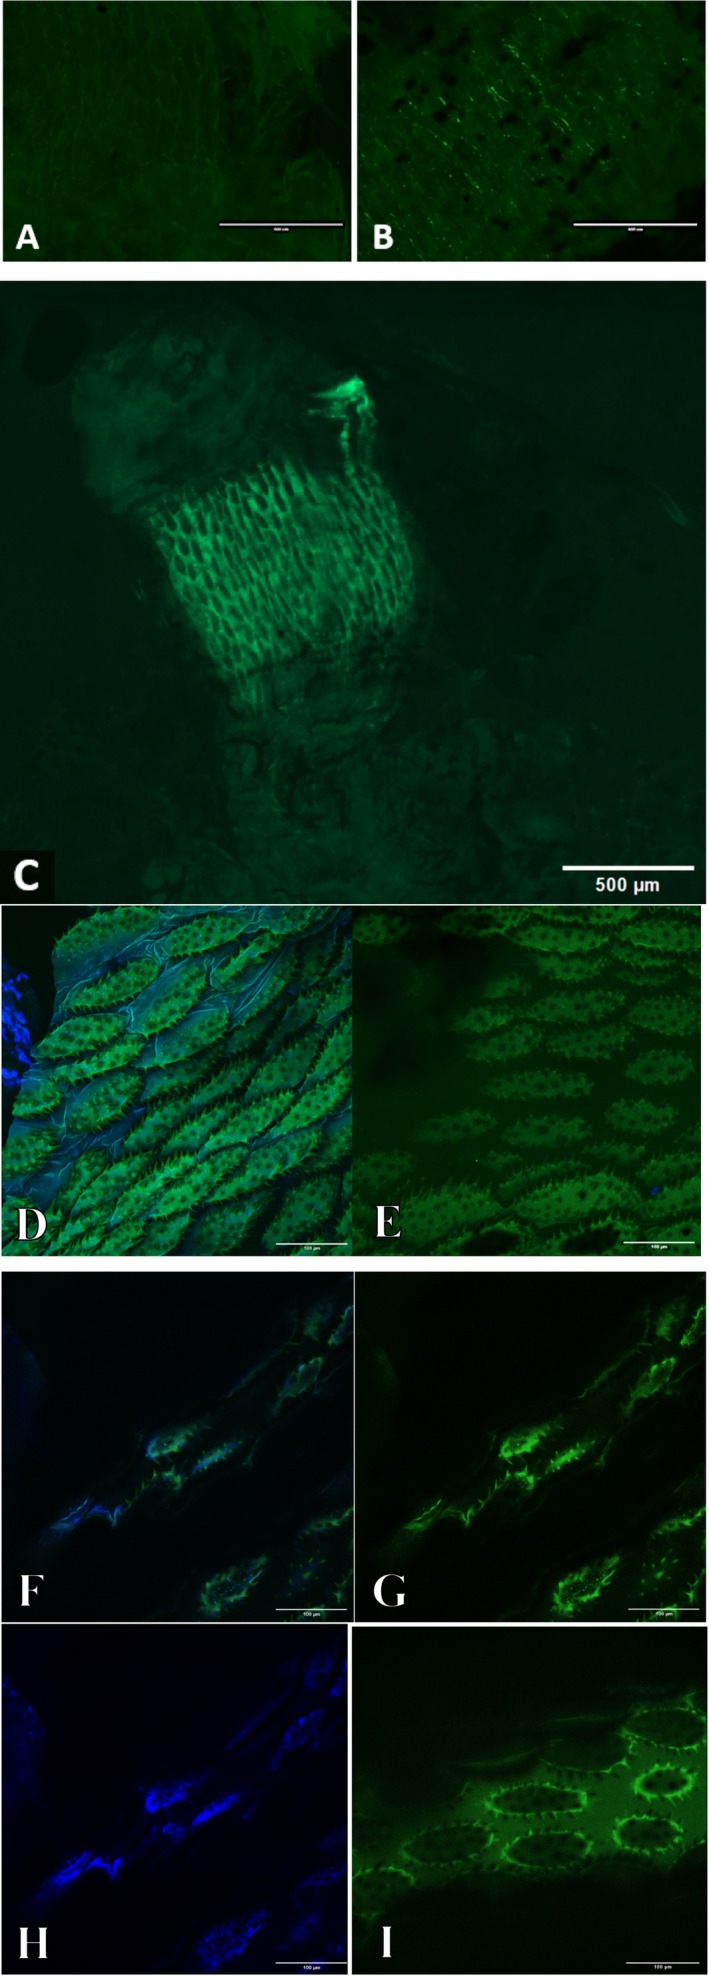 FIGURE 9
| Treatment | Days post treatment | ||||||
|---|---|---|---|---|---|---|---|
| 1 | 2 | 3 | 4 | 5 | 6 | 7 | |
| Original dose | 0.38 (24) | 1.25 (24) | 1.50 (24) | 2.21 (24) | 2.21 (24) | 2.33 (24) | 2.75 (24) |
| 10−1 | 0.21 (24) | 1.08 (24) | 1.63 (24) | 2.29 (24) | 2.42 (24) | 2.57 (23) | 2.96 (23) |
| 10−2 | 0.21 (24) | 0.38 (24) | 0.38 (24) | 0.54 (24) | 0.61 (23) | 0.78 (23) | 1.18 (17) |
| 10−3 | 0.21 (24) | 0.33 (24) | 0.33 (24) | 0.46 (24) | 0.58 (24) | 0.59 (22) | 1.11 (18) |
| 10−4 | 0.21 (24) | 0.21 (24) | 0.21 (24) | 0.38 (24) | 0.48 (21) | 0.39 (18) | 1.09 (11) |
| BHI control | 0.25 (24) | 0.25 (24) | 0.25 (24) | 0.25 (24) | 0.35 (23) | 0.32 (19) | 0.40 (10) |
| Treatment | Days post treatment | |||||||
|---|---|---|---|---|---|---|---|---|
| 1 | 2 | 3 | 4 | 5 | 6 | 7 | 8 | |
| Original dose | 0.00 (24) | 0.54 (24) | 1.42 (24) | 1.83 (24) | 1.92 (24) | 1.96 (23) | 2.21 (19) | 2.17 (18) |
| 10−1 | 0.00 (24) | 0.42 (24) | 1.29 (24) | 2.00 (24) | 2.08 (24) | 2.53 (19) | 2.75 (16) | 2.75 (16) |
| 10−2 | 0.00 (24) | 0.00 (24) | 0.00 (24) | 1.13 (24) | 1.48 (23) | 1.60 (20) | 2.13 (15) | 2.13 (15) |
| 10−3 | 0.00 (24) | 0.00 (24) | 0.00 (24) | 0.67 (24) | 0.95 (22) | 1.16 (19) | 1.35 (17) | 1.25 (16) |
| 10−4 | 0.00 (24) | 0.00 (24) | 0.00 (24) | 0.58 (24) | 0.88 (24) | 1.33 (18) | 1.60 (15) | 1.46 (13) |
| BHI control | 0.33 (24) | 0.33 (24) | 0.33 (24) | 0.63 (24) | 0.64 (22) | 0.80 (15) | 1.09 (11) | 1.22 (9) |
| Live | Dead | Death censored data | ||||||
|---|---|---|---|---|---|---|---|---|
| Larva | Pupa | Adult | Larva | Pupa | % mortality | % pupation | % eclosion | |
| Live | 3 | 5 | 15 | 16 | 17 | 58.9 (33/56) | 86.9 (20/23) | 65.2 (15/23) |
| Dead | 2 | 1 | 42 | 10 | 1 | 19.6 (11/56) | 95.6 (43/45) | 93.3 (42/45) |
| No manipulation control | 0 | 4 | 50 | 2 | 0 | 3.6 (2/56) | 100 (54/54) | 92.6 (50/54) |
| Species |
| ||
|---|---|---|---|
| Life stage | Larva | Pupa | Adult |
|
| 3 | 2 | 0 |
|
| 10 | 6 | 1 |
- —Biotechnology and Biological Sciences Research Council 10.13039/501100000268
Peer Reviews
No public reviews on file for this paper yet. If you reviewed it on a platform where reviews are public (OpenReview, ICLR, NeurIPS, ICML), you can paste yours below so the community can read it here.
Videos
No videos yet. Explain this paper in a talk, walkthrough, or lecture? Add one.
Taxonomy
TopicsInsect and Arachnid Ecology and Behavior · Insect and Pesticide Research · Plant and animal studies
Introduction
1
Arsenophonus is a clade of insect‐associated bacteria within the gammaproteobacteria. Previous work on this genus established that most strains had exclusively vertical modes of transmission in their insect hosts. Across its distribution (estimated to be 5% of all arthropod species [Duron et al. 2008]), the clade notably includes vertically transmitted obligate symbionts in blood‐feeders (Dale et al. 2006), facultative symbionts that impact pesticide sensitivity (Cai et al. 2024) and male‐killers with mixed modes of transmission in parasitic wasps (Nadal‐Jimenez, Parratt et al. 2023).
To date, only one strain has been shown to transmit exclusively horizontally (Yañez et al. 2016; Drew et al. 2021). This strain, recently formally described as Arsenophonus apicola (Nadal‐Jimenez et al. 2022a), infects the honey bee Apis mellifera . Infection frequency shows seasonal dynamics in the UK and Ireland, with a pronounced peak in July–August (Drew et al. 2021; Almeida et al. 2023). Within this seasonal cycle, hives lose infection overwinter. Arsenophonus apicola is more commonly found in weakened hives and has been hypothesised to increase the susceptibility of bees to co‐infection, potentially leading to colony collapse (Budge et al. 2016). There is also emerging evidence of an anthropogenic impact on A. apicola infection patterns, with A. mellifera hives more likely to be infected with this bacterium in areas with intense agricultural use (Gorrochategui‐Ortega et al. 2022).
Bees can acquire A. apicola infection through social transfer within the hive (Drew et al. 2021). Whilst infection is spatially heterogeneous, the majority of worker bees in an infected hive typically test positive for A. apicola where it is present, the exception being newly emerged workers. Experiments indicate social transfer particularly follows from trophallaxis, although it can also be observed without direct feeding contact (Drew et al. 2021). This transmission mode is also reflected in its primary colonisation of the foregut of the bee (Corby‐Harris et al. 2014).
The capacity of A. apicola to transfer infectiously between A. mellifera individuals within the hive, between hives and from their environment suggests that this microbe may have a host range beyond A. mellifera itself. Insect species that are co‐resident within the hive represent particularly strong candidates for acquiring infection. One of the most common of these is the wax moth Galleria mellonella. Moth activity causes hive damage, particularly from the silk that can entangle emerging adult worker bees and can also vector destructive honey bee pathogens like black queen cell virus (Levitt et al. 2013; Traiyasut et al. 2016). Importantly for this study, G. mellonella is commonly found in weakened hives (Sohail et al. 2017), which are also considered particularly likely to carry Arsenophonus spp. (Kwadha et al. 2017; Budge et al. 2016). Spillover of A. apicola into G. mellonella would be important for two reasons. First, it may provide novel routes of infection and infection reservoirs for both parties. Second, spillover from A. mellifera to G. mellonella may alter the development of galleriasis (waxworm damage to infested hives). For instance, if wax moths acquire and are harmed by A. apicola, the impact of wax moth infestation could be ameliorated. If this hypothesis is confirmed, A. apicola infection in A. mellifera hives would represent a novel form of protective symbiosis.
In this study, we tested the capacity for A. apicola to establish in G. mellonella waxworms when introduced by injection or through feeding. Within this, we examine the dose dependency of infection, the impact of infection on host development and mortality, and the means of establishing hemocoel infections following an oral inoculum. Our results indicate that G. mellonella is a suitable host for A. apicola that can establish infections within the hemocoel following oral challenge.
Materials and Methods
2
Materials
2.1
Arsenophonus apicola was cultured on brain heart infusion agar media (BHI, Oxoid) at 30°C for 4 days before the transfer of individual colonies to liquid BHI medium (BHI, Oxoid) for further growth at 30°C under constant agitation for 24 h. The type strain ArsBeeUS^T^ (DSM113403^T^ = LMG 32504^T^ = CECT 30499^T^) was used, modified to carry a pOM1::GFP plasmid conferring spectinomycin resistance, providing ease of visualisation under epifluorescence (Nadal‐Jimenez et al. 2022b).
Galleria mellonella larvae were purchased from livefoodsdirect.co.uk and kept in sterilised plastic containers with sawdust and flapjack pieces as their sole food source (no water was provided) at 25°C and 50% relative humidity out of direct light. No larvae were observed to be affected by mould during incubation. For all trials, late instar larvae of similar size were selected over 20 mm body length and over 200 mg body weight without visible melanisation (Firacative et al. 2020). Selected larvae were fasted for 24 h prior to oral treatment.
Dose Response for A. apicola Infection in G. mellonella Following Injection
2.2
A. apicola was grown in BHI with spectinomycin for 4 days under aerobic conditions at 30°C. 2 μL of this culture was injected directly into G. mellonella larvae through the last left abdominal proleg (Ramarao et al. 2012). Dose response was investigated through concurrently introducing 10^−0^‐ to 10‐fold^−4^ dilutions and a BHI uninfected control (with added spectinomycin), in a total of 24 replicates (larvae injected) for each treatment. The original titre of introduced microbes was calculated post hoc through serial dilution on BHI agar under spectinomycin selection. Spectinomycin was shown to have no significant impact on larval health (reported in Supporting Information S1) when compared to the control cohort injected with spectinomycin‐free BHI under the same conditions described above.
The response variables measured daily for 7 days were: (i) The condition of the larvae, with any observed malaise of the insect or mortality; (ii) presence of clear GFP fluorescence indicating a high density of infecting A. apicola; (iii) host melanisation/nodulation response indicating a cellular immune response (Ratcliffe and Walters 1983). All observations are reported in Supporting Information S1. A. apicola proliferation was monitored in whole live insects, detected using a M165 FC Leica stereoscope equipped with a Leica EL6000 external light source for fluorescence excitation and visualised using the GFP plus filter [480/40 nm (460–500 nm); Leica Microsystems (UK) limited]. Waxworm melanisation patterns were graded on a scale adapted from (Kay et al. 2019) as 0 = unmelanised, 1 = evidence of nodulation, 2 = ‘lateral line’ melanisation, 3 = systemic melanisation covering more than 50% of the cuticle and 4 = complete melanisation. Examples of systemic fluorescence vs. autofluorescence and the different levels of melanisation can be found in Supporting Information S4.
Dose Response for A. apicola Infection G. mellonella Following Oral Exposure
2.3
The oral dose–response experiment was conducted under similar conditions to the injection assay above. The same quantity of A. apicola suspended in BHI (at various dilutions) with spectinomycin was introduced orally by gravage to G. mellonella waxworms according to the method used in (Ramarao et al. 2012) with 24 replicates/treatment. G. mellonella condition was then monitored daily over 8 days, observing the same response variables as the ones used in the injections and comparing them to a BHI uninfected control (with added spectinomycin). All observations are reported in Supporting Information S1. The original dose was confirmed using serial dilution plates as previously. Spectinomycin was shown to have no significant impact on larval health (reported in Supporting Information S1) when compared to the control cohort orally exposed to spectinomycin‐free BHI under the same conditions described above.
Development and Mortality Following Oral Challenge With A. apicola
2.4
To gain a more precise measure of the impact of A. apicola on G. mellonella development and mortality, a larger cohort of waxworms was subject to either oral exposure to live A. apicola (Aa) [2 μL of 54,000 CFU/μL] versus the same dose of heat‐killed A. apicola (AaX, culture incubated at 90^o^C for 10 min before administration) and unchallenged controls. G. mellonella were incubated at 25°C for 12 days and, at this endpoint, scored in terms of life stage reached (larva, pupa, adult) and mortality (live/dead). A total of 56 replicates per treatment were run.
Visualising Gut‐Haemolymph Transit of A. apicola
2.5
2.65 × 10^5^ CFU of A. apicola was introduced orally to G. mellonella using the method detailed previously alongside the same dose of heat‐killed A. apicola. Five days post feeding, intact G. mellonella guts were dissected and mounted whole, including the foregut/crop, midgut and hindgut. These were then cut open and flattened before fixation in 4% paraformaldehyde and subsequent washing with PBS. The material was then mounted in Vectashield (Vector labs H‐1200‐10) containing DAPI to enable host cell imaging as well as more detailed observation of bacterial localisation via GFP fluorescence. The orientation of the gut and the retention of the fluorophores post‐fixation were confirmed under an epifluorescent microscope before samples were imaged using an ANDOR Dragonfly 600 spinning disk confocal microscope.
PCR Screening of Galleria From an A. apicola Infected Apiary
2.6
A Galleria‐infested hive (53.0286269, −0.4733653) was identified in the summer of 2024 by a collaborator at the Lincolnshire Bee‐keepers Association. Three adult A. mellifera bees and Galleria at various life stages were collected and screened for the presence of Arsenophonus spp. following DNA extraction from the haemolymph of the different individuals using the methods described in (Senior and Titball 2021) and (Drew et al. 2021) and using primers Ars16SF: 5′GGGTTGTAAAGTACTTTCAGTCGT and Ars16SR: 5′CGCAGGCTCGCCTCTCTC under the following PCR conditions: initial denaturation (3 min at 94^o^C), 35 cycles of denaturation (15 s at 92^o^C) annealing (1 min at 59^o^C) and extension (30 s at 72°C) before a final extension (4 min at 72^o^C) based on previous screening protocols (Nadal‐Jimenez, Frost et al. 2023). DNA from pure cultures of A. apicola (ArsBeeUS^T^) and E. coli K‐12 (MG1655) was used as the positive and negative controls, respectively (extracted from colonies by boiling for 15 min in ddH_2_O). Samples were deemed positive for Arsenophonus upon evidence of an 820 bp amplicon that, when sequenced, matched Arsenophonus spp.
Statistical Analyses
3
Analysis of the Dose‐Dependent Response in A. apicola‐Infected G. mellonella
3.1
We interpreted the dose‐dependent response in *A. apicola‐*infected G. mellonella waxworms using time‐to‐event analysis for both injected and oral introduction (gravage) treatments. For analysing the dose‐dependent survival of infected larvae, the ‘event of interest’ (1) was defined as mortality and larvae were right censored (0) at the end of the trial if the individual was still alive. To analyse the dose‐dependent infection (confirmed via fluorescence) rate, the ‘event of interest’ (1) was defined as observable fluorescence and larvae were right censored (0) at the end of the trial if still uninfected. For analysing the dose‐dependent melanisation of infected larvae, the ‘event of interest’ (1) was defined as melanisation scoring ≥ 2 and larvae were right censored (0) at the end of the trial if still scored < 2. For analysing the dose‐dependent pupation rate of infected larvae, the ‘event of interest’ (1) was defined as pupation and larvae were right censored (0) at the end of the trial if still larvae.
In all cases, Kaplan–Meier survival curves were created using the ‘ggplot2’ package in R studio (RStudio Team 2020). Due to the limited range and intervals of observation, the ‘step‐downs’ in each curve were deemed too steep to lead to a productive estimation of median time‐to‐event (e.g., LT_50_). Overall heterogeneity between all doses for a treatment type was measured with likelihood ratio tests with the Cox Proportional Hazard model using the ‘survminer’ package in R studio. Post hoc testing for between‐dose significance and hazard ratio within a treatment type was performed by using pair‐wise likelihood ratio testing according to the Cox Proportional Hazard Model with Bonferroni corrected α‐values (dividing the original α‐value by the number of comparisons being made) between pairs of doses using the ‘survminer’ package in R studio. Code for analyses can be found in Supporting Information C.
Analysis of Development and Mortality Following Oral Challenge With A. apicola
3.2
We interpreted the outcome distribution after long‐term infection and incubation by describing each class of outcome as a proportion of the whole cohort and tested for heterogeneity by contingency Chi‐squared testing (6 treatments × 2 outcomes). In cases where the H_0_ of homogeneity was rejected, post hoc tests were performed on a pairwise basis, using Chi‐squared testing and Bonferroni correction of α value.
Results
4
Dose Response for A. apicola Infection in G. mellonella Following Injection
4.1
A. apicola injected into G. mellonella haemolymph induced concentration‐dependent mortality over the 7 days following initial introduction (Figure 1). Mortality was observed where the initial bacterial load was either the undiluted culture (1.2 × 10^6^ CFU) or a 10‐fold dilution of this. Analysis indicated significant heterogeneity in survival between groups according to A. apicola dose (Cox proportional hazard LRT: χ^2^ = 69.87, 5 d.f., p < 0.01). Post hoc analysis comparing each dose to the BHI control indicated a significant difference in survivorship over time (in days) in the original 1.2 × 10^6^ CFU dose (Cox proportional hazard LRT: χ^2^ = 24.83, 1 d.f., p < 0.003; HR: exp.(coef) = 9.2 × 10^8^) and in the 10‐fold dilution (Cox proportional hazard LRT: χ^2^ = 29.87, 1d.f, p < 0.003; HR: exp.(coef) = 1 × 10^10^), but with no evidence of mortality increase in the 100‐, 1000‐ or 10,000‐fold dilution. The original dose of 1.2 × 10^6^ CFU and the 10‐fold dilution were both significantly different from the 100‐fold dilution (Supporting Information S2) but were not significantly different from each other. This analysis supports a threshold effect with outcome grouping of a ‘high dose’ and observed mortality (1.2 × 10^6^ CFU and 1.2 × 10^5^ CFU A. apicola) and a ‘low dose’ with no significant mortality (between 1.2 × 10^4^ CFU and 120 CFU A. apicola).
Survival probability over time of G. mellonella larvae infected with different concentrations of A. apicola pOM1::GFP introduced via injection (n = 24 replicates of each). Blue = control group (BHI without A. apicola); pink = original dose (1.2 × 10⁶ CFU); yellow = 10‐fold dilution (1.2 × 10⁵ CFU); teal = 100‐fold dilution (1.2 × 10⁴ CFU); red = 1000‐fold dilution (1.2 × 10³ CFU); green = 10,000‐fold dilution (1.2 × 10² CFU). Coloured bands either side of the survival curve indicate the 95% confidence intervals for the Kaplan–Meier survival estimates.
Arsenophonus apicola injected into the G. mellonella hemolymph induced concentration‐dependent melanisation over the 7 days following initial introduction (Figure 2; Table 1). Progressive melanisation (score ≥ 2 as per Supporting Information S4) was observed, evidencing a haemocoel immune response, where the initial bacterial load was either undiluted culture (1.2 × 10^6^ CFU) or a 10‐fold serial dilution of this. Overall analysis of progression to melanisation score ≥ 2 indicated significant heterogeneity in the melanisation rate between groups (Cox proportional hazard LRT: χ^2^ = 63.58, 5 d.f., p < 0.01). Post hoc analysis comparing to BHI control indicated a significant difference in melanisation over time (in days) in all doses used (Supporting Information S2).
Proportion of larvae exhibiting melanisation (score ≥ 2) over time with different initial doses (n = 24 each) of A. apicola pOM1::GFP introduced via injection. Blue = control group (BHI without A. apicola); pink = original dose (1.2 × 10⁶ CFU); yellow = 10‐fold dilution (1.2 × 10⁵ CFU); teal = 100‐fold dilution (1.2 × 10⁴ CFU); red = 1000‐fold dilution (1.2 × 10³CFU); green = 10,000‐fold dilution (1.2 × 10² CFU). Coloured bands either side of the survival curve indicate the 95% confidence intervals for the Kaplan–Meier survival estimates.
A. apicola injected into the G. mellonella haemolymph likewise induced concentration‐dependent pupation delay over the 7 days following initial introduction (Figure 3). Pupation delay was observed where the initial bacterial load was either the undiluted 1.2 × 10^6^ CFU or a 10‐fold dilution of this dose. Overall analysis indicated significant heterogeneity in the pupation rate between groups (Cox proportional hazard LRT: χ^2^ = 42.57, 5 d.f., p < 0.01). Post hoc analysis comparing to BHI control indicated a significant difference in the pupation rate over time (in days) in the original dose (Cox proportional hazard LRT: χ^2^ = 18.48, 1 d.f., p < 0.03; HR: exp.(coef) = 0.04) and the 10‐fold dilution (Cox proportional hazard LRT: χ^2^ = 24.83, 1 d.f., p < 0.03; HR: exp.(coef) = 4.84 × 10^−2^). There was no significant difference between these two doses (Supporting Information S2), and both were shown to differ significantly from the 100‐fold dilution and all lower doses.
Proportion of larvae pupating over time with different initial doses (n = 24 each) of A. apicola pOM1::GFP introduced via injection. Blue = control group (BHI without A. apicola); pink = original dose (1.2 x10⁶ CFU); yellow = 10‐fold dilution (1.2 × 10⁵ CFU); teal = 100‐fold dilution (1.2 × 10⁴ CFU); red = 1000‐fold dilution (1.2 × 10³ CFU); green = 10,000‐fold dilution (1.2 × 10² CFU). Coloured bands either side of the survival curve indicate the 95% confidence intervals for the Kaplan–Meier survival estimates.
A. apicola injected into the G. mellonella haemolymph induced concentration‐dependent systemic infection (defined as presence of GFP fluorescence throughout the larva) over the 7 days following initial introduction (Figure 4). Systemic infection was established at all of the dilution levels but was most commonly observed where the initial bacterial load was either the undiluted culture (1.2 × 10^6^ CFU) or a 10‐fold dilution of this. Overall analysis indicated significant heterogeneity in the systemic infection rate between groups (Cox proportional hazard LRT: χ^2^ = 103.6, 5 d.f., p < 0.01). Post hoc analysis comparing to BHI control indicated a significant difference in the infection rate over time (in days) in all doses used (Supporting Information S2).
Proportion of larvae exhibiting systemic GFP expression over time with different initial doses (n = 24 each) of A. apicola pOM1::GFP introduced via injection. Blue = control group (BHI without A. apicola); pink = original dose (1.2 × 10⁶ CFU); yellow = 10‐fold dilution (1.2 × 10⁵ CFU); teal = 100‐fold dilution (1.2 × 10⁴ CFU); red = 1000‐fold dilution (1.2 × 10³ CFU); green = 10,000‐fold dilution (1.2 × 10² CFU). Coloured bands either side of the survival curve indicate the 95% confidence intervals for the Kaplan–Meier survival estimates.
For the cohorts injected with either the BHI control or a dose of Arsenophonus apicola, the GFP signal, melanisation and survival were all analysed as positive predictor values (PPVs) for each other, where one is viewed as a ‘test’ value predicting the ‘condition’ value and used to calculate PPV as the proportion of ‘true positives’ to ‘all positives’. All individuals that died during the 7 days of observation were also positive for GFP signal and melanisation. Endpoint melanisation was shown to predict mortality (PPV_mel_ = 0.65) slightly better than endpoint GFP signal (PPV_GFP_ = 0.46). Endpoint melanisation was shown to predict endpoint GFP condition (PPV_mel_ = 1) more reliably than endpoint GFP predicted endpoint melanisation (PPV_GFP_ = 0.71). These PPVs (along with the timing data) suggest that most Galleria larvae injected with the Arsenophonus apicola exhibit an ordered infection phenotype progressing from melanisation to GFP‐evidenced systemic infection to mortality.
Dose Response for A. apicola Infection in G. mellonella Following Oral Exposure
4.2
Arsenophonus apicola introduced to the G. mellonella digestive tract via oral exposure was observed to induce concentration‐dependent mortality over the 8 days following initial introduction (Figure 5). Mortality was observed where the initial bacterial load was either the undiluted 1.1 × 10^6^ CFU or a 10‐fold dilution of this concentration. Overall analysis indicated significant heterogeneity in survival between groups (Cox proportional hazard LRT: χ^2^ = 13.84, 5 d.f., p = 0.02). Post hoc analysis comparing to BHI control indicated a difference in survivorship over time (in days) in the original 1.1 × 10^6^ CFU dose (Cox proportional hazard LRT: χ^2^ = 5.42, 1 d.f., p = 0.02; HR: exp.(coef) = 4.90) and in the 10‐fold dilution (Cox proportional hazard LRT: χ^2^ = 5.42, 1 d.f., p = 0.02; HR: exp.(coef) = 4.90), but with no evidence of mortality increase in the 100, 1000 or 10,000‐fold dilution (see also Supporting Information S2).
Survival probability over time of G. mellonella larvae infected with different concentrations (n‐24 each) of A. apicola pOM1::GFP introduced orally. Blue = control group; pink = original dose (1.1 × 10⁶ CFU); yellow = 10‐fold dilution (1.1 × 10⁵ CFU); teal = 100‐fold dilution (1.1 × 10⁴ CFU); red = 1000‐fold dilution (1.1 × 10³ CFU); green = 10,000‐fold dilution (1.1 × 10² CFU). Coloured bands either side of the survival curve indicate the 95% confidence intervals for the Kaplan–Meier survival estimates.
A. apicola introduced into the G. mellonella digestive tract induced concentration‐dependent melanisation of the waxworm over the 8 days following initial introduction (Figure 6; Table 2). Progressively increasing melanisation (score ≥ 2, see methods) was observed, evidencing haemocoel immune response, where the initial bacterial load was either the undiluted 1.1 × 10^6^ CFU or a 10‐fold serial dilution of this. Overall analysis indicated significant heterogeneity in the melanisation rate between groups as measured at the endpoint (Cox proportional hazard LRT: χ^2^ = 31.69, 5 d.f., p < 0.01). Post hoc analysis comparing to BHI control indicated a significant difference in the melanisation rate over time (in days) in all doses used (Supporting Information B), with the exception of the 10,000‐fold dilution.
Proportion of larvae exhibiting melanisation (score ≥ 2) over time with different initial doses (n = 24 each) of A. apicola pOM1::GFP introduced orally. Blue = control group (BHI without A. apicola); pink = original dose (1.2 × 10⁶ CFU); yellow = 10‐fold dilution (1.2 × 10⁵ CFU); teal = 100‐fold dilution (1.2 × 10⁴ CFU); red = 1000‐fold dilution (1.2 × 10³ CFU); green = 10,000‐fold dilution (1.2 × 10² CFU). Coloured bands either side of the survival curve indicate the 95% confidence intervals for the Kaplan–Meier survival estimates.
We next analysed whether orally introduced A. apicola induced concentration‐dependent pupation delay over the 8 days following initial introduction (Figure 7). Pupation delay was observed where initial bacterial load was either the undiluted 1.2 × 10^6^ CFU or a 10‐fold dilution of this. Overall analysis indicated no significant heterogeneity in the pupation rate between groups (Cox proportional hazard LRT: χ^2^ = 7.53, 5 d.f., p = 0.2).
Proportion of larvae pupating following treatment with different concentrations (n = 24 each) of A. apicola pOM1::GFP introduced orally. Blue = control group; pink = original dose (1.1 × 10⁶ CFU); yellow = 10‐fold dilution (1.1 × 10⁵ CFU); teal = 100‐fold dilution (1.1 × 10⁴ CFU); red = 1000‐fold dilution (1.1 × 10³ CFU); green = 10,000‐fold dilution (1.1 × 10² CFU). Coloured bands either side of the survival curve indicate the 95% confidence intervals for the Kaplan–Meier survival estimates.
Orally introduced A. apicola induced concentration‐dependent systemic infection over the 8 days following initial introduction (Figure 8). Fluorescence was observed, evidencing disseminated infection, at all initial doses. The proportion of individuals showing systemic infection was highest where the initial bacterial load was either the undiluted dose (1.2 × 10^6^ CFU) or a 10‐fold dilution of this. Overall analysis indicated significant heterogeneity in the infection rate between groups (Cox proportional hazard LRT: χ^2^ = 59.08, 5 d.f., p < 0.01). Post hoc analysis comparing to the BHI control indicated a significant heterogeneity in the infection rate over time (in days) in all doses used (Supporting Information B).
Proportion of larvae infected with different concentrations (n‐24 each) of A. apicola pOM1::GFP introduced orally. Blue = control group; pink = original dose (1.1 × 10⁶ CFU); yellow = 10‐fold dilution (1. × 105 CFU); teal = 100‐fold dilution (1.1 × 10⁴ CFU); red = 1000‐fold dilution (1.1 × 10³ CFU); green = 10,000‐fold dilution (1.1 × 10² CFU). Coloured bands either side of the survival curve indicate the 95% confidence intervals for the Kaplan–Meier survival estimates.
For the cohorts treated with orally introduced BHI control or a dose of Arsenophonus apicola, the GFP signal, melanisation and survival were all analysed as PPVs for each other, where one is viewed as a ‘test’ value predicting the ‘condition’ value and used to calculate PPV as the proportion of ‘true positives’ to ‘all positives’. Nearly all individuals that died during the 7 days of observation were also positive for GFP signal and melanisation, except for 2 in the control group that died shortly after exhibiting melanisation (but no GFP signal). Endpoint melanisation was shown to predict mortality (PPV_mel_ = 0.52) slightly better than endpoint GFP signal (PPV_GFP_ = 0.40). Endpoint Melanisation was shown to predict endpoint GFP condition (PPV_mel_ = 0.96) more reliably than endpoint GFP‐predicted endpoint melanisation (PPV_GFP_ = 0.81). These PPVs (along with the timing data) suggest that most Galleria larvae treated with orally introduced Arsenophonus apicola exhibit an ordered infection phenotype progressing from melanisation to GFP‐evidenced systemic infection to mortality.
Development and Mortality Following Oral Challenge With A. apicola
4.3
The oral infection experiment was repeated with a single concentration of A. apicola [1.08 × 10^6^ CFU] compared to heat‐killed and no microbe control, examining the outcome at day 12 post inoculation (Table 3). Waxworm mortality was highest following exposure to live A. apicola (live Aa = 58.9% mortality; dead Aa = 19.6%; no treatment 3.6%; all N = 56). The null hypothesis of no heterogeneity in mortality associated with treatment was rejected (χ^2^ = 45.68, 2 d.f., p < 0.00001). Post hoc analysis indicates live A. apicola differed significantly from both the heat‐killed titre (χ^2^ = 18.11, 1 d.f., p < 0.01) and the unchallenged control groups (χ^2^ = 39.94, 1 d.f., p < 0.01).
Based on the life stage data, development appeared to be slowed by A. apicola, as evidenced by decreased rates of pupation and eclosion in the live A. apicola pOM1::GFP treated group. However, when dead individuals were removed from the analysis, the pupation rate of the live‐bacteria‐fed group was not significantly different from that of the heat‐killed titre (χ^2^ = 1.65, 1 d.f., p = 0.2) or the unchallenged control groups (χ^2^ = 2.21, 1 d.f., p = 0.14). The death censored data did detect a significant difference in the eclosion rate between the live dose and both the heat‐killed treatment (χ^2^ = 8.87, 1 d.f., p < 0.01) and the unchallenged control groups (χ^2^ = 9.19, 1 d.f., p < 0.01). The significant increase in mortality between the heat‐killed titre and the unchallenged control groups (χ^2^ = 7.04, 1 d.f., p < 0.01) was not reflected in a significant difference in the pupation rate of the surviving individuals (χ^2^ = 0.03, 1 d.f., p = 0.86) or eclosion rate (χ^2^ = 0.02, 1 d.f., p = 0.88).
Visualising Gut‐Haemolymph Transit of A. apicola
4.4
Dissected gut tissue shows a consistent link between GFP expression from the A. apicola infection and surface melanisation that is pronounced in the foregut region (Figure 9). Compared to negative foreguts (imaged 5 days post treatment with heat‐killed A. apicola), in infected larvae, small nodules of melanised tissue can be observed on the surface as well as the GFP expression indicative of bacterial growth.
Epifluorescent microscopy images of A. apicola‐infected G. mellonella larvae. Disected tissue imaged: (A) control, section of foregut following introduction of heat‐killed A. apicola; (B) section of foregut following live A. apicola introduction, showing epifluoresence and melanisation; (C) example of a case of very high signal GFP epifluoresence following live A. apicola introduction. (D) z‐Stack of the foregut section from infected individual with GFP (green) and Dapi (blue) signals. (E) z‐Stack of the foregut section from control‐treated individual with GFP (green) and Dapi (blue) signals. (F) z‐Slice of the foregut section of infected individual showing combined GFP (green) [G] and Dapi (blue) (H) signals. (I) z‐Slice of the foregut section of control‐treated individual showing combined GFP (green) and Dapi (blue) signals. Scale bars A and B represent 400 μm, C represents 500 μm and D–I represent 100 μm.
Screening Galleria From an Arsenophonus‐Infected Apiary
4.5
The infection status of samples from a single Galleria‐infested hive was assessed by *Arsenophonus‐*specific PCR screening of individual haemolymph extracts. Arsenophonus infection was present in all three honeybees tested, indicating that the infection was present in this apiary. Galleria taken from the apiary tested positive, but at a lower rate (23% of larvae and 25% of pupae testing positive). The single adult moth collected tested negative for Arsenophonus (Table 4). BLAST comparison of sequenced amplicons verified all PCR‐positive amplicons as A. apicola.
Discussion
5
The clade Arsenophonus contains a broad range of insect vertically transmitted symbionts, including son‐killer parasites of Nasonia wasps (Duron et al. 2008) and coevolving nutritional mutualists of Pseudolynchia louse flies (Dale et al. 2006). Arsenophonus apicola is unique within this bacterial clade, as it exhibits no evidence of vertical transmission between generations, seeming to rely solely on horizontal transmission between individuals (Drew et al. 2021). This evidence of intraspecific horizontal transfer forms the foundation of the hypothesis that A. apicola could ‘spillover’ and infect a broader range of insects, such as non‐hymenopteran hive mates like G. mellonella waxmoths (Nanetti et al. 2021). We investigated the potential for interspecific transfer using laboratory experiments, where A. apicola at different doses was introduced to waxworm larvae by injection and oral feeding, and the fate of infection was followed in terms of progression of infection, host development, host immune response (melanisation) and mortality.
Our experiments collectively demonstrate that A. apicola can infect and propagate in G. mellonella larvae following both injection and oral exposure. At high doses, A. apicola delayed development, was associated with host melanisation responses and also had a significant mortality impact. These data support A. apicola being able to colonise host species from different insect orders and that (at high doses) this colonisation has morbidity and mortality outcomes. It is notable that A. apicola was able to cross the gut–haemolymph barrier, which we observed occurring in the crop. This pattern of crop infection recapitulates the crop infection seen for A. apicola in A. mellifera (Drew et al. 2021), indicating that this may be a general infection process for A. apicola.
The scope and application of these conclusions are limited by our use of cultured inoculum: whilst effective for dose–response estimation, this process does not necessarily replicate the field‐realistic introduction of A. apicola to G. mellonella (most likely as an ingested contaminant of occupied A. mellifera hive material). The capacity to establish systemic infection from the lowest dose in our study (c. 100 CFU) supports the hypothesis that these Arsenophonus infections are prone to be acquired from environmental sources. Our data from a single hive suffering galleriasis indicate that the waxworms within hives where honeybees carry Arsenophonus are also exposed to and may become infected by this bacterium. One feature that may predispose G. mellonella to A. apicola infection is that both parties are more likely to be present in weakened A. mellifera hives (Kwadha et al. 2017; Budge et al. 2016).
Galleriasis—the infestation of hives with wax moths—can cause the loss of hive productivity and ultimately hives. Our findings indicate the potential for an unusual dynamic—that Galleriasis might be mitigated in its impact where the hive has A. apicola. This process would require Galleria to acquire A. apicola in honeybee hives and then moth development and survival to be impacted by the A. apicola infection. This potential relationship would make A. apicola a ‘protective symbiont’ at hive level. This possible impact in the hive environment represents an exciting avenue for onward research. The potential of Arsenophonus apicola as a treatment for acute galleriasis could be investigated, mediated by the need for evidence that it does not harm the honeybee host (or wider pollinator community) in the same way. More broadly, the case for the function of Arsenophonus as a protective symbiont would be strengthened by evidence of its specific pathogenicity in comparison with other transient and commensal bacteria common in honeybees and their hives, and indications that pathogenicity can occur consequent on the exposure level that occurs within hives.
Whilst not the main goal of the study, our results indicate that G. mellonella is a valid model system for onward research into the mechanism of the invasion and immune response associated with A. apicola infection. This use has three advantages. First, G. mellonella is much easier to maintain in the lab than A. mellifera (Schilcher et al. 2021), whose lab use is limited to worker bees isolated from hives. Second, laboratory use enables investigation with A. apicola strains expressing transgenic GFP or other genetic modifications that are not possible in the field. Third, there is a historical base of knowledge concerning the G. mellonella immune response (Browne et al. 2014; Ménard et al. 2021; Pereira et al. 2018; Trevijano‐Contador and Zaragoza 2019), together with the ease of haemolymph extraction in this host (Senior and Titball 2021), making antimicrobial peptide (AMP) activation studies more accessible than in other model systems.
Author Contributions
Trefor Simmons: conceptualization, data curation, formal analysis, funding acquisition, investigation, methodology, visualization, writing – original draft, writing – review and editing. Pol Nadal‐Jimenez: conceptualization, investigation, methodology, resources, supervision, writing – review and editing. Gregory D. D. Hurst: conceptualization, formal analysis, funding acquisition, methodology, project administration, supervision, writing – original draft, writing – review and editing.
Ethics Statement
The authors have nothing to report.
Conflicts of Interest
The authors declare no conflicts of interest.
Supporting information
Data S1.
Data S2.
Data S3.
Data S4.
Data S5.
The reference list from the paper itself. Each links out to its DOI / PubMed record.
- 1Almeida, E. L. , C. Ribiere , W. Frei , D. Kenny , M. F. Coffey , and P. W. O'Toole . 2023. “Geographical and Seasonal Analysis of the Honeybee Microbiome.” Microbial Ecology 85, no. 2: 765–778. 10.1007/s 00248-022-01986-x.35284961 PMC 9957864 · doi ↗ · pubmed ↗
- 2Browne, N. , C. Surlis , and K. Kavanagh . 2014. “Thermal and Physical Stresses Induce a Short‐Term Immune Priming Effect in Galleria Mellonella Larvae.” Journal of Insect Physiology 63: 21–26. 10.1016/j.jinsphys.2014.02.006.24561359 · doi ↗ · pubmed ↗
- 3Budge, G. E. , I. Adams , R. Thwaites , et al. 2016. “Identifying Bacterial Predictors of Honey Bee Health.” Journal of Invertebrate Pathology 141: 41–44. 10.1016/j.jip.2016.11.003.27818181 · doi ↗ · pubmed ↗
- 4Cai, T. , P. Nadal‐Jimenez , Y. Gao , et al. 2024. “Insecticide Susceptibility in a Planthopper Pest Increases Following Inoculation With Cultured Arsenophonus.” ISME Journal 18: wrae 194. 10.1093/ismejo/wrae 194.39375012 PMC 11491930 · doi ↗ · pubmed ↗
- 5Corby‐Harris, V. , P. Maes , and K. E. Anderson . 2014. “The Bacterial Communities Associated With Honey Bee ( Apis mellifera ) Foragers.” P Lo S One 9, no. 4: e 95056. 10.1371/journal.pone.0095056.24740297 PMC 3989306 · doi ↗ · pubmed ↗
- 6Dale, C. , M. Beeton , C. Harbison , T. Jones , and M. Pontes . 2006. “Isolation, Pure Culture, and Characterization of ‘Candidatus Arsenophonus Arthropodicus,’ an Intracellular Secondary Endosymbiont From the Hippoboscid Louse Fly Pseudolynchia canariensis .” Applied and Environmental Microbiology 72, no. 4: 2997–3004. 10.1128/AEM.72.4.2997-3004.2006.16598007 PMC 1449044 · doi ↗ · pubmed ↗
- 7Drew, G. C. , G. E. Budge , C. L. Frost , et al. 2021. “Transitions in Symbiosis: Evidence for Environmental Acquisition and Social Transmission Within a Clade of Heritable Symbionts.” ISME Journal 15, no. 10: 2956–2968. 10.1038/s 41396-021-00977-z.33941888 PMC 8443716 · doi ↗ · pubmed ↗
- 8Duron, O. , D. Bouchon , S. Boutin , et al. 2008. “The Diversity of Reproductive Parasites Among Arthropods: Wolbachiado Not Walk Alone.” BMC Biology 6, no. 1: 27. 10.1186/1741-7007-6-27.18577218 PMC 2492848 · doi ↗ · pubmed ↗