Comparing Different Doses of Intravenous Dexamethasone for Prolonging Analgesia After a Single-Shot Ultrasound-Guided Supraclavicular Brachial Plexus Block: A Prospective Randomized Study
Prasobh PV Mukundan, Kavya Rajendran, Tripti Saxena, Vinayakumar VS

TL;DR
This study compares different doses of dexamethasone to see how well they extend pain relief after a specific type of arm surgery anesthesia.
Contribution
The study identifies optimal dexamethasone doses for prolonged analgesia while considering side effects like hyperglycemia.
Findings
8 mg dexamethasone prolonged analgesia by 103% compared to the control group.
4 mg dexamethasone reduced nausea and vomiting without causing significant hyperglycemia.
Higher dexamethasone doses were associated with transient hyperglycemia.
Abstract
Background Supraclavicular brachial plexus block (SCBPB) is a widely used regional anesthesia technique for upper limb surgeries. Intravenous dexamethasone is known to prolong postoperative analgesia, but the optimal dose remains uncertain due to potential side effects like hyperglycemia associated with high doses. This study compares the efficacy of different doses of intravenous dexamethasone in enhancing the duration of analgesia following a single-shot ultrasound-guided SCBPB. Methods This prospective, randomized study included 60 American Society of Anesthesiologists (ASA) grade I-III patients undergoing upper limb surgery. All patients received an ultrasound-guided SCBPB, followed by general anesthesia (GA) and were randomly allocated into four groups using computer-generated randomization: group 1: 0.5% levobupivacaine (20 ml) + 8 mg IV dexamethasone; group 2: 0.5%…
Genes, proteins, chemicals, diseases, species, mutations and cell lines named across the full text — each resolved to its canonical identifier and authoritative record.
Click any figure to enlarge with its caption.
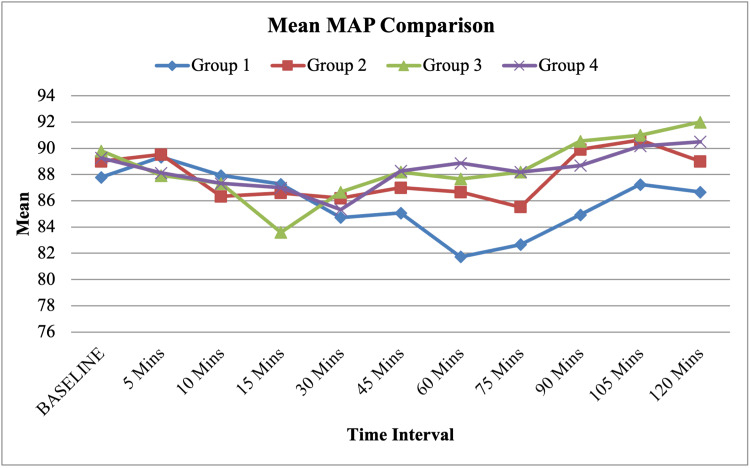 Figure 1
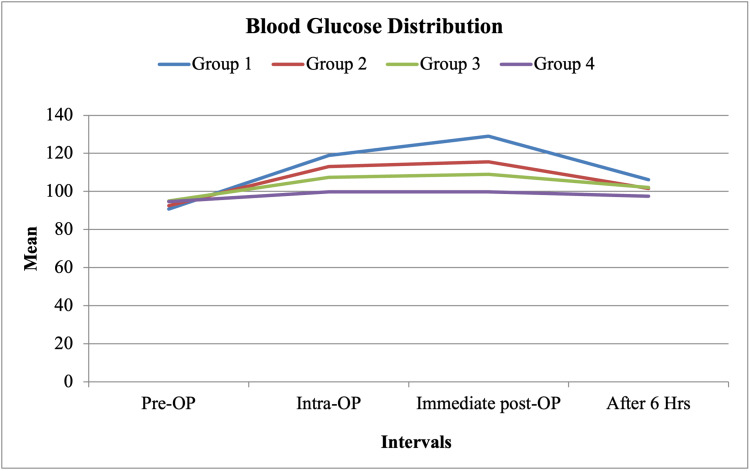 Figure 2
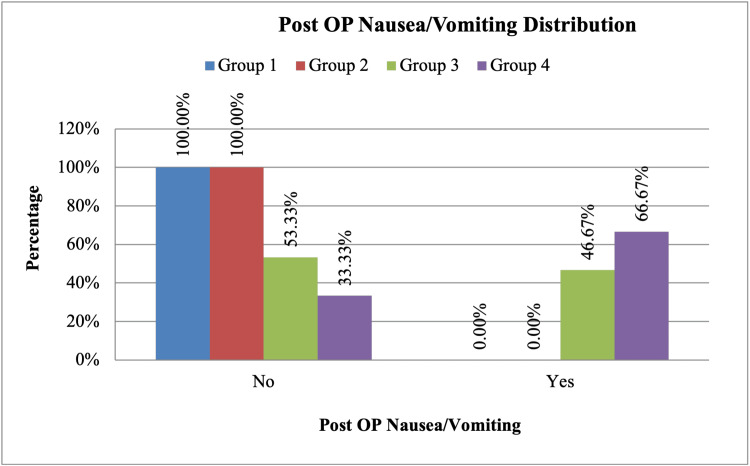 Figure 3
| Inclusion criteria | Exclusion criteria |
| ASA I-III | ASA IV and above |
| Age ≥18 years | Coagulopathy |
| Scheduled for upper limb surgeries below the mid-humerus | Allergy to local anesthetics |
| Infection at the injection site | |
| Diabetes mellitus (to avoid confounding effects on glucose levels) |
| Time interval | Group 1 (Mean ± SD) | Group 2 (Mean ± SD) | Group 3 (Mean ± SD) | Group 4 (Mean ± SD) | Total (Mean ± SD) | F-value (ANOVA) | P-value |
| Baseline | 118.07 ± 7.97 | 120.27 ± 8.17 | 121.20 ± 7.12 | 118.80 ± 8.58 | 119.58 ± 7.87 | 0.35 | 0.704 |
| 5 minutes | 120.47 ± 9.33 | 120.13 ± 10.21 | 118.20 ± 8.14 | 117.80 ± 8.57 | 119.15 ± 8.94 | 0.29 | 0.805 |
| 10 minutes | 117.33 ± 8.20 | 117.07 ± 9.74 | 117.20 ± 9.85 | 117.47 ± 9.36 | 117.27 ± 9.07 | 0.12 | 0.999 |
| 15 minutes | 117.67 ± 7.22 | 116.80 ± 8.97 | 114.00 ± 6.68 | 116.87 ± 8.64 | 116.33 ± 7.86 | 0.22 | 0.609 |
| 30 minutes | 113.87 ± 8.57 | 116.73 ± 8.37 | 116.20 ± 8.54 | 114.73 ± 8.46 | 115.38 ± 8.34 | 0.41 | 0.781 |
| 45 minutes | 114.53 ± 9.15 | 115.87 ± 7.23 | 118.40 ± 8.69 | 119.20 ± 8.51 | 117.00 ± 8.43 | 0.58 | 0.401 |
| 60 minutes | 112.07 ± 8.85 | 116.20 ± 8.82 | 118.80 ± 7.23 | 120.67 ± 9.12 | 116.93 ± 8.93 | 3.21* | 0.045* |
| 75 minutes | 114.07 ± 8.27 | 115.73 ± 7.96 | 118.13 ± 6.07 | 117.73 ± 6.92 | 116.42 ± 7.35 | 0.65 | 0.406 |
| 90 minutes | 113.47 ± 6.86 | 120.77 ± 6.51 | 121.08 ± 8.55 | 120.31 ± 5.88 | 118.70 ± 7.57 | 4.03* | 0.014* |
| 105 minutes | 118.17 ± 6.18 | 122.88 ± 11.08 | 122.67 ± 7.00 | 121.33 ± 6.15 | 120.78 ± 7.73 | 0.78 | 0.524 |
| 120 minutes | 117.67 ± 7.94 | 121.00 ± 8.41 | 122.00 ± 7.83 | 122.50 ± 5.00 | 120.44 ± 7.11 | 0.39 | 0.728 |
| 135 minutes | 118.33 ± 8.62 | 120.00 ± Not applicable (n = 1) | 130.00 ± Not applicable (n = 1) | 130.00 ± Not applicable (n = 1) | 122.50 ± 7.99 | 0.42 | 0.609 |
| 150 minutes | 123.00 ± 4.24 | - | - | 126.00 ± Not applicable (n = 1) | 124.00 ± 3.46 | 0.53 | 0.667 |
| 165 minutes | - | - | - | 120.00 ± Not applicable (n = 1) | 120.00 ± Not applicable (n = 1) | - | - |
| 180 minutes | - | - | - | - | - | - | - |
| Postoperative | 124.80 ± 8.28 | 122.53 ± 8.47 | 126.53 ± 5.83 | 124.13 ± 4.93 | 124.50 ± 7.01 | 0.68 | 0.484 |
| Time Interval | Group 1 (Mean ± SD) | Group 2 (Mean ± SD) | Group 3 (Mean ± SD) | Group 4 (Mean ± SD) | Total (Mean ± SD) | F-value (ANOVA) | P-value |
| Baseline | 72.80 ± 4.33 | 72.93 ± 5.75 | 74.00 ± 5.76 | 74.53 ± 7.54 | 73.57 ± 5.85 | 0.21 | 0.827 |
| 5 minutes | 73.73 ± 5.30 | 74.27 ± 8.21 | 72.93 ± 8.03 | 73.47 ± 8.16 | 73.60 ± 7.35 | 0.32 | 0.970 |
| 10 minutes | 73.47 ± 5.32 | 71.07 ± 7.36 | 72.40 ± 8.39 | 72.27 ± 7.44 | 72.30 ± 7.08 | 0.15 | 0.841 |
| 15 minutes | 72.20 ± 3.47 | 71.73 ± 6.54 | 68.67 ± 6.83 | 71.73 ± 7.09 | 71.08 ± 6.17 | 0.27 | 0.379 |
| 30 minutes | 70.20 ± 4.87 | 70.93 ± 8.17 | 71.07 ± 7.00 | 70.80 ± 6.18 | 70.75 ± 6.50 | 0.18 | 0.985 |
| 45 minutes | 70.27 ± 5.56 | 72.67 ± 6.40 | 72.67 ± 7.99 | 72.53 ± 6.86 | 72.03 ± 6.67 | 0.42 | 0.714 |
| 60 minutes | 66.73 ± 5.08 | 70.93 ± 6.67 | 72.27 ± 7.78 | 72.80 ± 6.75 | 70.68 ± 6.90 | 2.91 | 0.063 |
| 75 minutes | 66.93 ± 5.75 | 70.53 ± 4.93 | 73.27 ± 5.86 | 73.47 ± 4.37 | 71.05 ± 5.78 | 4.21* | 0.004* |
| 90 minutes | 70.67 ± 4.94 | 74.62 ± 6.85 | 74.31 ± 5.71 | 73.08 ± 5.33 | 73.07 ± 5.78 | 0.98 | 0.253 |
| 105 minutes | 71.75 ± 5.31 | 74.63 ± 9.02 | 75.33 ± 4.13 | 74.33 ± 4.27 | 73.63 ± 6.03 | 0.55 | 0.605 |
| 120 minutes | 71.17 ± 5.71 | 73.50 ± 5.26 | 77.00 ± 3.46 | 74.50 ± 5.26 | 73.72 ± 5.14 | 0.49 | 0.388 |
| 135 minutes | 71.67 ± 7.64 | 80.00 ± Not applicable (n = 1) | 78.00 ± Not applicable (n = 1) | 80.00 ± Not applicable (n = 1) | 75.50 ± 6.44 | 0.58 | 0.710 |
| 150 minutes | 71.00 ± 1.41 | - | - | 78.00 ± Not applicable (n = 1) | 73.33 ± 4.16 | 0.61 | 0.154 |
| 165 minutes | - | - | - | 78.00 ± Not applicable (n = 1) | 78.00 ± Not applicable (n = 1) | - | - |
| 180 minutes | - | - | - | - | - | - | - |
| Postoperative | 73.67 ± 6.09 | 76.33 ± 7.96 | 78.93 ± 4.71 | 77.20 ± 6.04 | 76.53 ± 6.44 | 0.74 | 0.154 |
| Time interval | VAS score | Group 1 (N, %) | Group 2 (N, %) | Group 3 (N, %) | Group 4 (N, %) | Chi-square (x²) | df (Degrees of freedom) | P-value |
| Immediate postoperative | 3 | 15 (100.0%) | 15 (100.0%) | 15 (100.0%) | 15 (100.0%) | - | - | - |
| 1 hour | 3 | 15 (100.0%) | 15 (100.0%) | 15 (100.0%) | 15 (100.0%) | - | - | - |
| 2 hours | 3 | 15 (100.0%) | 15 (100.0%) | 15 (100.0%) | 15 (100.0%) | - | - | - |
| 6 hours | 3 | 15 (100.0%) | 15 (100.0%) | 13 (86.7%) | 3 (20.0%) | 36.894 | 3 | <0.001* |
| 6 hours | 4 | 0 (0.0%) | 0 (0.0%) | 2 (13.3%) | 12 (80.0%) | - | - | - |
| 12 hours | 3 | 15 (100.0%) | 0 (0.0%) | 0 (0.0%) | 0 (0.0%) | 65.122 | 6 | <0.001* |
| 12 hours | 3 | 0 (0.0%) | 15 (100.0%) | 14 (93.3%) | 12 (80.0%) | - | - | - |
| 12 hours | 3 | 0 (0.0%) | 0 (0.0%) | 1 (6.7%) | 3 (20.0%) | - | - | - |
| 24 hours | 4 | 11 (73.3%) | 11 (73.3%) | 12 (80.0%) | 13 (86.7%) | 1.08 | 3 | 0.782 |
| 24 hours | 5 | 4 (26.7%) | 4 (26.7%) | 3 (20.0%) | 2 (13.3%) | - | - | - |
| Group | Mean time of rescue analgesic in minutes (Mean ± SD) | F-value (ANOVA) | P-value |
| Group 1 | 835.00 ± 66.55 | - | - |
| Group 2 | 658.33 ± 62.50 | - | - |
| Group 3 | 547.33 ± 53.48 | - | - |
| Group 4 | 427.00 ± 57.31 | - | - |
| Total | 616.92 ± 162.37 | - | - |
| ANOVA test | - | 18.72* | <0.001* |
| Time interval | Group 1 (N, %) | Group 2 (N, %) | Group 3 (N, %) | Group 4 (N, %) | Chi-square (χ²) | df (Degrees of freedom) | P-value |
| Immediate postoperative | 15 (100.0%) | 15 (100.0%) | 15 (100.0%) | 15 (100.0%) | - | - | - |
| 1 hour | 15 (100.0%) | 15 (100.0%) | 15 (100.0%) | 15 (100.0%) | - | - | - |
| 2 hours | 15 (100.0%) | 15 (100.0%) | 15 (100.0%) | 15 (100.0%) | - | - | - |
| 6 hours (Paracetamol 1 gm IV) | 0 (0.0%) | 0 (0.0%) | 2 (13.3%) | 12 (80.0%) | 36.894 | 3 | <0.001* |
| 6 hours (NIL) | 15 (100.0%) | 15 (100.0%) | 13 (86.7%) | 3 (20.0%) | - | - | - |
| 12 hours (Paracetamol 1 gm IV & Tramadol 50 mg IV) | 0 (0.0%) | 0 (0.0%) | 15 (100.0%) | 15 (100.0%) | 120.000 | 6 | <0.001* |
| 12 hours (Paracetamol 1 gm IV) | 0 (0.0%) | 15 (100.0%) | 0 (0.0%) | 0 (0.0%) | - | - | - |
| 12 hours (NIL) | 15 (100.0%) | 0 (0.0%) | 0 (0.0%) | 0 (0.0%) | - | - | - |
| 24 hours (Paracetamol 1 gm IV) | 15 (100.0%) | 0 (0.0%) | 0 (0.0%) | 0 (0.0%) | 60.000 | 3 | <0.001* |
| 24 hours (Paracetamol 1 gm IV & Tramadol 50 mg IV) | 0 (0.0%) | 15 (100.0%) | 15 (100.0%) | 15 (100.0%) | - | - | - |
| Time interval | Group 1 (Mean ± SD) | Group 2 (Mean ± SD) | Group 3 (Mean ± SD) | Group 4 (Mean ± SD) | Total (Mean ± SD) | F-value (ANOVA) | P-value |
| Preoperative | 90.80 ± 4.06 | 92.53 ± 5.05 | 95.00 ± 3.91 | 94.73 ± 4.91 | 93.27 ± 4.72 | 2.95* | 0.043* |
| Intraoperative | 118.93 ± 6.86 | 113.00 ± 6.69 | 107.47 ± 2.90 | 99.87 ± 4.16 | 109.82 ± 8.84 | 12.87* | <0.001* |
| Immediate postoperative | 128.93 ± 4.42 | 115.60 ± 4.61 | 109.00 ± 4.04 | 99.80 ± 5.86 | 113.33 ± 11.67 | 18.42* | <0.001* |
| After 6 hours | 106.20 ± 8.19 | 101.53 ± 4.70 | 102.00 ± 3.95 | 97.47 ± 4.47 | 101.80 ± 6.27 | 5.21* | 0.001* |
| ANOVA test | - | - | - | - | - | - | - |
| Grading of nausea/vomiting | Group 1 (N, %) | Group 2 (N, %) | Group 3 (N, %) | Group 4 (N, %) | Total (N, %) |
| Mild | 0 (0.0%) | 0 (0.0%) | 7 (46.7%) | 6 (40.0%) | 13 (21.7%) |
| Moderate | 0 (0.0%) | 0 (0.0%) | 0 (0.0%) | 3 (20.0%) | 3 (5.0%) |
| Nil | 15 (100.0%) | 15 (100.0%) | 8 (53.3%) | 5 (33.3%) | 43 (71.7%) |
| Severe | 0 (0.0%) | 0 (0.0%) | 0 (0.0%) | 1 (6.7%) | 1 (1.7%) |
| Chi-square (χ²) | - | - | - | - | 32.293 |
| Degrees of freedom (df) | - | - | - | - | 9 |
| P-value | - | - | - | - | <0.001* |
| Number of Episodes | Group 1 (N, %) | Group 2 (N, %) | Group 3 (N, %) | Group 4 (N, %) | Total (N, %) |
| 3 Episodes | 0 (0.0%) | 0 (0.0%) | 0 (0.0%) | 1 (6.67%) | 1 (1.67%) |
| Nil | 15 (100.0%) | 15 (100.0%) | 15 (100.0%) | 14 (93.33%) | 59 (98.33%) |
| Chi-square (χ²) | - | - | - | - | 3.051 |
| Degrees of Freedom (df) | - | - | - | - | 3 |
| P-Value | - | - | - | - | 0.384 |
| Treatment | Group 1 (N, %) | Group 2 (N, %) | Group 3 (N, %) | Group 4 (N, %) | Total (N, %) |
| Inj. ondansetron 4 mg IV | 0 (0.0%) | 0 (0.0%) | 7 (46.67%) | 10 (66.67%) | 17 (28.33%) |
| NIL | 15 (100.0%) | 15 (100.0%) | 8 (53.33%) | 5 (33.33%) | 43 (71.67%) |
| Chi-square (χ²) | - | - | - | - | 25.198 |
| Degrees of freedom (df) | - | - | - | - | 3 |
| P-value | - | - | - | - | <0.001* |
Peer Reviews
No public reviews on file for this paper yet. If you reviewed it on a platform where reviews are public (OpenReview, ICLR, NeurIPS, ICML), you can paste yours below so the community can read it here.
Videos
No videos yet. Explain this paper in a talk, walkthrough, or lecture? Add one.
Taxonomy
TopicsAnesthesia and Pain Management · Nausea and vomiting management · Cardiac, Anesthesia and Surgical Outcomes
Introduction
Supraclavicular brachial plexus block (SCBPB) is a widely used regional anesthesia technique for upper limb surgeries, particularly for procedures on the elbow, forearm, wrist, and hand. It involves injecting a local anesthetic near the brachial plexus at the level of the first rib, blocking sensory and motor transmission to the upper limb. This technique provides effective intraoperative anesthesia and postoperative analgesia, reducing opioid consumption and associated side effects [1,2].
With advancements in regional anesthesia, ultrasound guidance has become the gold standard technique for performing SCBPB due to its superior accuracy and safety profile. Ultrasound enables real-time visualization of the brachial plexus, needle placement, and local anesthetic spread, thereby improving block success rates while minimizing complications such as vascular puncture, pneumothorax, and inadvertent nerve injury [3,4]. Compared to traditional landmark-based techniques, ultrasound-guided SCBPB provides higher success rates, requires lower volumes of local anesthetic, and has been associated with reduced complication rates, particularly in preventing inadvertent pneumothorax and vascular injury [4]. The ability to visualize the needle tip in real time ensures optimal needle placement and precise perineural drug deposition, making it the preferred approach in modern regional anesthesia practice.
Despite its effectiveness, a single-shot SCBPB is limited by the duration of action of the local anesthetic. Various adjuvants have been explored to prolong analgesia, including opioids, alpha-2 agonists, magnesium, and corticosteroids [5,6]. Among these, dexamethasone, a synthetic corticosteroid with potent anti-inflammatory and analgesic properties, has shown promising results [7,8].
Dexamethasone can be administered perineurally (directly with the local anesthetic injection) or intravenously. While perineural administration may provide longer analgesia, concerns remain regarding potential neurotoxicity, impaired wound healing, increased infection risk, and its off-label use [9,10]. Intravenous dexamethasone offers a safer and equally effective alternative by modulating systemic inflammation and reducing pain transmission. However, the optimal intravenous dose required to maximize analgesia duration while minimizing systemic side effects such as hyperglycemia and other corticosteroid-related adverse effects remains unclear [11,12].
This study aims to compare the efficacy of varying doses of intravenous dexamethasone in prolonging analgesia following a single-shot ultrasound-guided SCBPB. We hypothesized that higher doses would be associated with prolonged analgesia but might also lead to increased side effects.
This research was previously presented as an e-research paper at the 68th Annual Conference of the Indian Society of Anaesthesiologists (ISACON 2021), held in Ahmedabad from November 24 to 28, 2021, highlighting its relevance to the anesthesia and regional block community [13].
Materials and methods
Study design and setting
This randomized, prospective, controlled study was conducted in the Department of Anesthesiology and Critical Care at Apollo Hospitals, Bangalore. The study received approval from the Institutional Ethics Committee on 26th October 2018, and written informed consent was obtained from all participants. Data collection commenced in November 2018 and continued until April 2020.
Study population and sample size
A total of 60 American Society of Anesthesiologists (ASA) grade I-III patients scheduled for various elective upper limb surgeries, primarily open reduction and internal fixation (ORIF) of fractures, under ultrasound-guided SCBPB were included in the study. While surgical duration may influence the total time of block effect, all patients received a standardized ultrasound-guided SCBPB with 20 mL of 0.5% levobupivacaine, ensuring uniformity in block characteristics across groups. Participants were randomly assigned to one of the four groups, with 15 patients in each group, using a computerized randomization method, ensuring allocation concealment and minimizing selection bias. Group 1 received 0.5% levobupivacaine (20 mL) with 8 mg IV dexamethasone, group 2 received 0.5% levobupivacaine (20 mL) with 4 mg IV dexamethasone, group 3 received 0.5% levobupivacaine (20 mL) with 2 mg IV dexamethasone, while group 4 (control) received 0.5% levobupivacaine (20 mL) with 0.9% IV normal saline (20 mL).
Inclusion and exclusion criteria
The inclusion criteria for this study consisted of ASA grade I-III patients aged 18 years or older who were scheduled for upper limb surgeries below the mid-humerus. Patients with ASA grade IV or higher, coagulopathy, known allergies to local anesthetics, infection at the injection site, or diabetes mellitus (to avoid confounding effects on glucose levels) were excluded from the study (Table 1).
Methodology
All patients underwent a preoperative assessment, including a detailed medical history, physical examination, and standard laboratory investigations.
Preoperative Management
Standard monitoring was conducted using ECG, heart rate, non-invasive blood pressure (NIBP), pulse oximetry (oxygen saturation), and end-tidal CO₂. Patients received IV pantoprazole (40 mg) and IV ondansetron (4 mg) as premedication. Preoperative blood glucose levels were measured using venous blood samples, which were sent to the laboratory for analysis to ensure accuracy and standardization before shifting to the operating room.
Regional Block and General Anesthesia
All patients underwent an ultrasound-guided SCBPB using a single-point injection technique with a 21-gauge, short-bevel, insulated needle. A total volume of 20 mL of 0.5% levobupivacaine was administered. Each group received its designated IV dexamethasone dose according to the randomization.
Following the block, patients received general anesthesia with an induction regimen consisting of IV midazolam (0.05 mg/kg), IV fentanyl (2 mcg/kg), IV propofol (2 mg/kg), and IV atracurium (0.5 mg/kg) for muscle relaxation. Anesthesia was maintained using oxygen/nitrous oxide/sevoflurane at a minimum alveolar concentration (MAC) of 0.9-1.1. General anesthesia was used for standardization to ensure uniform intraoperative conditions across all patients. Induction and maintenance were performed with fixed weight-based doses, and fentanyl (2 mcg/kg) was administered uniformly for induction. The regional block served as the primary source of intraoperative analgesia, with no additional opioids administered during surgery.
At the end of surgery, neuromuscular blockade was reversed with IV neostigmine (0.05 mg/kg) and IV glycopyrrolate (0.01 mg/kg), followed by extubation and transfer to the post-anesthesia care unit (PACU).
Outcome measures
The primary outcome of this study was the total duration of postoperative analgesia, defined as the time from block administration to the first request for rescue analgesia. Secondary outcomes included postoperative blood glucose levels, which were measured at four time points: preoperative, intraoperative (one hour after IV dexamethasone or saline administration to ensure consistency across all participants), immediate postoperative, and six hours postoperative. The incidence of postoperative nausea and vomiting (PONV) was also recorded. Pain assessment was conducted using the visual analog scale (VAS; 0-10) at the following time points: immediate postoperative period and at one, two, six, 12, and 24 hours. Rescue analgesia was administered according to the following protocol: IV paracetamol (1 g) was the first-line agent. If the VAS score remained ≥4 after paracetamol, IV tramadol (50 mg) was given. The study concluded once the first dose of rescue analgesia was administered.
Sample size calculation
The required sample size was determined based on mean VAS scores from a previous study (Dhanger et al.), which reported analgesia durations of 11.88 ± 1.31 hours versus 6.47 ± 0.93 hours in different groups [14]. Using these values, a formal power analysis was conducted, selecting a 99% confidence level and 90% power, leading to a final sample size of 60 patients (15 per group), which was deemed sufficient to detect a statistically significant difference.
Statistical analysis
Data were analyzed using SPSS version 22 (IBM Corp., Armonk, NY). Categorical data were presented as frequencies and proportions, while continuous data were expressed as mean and standard deviation. The chi-square test was used for categorical variables, while analysis of variance (ANOVA) was used to compare continuous variables across the four groups. A p-value < 0.05 was considered statistically significant.
Results
Demographic data
The mean age of the participants in group 1 was 37.67 ± 12.65 years, in group 2 was 36.33 ± 14.03 years, in group 3 was 43.47 ± 11.06 years, and in group 4 was 41.40 ± 12.75 years. There was no statistically significant difference in age distribution among the four groups. Similarly, the sex distribution among the four groups showed no significant difference. In groups 1 and 2, 26.67% were females, and 73.33% were males. In groups 3 and 4, 46.67% were females, and 53.33% were males. The ASA classification was comparable across groups, with no significant difference observed. The majority of patients in all four groups were ASA I, accounting for 80.00% in groups 1 and 2 and 86.67% in groups 3 and 4.
Hemodynamic parameters
Heart rate measurements at various time intervals showed no statistically significant differences between the four groups. Similarly, systolic blood pressure (SBP) values showed significant differences at the 60-minute and 90-minute marks (p = 0.045 and p = 0.014, respectively), while no significant differences were observed at other intervals (Table 2).
Table 2: Mean SBP comparison between the four groups at different intervals of time.Data are presented as mean ± standard deviation (SD). A one-way ANOVA test was used to analyze differences in systolic blood pressure (SBP) between the four groups at different time intervals. The F-values corresponding to the ANOVA test are provided in the second-last column, and the p-values are listed in the last column. Statistically significant differences (p < 0.05) are marked with an asterisk (*).For time intervals where only a single data point was available (n = 1), SD could not be calculated and is marked as "Not applicable (n = 1)".SBP: systolic blood pressure; SD: standard deviation; F-value: test statistic from one-way ANOVA; P-value: probability value.
Diastolic blood pressure (DBP) comparison showed a significant difference at the 75-minute interval (p = 0.004) but was otherwise comparable between the groups (Table 3). Mean arterial pressure (MAP) showed significant differences between 60 and 90 minutes (p = 0.03 and p = 0.036) but was comparable at other time points (Figure 1).
Table 3: Mean DBP comparison between the four groups at different intervals of time.Data are presented as mean ± standard deviation (SD). A one-way ANOVA test was used to analyze differences in diastolic blood pressure (DBP) between the four groups at different time intervals. The F-values corresponding to the ANOVA test are provided in the second-last column, and the p-values are listed in the last column. Statistically significant differences (p < 0.05) are marked with an asterisk (*).For time intervals where only a single data point was available (n = 1), SD could not be calculated and is marked as "Not applicable (n = 1)".DBP: diastolic blood pressure; SD: standard deviation; F-value: test statistic from one-way ANOVA; P-value: probability value.
Line diagram showing the mean MAP comparison between the four groups at different intervals of time.Mean arterial pressure (MAP) was comparable at most time points but showed statistically significant differences between 60 and 90 minutes (p = 0.03 to p = 0.036).
Pain assessment and analgesic requirements
Postoperative pain scores, measured using the VAS, showed a significant difference at six and 12 hours among the four groups (p < 0.001). At other time intervals, no significant differences were observed (Table 4). The mean time to first rescue analgesia was significantly prolonged in group 1 (835 ± 66.55 minutes) compared to group 4 (427 ± 57.31 minutes), with a p-value of <0.001 (Table 5).
Table 4: VAS distribution between the four groups at different intervals of time.Data are presented as absolute counts (N) and percentages (%). The chi-square (χ²) test was used to compare differences in the visual analog scale (VAS) distribution between the four groups at different time intervals. The chi-square values (χ²) and degrees of freedom (df) are provided in the second-last column, and the p-values are listed in the last column. Statistically significant differences (p < 0.05) are marked with an asterisk (*).VAS: visual analog scale; N: number of patients; χ²: chi-square test statistic; df: degrees of freedom; P-value: probability value.
Table 5: Mean time of rescue analgesic comparison between the four groups.Data are presented as mean ± standard deviation (SD). A one-way ANOVA test was used to compare the time to rescue analgesia between the four groups. The F-value corresponding to the ANOVA test is provided in a separate row at the bottom, along with the p-value. Statistically significant differences (p < 0.05) are marked with an asterisk (*).SD: standard deviation; F-value: test statistic from one-way ANOVA; P-value: probability value.
The distribution of rescue analgesic use showed a significant difference between six and 24 hours (p < 0.001). Group 4 required the highest percentage of rescue analgesics at the six-hour mark (Table 6).
Table 6: Rescue analgesics distribution between the four groups at different intervals of time.Data are presented as absolute counts (N) and percentages (%). The chi-square (χ²) test was used to compare differences in rescue analgesics distribution between the four groups at different time intervals. The chi-square values (χ²) and degrees of freedom (df) are provided in the second-last column, and the p-values are listed in the last column. Statistically significant differences (p < 0.05) are marked with an asterisk (*)."NIL" indicates that no rescue analgesic was administered during that specific time interval.N: number of patients; χ²: chi-square test statistic; df: degrees of freedom; P-value: probability value.
Blood glucose levels
Blood glucose levels varied significantly at all measured intervals (p < 0.001). Intraoperatively and at six hours postoperatively, glucose levels were significantly lower in group 4 compared to the other three groups. In contrast, group 1 exhibited the highest intraoperative and postoperative glucose levels (Table 7 and Figure 2).
Table 7: Blood glucose distribution between the four groups at different intervals of time.Data are presented as mean ± standard deviation (SD). A one-way ANOVA test was used to compare the mean blood glucose levels across the four groups at different time intervals. The F-value and corresponding p-value are presented in the last two columns. Statistically significant differences (p < 0.05) are marked with an asterisk (*).SD: standard deviation; F-value: test statistic from one-way ANOVA; P-value: probability value.
Blood glucose distribution across different time intervals.Blood glucose levels varied significantly across all measured time points (p < 0.001). Group 1 exhibited the highest intraoperative and postoperative glucose levels, while group 4 had the lowest levels at all time intervals. The most significant differences were observed in the intraoperative and immediate postoperative periods. Data are presented as mean values for each group.
Postoperative nausea and vomiting
A significant difference in PONV distribution was observed, with group 3 experiencing PONV in 46.67% of cases and group 4 in 66.67% of cases (p < 0.001) (Figure 3). Further analysis of nausea severity showed that group 4 had the highest incidence of moderate (20%) and severe (6.67%) nausea (Table 8).
Bar diagram showing the postoperative nausea/vomiting (PONV) distribution between the four groups.PONV incidence differed significantly among groups (p < 0.001), with 46.67% in group 3 and 66.67% in group 4.
Table 8: Grading of nausea/vomiting distribution between the four groups.Data are presented as absolute counts (N) and percentages (%). A chi-square (χ²) test was used to compare the grading of nausea and vomiting between the four groups. The chi-square value (χ²), degrees of freedom (df), and corresponding p-values are reported in the final row. Statistically significant differences (p < 0.05) are marked with an asterisk (*).N: number of patients; χ²: chi-square test statistic; df: degrees of freedom; P-value: probability value.
The number of nausea episodes did not show significant variation across groups (p = 0.384), with only one patient in group 4 experiencing three episodes (Table 9).
Table 9: Number of episodes distribution between the four groups.Data are presented as absolute counts (N) and percentages (%). A chi-square (χ²) test was used to compare the distribution of episodes between the four groups. The chi-square value (χ²), degrees of freedom (df), and corresponding p-values are reported in the final row. Statistically significant differences (p < 0.05) are marked with an asterisk (*).N: number of patients; χ²: chi-square test statistic; df: degrees of freedom; P-value: probability value.
Treatment for PONV
The administration of ondansetron (Emeset 4 mg IV) was significantly higher in groups 3 and 4 (46.67% and 66.67%, respectively), indicating a higher requirement for antiemetics in these groups (p < 0.001) (Table 10).
Table 10: Treatment distribution between the four groups.Data are presented as absolute counts (N) and percentages (%). A chi-square (χ²) test was used to compare the distribution of treatment between the four groups. The chi-square value (χ²), degrees of freedom (df), and corresponding p-values are reported in the final row. Statistically significant differences (p < 0.05) are marked with an asterisk (*).N: number of patients; χ²: chi-square test statistic; df: degrees of freedom; P-value: probability value.
Summary
Dexamethasone demonstrated a dose-dependent effect in prolonging postoperative analgesia, with higher doses significantly delaying the need for rescue analgesia. However, increased doses were associated with a transient rise in blood glucose levels, with group 1 showing the highest values intraoperatively and postoperatively. Hemodynamic parameters remained stable across all groups, with no clinically significant variations in heart rate, SBP, or MAP. Postoperative nausea and vomiting were more frequent in groups 3 and 4, requiring increased antiemetic intervention. These findings suggest that while dexamethasone effectively enhances postoperative analgesia, the dose-dependent metabolic and gastrointestinal effects should be considered in clinical decision-making.
Discussion
This study confirmed that intravenous dexamethasone significantly prolongs the duration of analgesia in a dose-dependent manner following ultrasound-guided SCBPB. The 8 mg dexamethasone group exhibited the longest analgesia duration (835 ± 66.55 minutes, p < 0.001), followed by the 4 mg (658.33 ± 62.50 minutes) and 2 mg (547.33 ± 53.48 minutes) groups, with the control group having the shortest duration (427 ± 57.31 minutes). Patients receiving dexamethasone required significantly fewer rescue analgesics, particularly in the 8 mg group, where requirements were minimal within the first 24 hours postoperatively. Hemodynamic parameters remained stable across all groups, with no clinically significant variations. While 8 mg dexamethasone led to a significant increase in blood glucose levels (peaking at 128.93 ± 4.42 mg/dL, p < 0.001), no patients required insulin therapy or prolonged hospital stays due to hyperglycemia. Additionally, dexamethasone demonstrated strong antiemetic effects, with the 8 mg and 4 mg groups having no reported cases of PONV, compared to a 46.7% incidence in the 2 mg group and 66.7% in the control group (p < 0.001). These findings suggest that 4 mg IV dexamethasone may provide an optimal balance between prolonged analgesia, reduced opioid consumption, and minimal metabolic side effects.
SCBPB is an established regional anesthesia technique for upper limb surgeries, providing effective intraoperative anesthesia and postoperative analgesia while reducing opioid consumption and its associated side effects [2,15]. The compact arrangement of the brachial plexus at the level of the trunks (C5-T1) allows for dense and reliable anesthesia with a single injection, making it a preferred technique [16]. The introduction of ultrasound guidance has significantly enhanced the accuracy of this block and improved success rates while minimizing complications such as vascular puncture and pneumothorax [3,4].
Despite its effectiveness, a single-shot SCBPB is inherently limited by the pharmacokinetics of the local anesthetic used. Various adjuvants, including opioids, alpha-2 agonists, magnesium, and corticosteroids, have been studied for their potential to prolong the duration of analgesia [5,6]. Among these, dexamethasone has shown significant promise due to its potent anti-inflammatory and analgesic properties [8].
Dexamethasone can be administered perineurally or intravenously. Perineural administration has been reported to provide extended analgesia; however, concerns regarding potential neurotoxicity, impaired wound healing, and an increased risk of infection have limited its widespread adoption [9]. Recent evidence suggests that intravenous dexamethasone is equally effective in prolonging analgesia without the associated neurotoxic risks [10,17]. However, the optimal intravenous dose for maximizing analgesic duration while minimizing systemic side effects remains uncertain.
In this study, three different doses of intravenous dexamethasone (8 mg, 4 mg, and 2 mg) were compared with a control group in patients undergoing upper limb surgery under ultrasound-guided SCBPB. The results confirmed that intravenous dexamethasone significantly prolongs the duration of analgesia in a dose-dependent manner. The 8 mg dexamethasone group exhibited the longest duration of analgesia (835 ± 66.55 minutes, p < 0.001), followed by the 4 mg (658.33 ± 62.50 minutes) and 2 mg (547.33 ± 53.48 minutes) groups. The control group had the shortest analgesia duration (427 ± 57.31 minutes). These findings align with a previous study by Desmet et al., who reported similar results regarding prolonged analgesia with intravenous dexamethasone [7].
The need for rescue analgesia was significantly lower in groups receiving IV dexamethasone, particularly in the 8 mg group, where requirements were minimal in the first 24 hours postoperatively. These results are consistent with previous studies, such as those by Dhanger et al., which demonstrated that even low-dose IV dexamethasone (2 mg) can effectively prolong analgesia and reduce opioid consumption [14].
Hemodynamic parameters remained stable across all groups, with minor, non-clinically significant variations in SBP, DBP, and MAP at 60-90 minutes. These variations were likely due to hemodynamic responses during extubation rather than a direct effect of dexamethasone [12].
One of the main concerns with corticosteroid use is the risk of hyperglycemia. In this study, 8 mg IV dexamethasone significantly increased blood glucose levels intraoperatively and postoperatively, peaking at 128.93 ± 4.42 mg/dL (p < 0.001). This is consistent with previous studies by Hans et al. and Ho et al., who demonstrated a dose-dependent increase in blood glucose levels following IV dexamethasone administration [10,11]. However, none of the patients in this study required insulin therapy or experienced prolonged hospital stays due to hyperglycemia. The 4 mg dose provided an optimal balance between analgesic benefits and minimal metabolic effects, making it a preferable choice in patients at risk of hyperglycemia.
In addition to its analgesic effects, dexamethasone is well known for its antiemetic properties. The results of this study showed that IV dexamethasone significantly reduced the incidence of PONV. The 8 mg and 4 mg groups had no reported cases of PONV, whereas the 2 mg group had a 46.7% incidence, and the control group had a 66.7% incidence (p < 0.001). These findings agree with studies by Gan et al., which highlighted the antiemetic benefits of dexamethasone, particularly in reducing opioid-induced nausea [12].
Clinical implications and future directions
Our findings indicate that IV dexamethasone is a valuable adjuvant for prolonging analgesia following SCBPB. While 8 mg provides the longest duration, it is associated with transient hyperglycemia, suggesting that 4 mg may be the optimal dose for balancing efficacy and safety. Further studies on the long-term metabolic effects of repeated IV dexamethasone doses in surgical patients are warranted.
Limitations of the study
Although this study demonstrates the efficacy of intravenous dexamethasone in prolonging analgesia following SCBPB, certain limitations must be acknowledged. The relatively small sample size (n = 60) may limit the generalizability of the findings to a larger population. Additionally, BMI was not specifically analyzed, making it uncertain whether the findings are applicable to obese patients. The study was limited to ASA I-III patients, excluding ASA IV and diabetic patients to minimize confounding effects on glucose levels. Future studies may consider including diabetic patients with controlled glucose levels to assess safety in this subgroup. Furthermore, the follow-up period was limited to 24 hours postoperatively, meaning long-term effects of dexamethasone on pain relief, hyperglycemia, and other corticosteroid-related metabolic effects were not assessed. Future research should include larger sample sizes, a broader patient population, and an extended follow-up period to further establish the safety and efficacy of intravenous dexamethasone in this context.
Conclusions
This study demonstrates that intravenous dexamethasone prolongs postoperative analgesia following SCBPB in a dose-dependent manner. While higher doses provided extended pain relief, they were associated with transient hyperglycemia, highlighting a trade-off between efficacy and metabolic side effects. Among the doses studied, 4 mg appeared to strike the optimal balance, offering significant analgesic benefits while minimizing adverse effects, including a reduced incidence of PONV. Clinically, 4 mg of intravenous dexamethasone may serve as the preferred dose for routine use, whereas 8 mg should be reserved for cases requiring prolonged analgesia despite the risk of hyperglycemia. Future studies with larger cohorts and extended follow-up periods are needed to further validate these findings and refine the optimal use of intravenous dexamethasone in regional anesthesia.
The reference list from the paper itself. Each links out to its DOI / PubMed record.
- 1Brachial plexus anaesthesia: its indications, technique, and dangers Ann Surg Kulenkampff D 8838918719281786590410.1097/00000658-192806000-00015 PMC 1398572 · doi ↗ · pubmed ↗
- 2Upper extremity regional anesthesia: essentials of our current understanding, 2008 Reg Anesth Pain Med Neal JM Gerancher JC Hebl JR Ilfeld BM Mc Cartney CJ Franco CD Hogan QH 1341703420091928271410.1097/AAP.0b 013e 31819624 eb PMC 2779737 · doi ↗ · pubmed ↗
- 3Ultrasound-guided supraclavicular approach for regional anesthesia of the brachial plexus Anesth Analg Kapral S Krafft P Eibenberger K Fitzgerald R Gosch M Weinstabl C 507513781994810976910.1213/00000539-199403000-00016 · doi ↗ · pubmed ↗
- 4Ultrasound guidance for upper and lower limb blocks Cochrane Database Syst Rev Lewis SR Price A Walker KJ Mc Grattan K Smith AF 02015201510.1002/14651858.CD 006459.pub 3PMC 646507226361135 · doi ↗ · pubmed ↗
- 5Pain relief by dexamethasone as an adjuvant to local anaesthetics in supraclavicular brachial plexus block J Anaesthesiol Clin Pharmacol Golwala MP Swadia VN Dhimar AA Sridhar NV 285288252009 https://journals.lww.com/joacp/abstract/2009/25030/pain_relief_by_dexamethasone_as_an_adjuvant_to.6.aspx
- 6Effect of dexamethasone on the duration of interscalene nerve blocks with ropivacaine or bupivacaine Br J Anaesth Cummings KC 3rd Napierkowski DE Parra-Sanchez I Kurz A Dalton JE Brems JJ Sessler DI 44645310720112167689210.1093/bja/aer 159 · doi ↗ · pubmed ↗
- 7I.V. and perineural dexamethasone are equivalent in increasing the analgesic duration of a single-shot interscalene block with ropivacaine for shoulder surgery: a prospective, randomized, placebo-controlled study Br J Anaesth Desmet M Braems H Reynvoet M 44545211120132358787510.1093/bja/aet 109 · doi ↗ · pubmed ↗
- 8Perioperative single dose systemic dexamethasone for postoperative pain: a meta-analysis of randomized controlled trials Anesthesiology De Oliveira GS Jr Almeida MD Benzon HT Mc Carthy RJ 57558811520112179939710.1097/ALN.0b 013e 31822 a 24c 2 · doi ↗ · pubmed ↗