Longitudinal Analysis of Placental IRS1 DNA Methylation and Childhood Obesity
Ariadna Gómez-Vilarrubla, Maria Niubó-Pallàs, Berta Mas-Parés, Alexandra Bonmatí-Santané, Jose-Maria Martínez-Calcerrada, Beatriz López, Aaron Peñas-Cruz, Francis de Zegher, Lourdes Ibáñez, Abel López-Bermejo, Judit Bassols

TL;DR
This study finds that DNA methylation in the placenta, specifically at the IRS1 gene, may predict childhood obesity and related metabolic risks.
Contribution
The study identifies IRS1 DNA methylation in the placenta as a potential early predictor of childhood obesity.
Findings
IRS1 methylation in placenta correlates with childhood BMI and metabolic risk at age 6.
Placental IRS1 methylation predicts obesity using logistic regression and machine learning models.
IRS1 methylation and gene expression in placenta and blood are linked to metabolic outcomes.
Abstract
Accumulating evidence suggests that the predisposition to metabolic diseases is established in utero through epigenomic modifications. However, it remains unclear whether childhood obesity results from preexisting epigenomic alterations or whether obesity itself induces changes in the epigenome. This study aimed to identify DNA methylation marks in the placenta associated with obesity-related outcomes in children at age 6 and to assess these marks in blood samples at age 6 and whether they correlate with obesity-related outcomes at that time. Using an epigenome-wide DNA methylation microarray on 24 placental samples, we identified differentially methylated CpGs (DMCs) associated with offspring BMI-SDS at 6 years. Individual DMCs were validated in 147 additional placental and leukocyte samples from children at 6 years of age. The methylation and/or gene expression of IRS1 in both…
Genes, proteins, chemicals, diseases, species, mutations and cell lines named across the full text — each resolved to its canonical identifier and authoritative record.
Click any figure to enlarge with its caption.
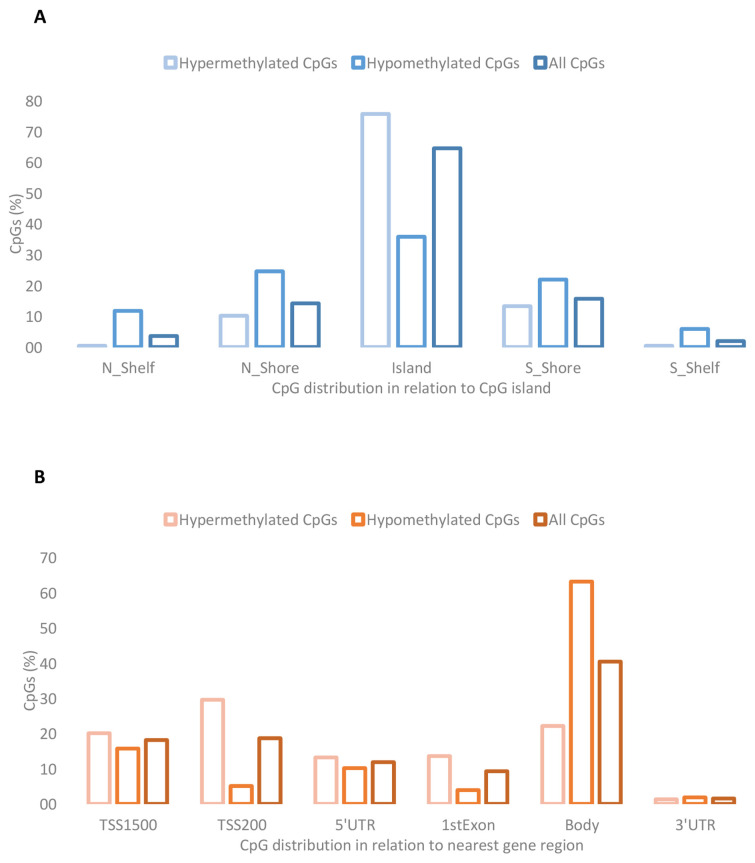 Figure 1
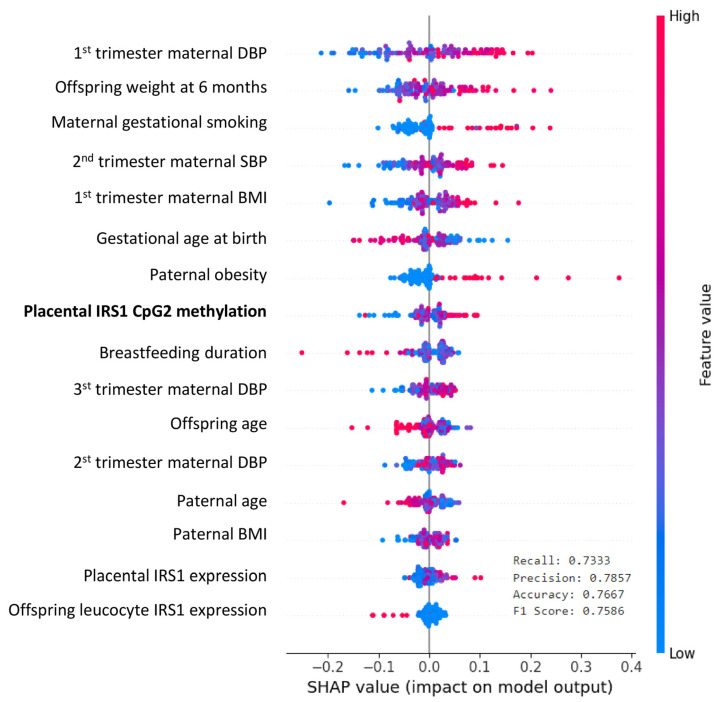 Figure 2
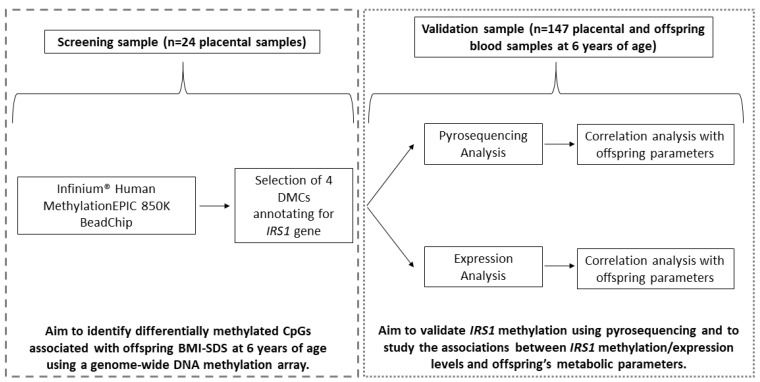 Figure 3
- —Ministerio de Ciencia e Innovación, Instituto de Salud Carlos III (ISCIII), Madrid, Spain
- —FEDER
Peer Reviews
No public reviews on file for this paper yet. If you reviewed it on a platform where reviews are public (OpenReview, ICLR, NeurIPS, ICML), you can paste yours below so the community can read it here.
Videos
No videos yet. Explain this paper in a talk, walkthrough, or lecture? Add one.
Taxonomy
TopicsEpigenetics and DNA Methylation · Birth, Development, and Health · Gestational Diabetes Research and Management
1. Introduction
Childhood obesity is a major public health concern, affecting millions of children and posing significant risks for chronic cardiometabolic disorders traditionally associated with adulthood [1,2]. While genetic and environmental factors contribute to obesity, their predictive power remains limited, underscoring the potential role of epigenetics in understanding the obesity risk [3,4].
DNA methylation, the most widely studied epigenetic mechanism, has been linked to childhood obesity in numerous studies [5]. Candidate-based approaches have identified obesity-associated genes in infants and children [6,7,8], while epigenome-wide association studies (EWAS) have revealed hundreds of differentially methylated sites [9,10]. However, many of these studies lack robust adjustment for confounding factors, and the findings are rarely replicated.
Emerging evidence suggests a bidirectional relationship between obesity and epigenetic changes. Some studies propose that excess weight alters the epigenome, while others indicate that epigenetic changes may predispose individuals to obesity [11,12]. Longitudinal studies are essential to clarify this causal relationship, yet few have examined DNA methylation at multiple time points in children. For instance, a longitudinal study using data from the ALSPAC cohort investigated the associations between early postnatal weight gain and DNA methylation in cord blood, as well as in peripheral blood samples taken at ages 7 and 17 [13]. A recent prospective cohort analysis including 31 children found that the DNA methylation signatures in cord blood remained stable in the saliva at age 6–12 years [14]. However, evidence of the persistence of DNA methylation marks over time is scarce.
Although epigenetic patterns vary across cells [15], some studies have shown that epigenetic marks can be consistent across tissues [16] and over time [17]. Notably, blood-based epigenetic biomarkers may reflect signatures in biologically relevant tissues, such as the adipose tissue [18]. Among these, key regulators of insulin signaling and metabolism may be particularly relevant in the context of the obesity risk. Insulin receptor substrate 1 (IRS1), a crucial mediator of insulin action, plays a central role in glucose homeostasis, lipid metabolism, and the energy balance [19]. Given the placenta’s essential function in fetal nutrient supply and metabolic programming, epigenetic modifications of IRS1 in placental tissue could contribute to long-term metabolic adaptations in offspring. In this context, we hypothesize that DNA methylation marks in placental tissue at birth may influence the body composition and adiposity in offspring at the age of 6 years. We further propose that, while some methylation marks may be unstable and tissue-specific, others could persist over time and serve as early predictors of obesity and metabolic risk in children.
Specifically, we aimed (1) to identify DNA methylation marks in the placenta associated with obesity-related outcomes in offspring at age 6 and (2) to assess these marks in blood samples at age 6 and to study their correlation with obesity-related outcomes at that time.
2. Results
2.1. Participants Characteristics
Table 1 presents the characteristics of the mothers and their offspring in the study population. All women were apparently healthy and had no known diseases except for possible overweight (mean pregestational BMI: 25 kg/m^2^). The children in both groups had similar anthropometric characteristics.
For study purposes, the subjects in the validation group were separated by sex (Table S1). No differences were observed between boys and girls apart from the body mass distribution, as boys had a lower fat mass (FM) and higher lean body mass (LBM) compared to girls.
2.2. Placental DMCs Associated with Obesity Risk in Offspring
A total of 977 CpGs, which were annotated to 816 genes, were differentially methylated in association with BMI-SDS in offspring at 6 years of age. From these, 538 CpGs (55%) presented positive associations (hypermethylated) and 439 CpGs (45%) presented negative associations (hypomethylated). A compilation of the top hypermethylated and hypomethylated DMCs is shown in Table 2, and the full list is shown in Table S2. Among the top hypermethylated DMCs, several were observed to be annotated to the same gene, align in the same direction, and be located close to each other (e.g., TMEM218, ASPG, and IRS1), suggesting they might have greater biological significance.
The genomic distribution of the DMCs with respect to the CpG island and gene regions is shown in Figure 1. We observed the enrichment of DMCs within the CpG island, mainly corresponding to hypermethylated CpGs. With respect to gene regions, we observed the enrichment of hypomethylated CpGs within the body, and the hypermethylated CpGs were mainly distributed in TSS1500, TSS200, and the gene first exon.
The gene set enrichment (KEGG pathways) analysis revealed that DMCs associated with BMI-SDS in offspring were significantly enriched in pathways related to cell proliferation, survival, and metabolism. These pathways included signal transduction (mTOR signaling pathway, phosphatidylinositol signaling system, MAPK signaling pathway, AMPK signaling pathway), endocrine and metabolic diseases (type 2 diabetes, insulin resistance, non-alcoholic fatty liver disease), neurodegenerative diseases (spinocerebellar ataxia, Alzheimer’s disease), carbohydrate metabolism (inositol phosphate metabolism), lipid metabolism (biosynthesis of unsaturated fatty acids), and cancer-related pathways (Table S3).
The clustergram of the top pathways and overlapped genes (Figure S1) showed that phosphatidylinositol 3-kinase (PIK3) regulatory subunits 1 and 2, protein kinase C beta (PRKCB), insulin receptor substrate 1 (IRS1), and insulin receptor (INSR), which were significantly enriched in the KEGG pathways analysis (Table S3), were common genes across the top pathways, highlighting their significant roles in metabolic regulation.
Given that the IRS1 gene had four hypermethylated DMCs (two CpGs among the top hypermethylated ones and two additional CpGs located nearby), and was one of the most abundant genes present in the top enriched pathways, it was selected to be validated in an extended number of samples (validation group).
2.3. Placental IRS1 Methylation
The methylation analysis by pyrosequencing confirmed that, among the four studied CpGs annotated to IRS1, CpG2 was related to an increased BMI in offspring, as its methylation in the placenta was significantly higher in children with BMI-SDS > p50 compared to those with BMI-SDS < p50 (p = 0.01) (Figure S2).
Bivariate correlations showed that placental IRS1 (CpG2) methylation was associated with several parameters related to the body composition and metabolic risk in offspring at 6 years of age, including weight-SDS, BMI-SDS, Δ BW-SDS to weight-SDS, waist, hip, waist-to-height ratio, LBM, FM, and subcutaneous and preperitoneal fat (all p ≤ 0.05) (Table 3).
When separating the population by sex, nearly all correlations were observed in both boys and girls (all p ≤ 0.05) (Table 3), who displayed comparable levels of IRS1 (CpG2) methylation (Table S1). Moreover, in girls, IRS1 (CpG2) methylation also correlated with insulin (p = 0.03) (Table 3 and Figure S3). Most of these correlations maintained statistical significance in multiple regression analyses (MRA) after adjusting for potential confounding variables (bold p-values in Table 3).
2.4. Placental IRS1 Expression
Placental IRS1 expression was positively correlated with placental IRS1 (CpG2) methylation (r = 0.170, p = 0.04) (Figure S4).
In turn, placental IRS1 expression was correlated with several parameters related to the body composition and metabolic risk in offspring at 6 years of age, including LBM, visceral fat, insulin, and HOMA-IR (all p ≤ 0.05) (Table 3). The correlations between placental IRS1 expression and visceral fat remained significant after adjusting for potential confounding variables in the MRA.
When separating the population by sex, no differences were observed in IRS1 expression between boys and girls Table S1). Boys showed positive correlations between placental IRS1 expression and parameters related to body composition (weight-SDS, hip circumference, LBM, and visceral fat), while girls exhibited positive correlations with markers of insulin resistance (insulin and HOMA-IR) (all p ≤ 0.05). After the MRA, the correlation between placental IRS1 expression and visceral fat remained significant in boys, while the correlation with insulin and HOMA-IR was maintained in girls (Table 3 and Figure S5).
2.5. Leukocyte IRS1 Methylation and Expression
IRS1 (CpG2) methylation failed to show significant correlations with IRS1 expression in offspring leukocytes, nor did it correlate with placental IRS1 methylation. Additionally, no significant correlations were observed with parameters related to the body composition and metabolic risk in offspring
However, leukocyte IRS1 expression was correlated with markers of metabolic risk in offspring at 6 years of age, including the waist-to-height ratio and visceral fat, across the entire population. These correlations maintained statistical significance after adjusting for potential confounding variables in the MRA (all p ≤ 0.05) (Table 4). These correlations were stronger and more prevalent in girls, who showed significant correlations with weight-SDS, BMI-SDS, Δ BW-SDS to weight-SDS, waist, waist-to-height ratio, FBM, subcutaneous fat, visceral fat, insulin, and HOMA IR (all p ≤ 0.05) (Table 4 and Figure S6). Most of these correlations remained statistically significant in the MRA after adjusting for potential confounding variables. No significant correlations were observed in boys, and no significant differences in IRS1 (CpG2) methylation were found between boys and girls (Table S1).
2.6. Prediction of Obesity-Related Parameters
LRMs were developed with children’s BMI-SDS status (children with higher BMI-SDS [BMI-SDS > p50] or lower BMI-SDS [BMI-SDS < p50]) as the outcome variable. Predictors included placental IRS1 (CpG2) methylation, age, and sex. IRS1 (CpG2) methylation significantly predicted childhood BMI-SDS (p = 0.01), explaining 7.6% of the variance (R^2^ = 0.076). For each 1% increase in methylation, the odds of a higher BMI-SDS increased by 2.32 (Table S4). A similar model predicting the visceral fat status (higher visceral fat-SDS [>p50] or lower visceral fat-SDS [<p50]) used placental and leukocyte IRS1 expression as predictors, along with age and sex. Both were significant (p = 0.03 and p = 0.02), explaining 7.0% and9.6% of the variance, respectively. For each 1% increase in IRS1 expression, the odds of higher visceral fat increased by 2.69 (placenta) and 5.23 (leukocytes).
ML models incorporating prenatal and infancy clinical variables also showed that placental IRS1 (CpG2) methylation was key in predicting the BMI, alongside the maternal blood pressure, gestational smoking, children’s weight at 6 months, gestational age, maternal BMI, paternal obesity, and breastfeeding duration. The model achieved recall of 0.73, precision of 0.78, accuracy of 0.76, and an F1 score of 0.75 (Figure 2).
3. Discussion
This longitudinal study investigated early-life epigenetic marks as predictors of childhood obesity, identifying 977 DMCs in the placenta associated with children’s BMI-SDS at 6 years of age. Among these, IRS1 emerged as one of the most hypermethylated DMCs. Further analysis of IRS1 methylation and expression in the placenta and blood at 6 years revealed significant associations with metabolic risk and obesity-related parameters at this age. Notably, IRS1 expression in leukocytes at 6 years was also linked to children’s metabolic risk parameters. Prediction models, employing both LRM and ML approaches, suggested that placental IRS1 methylation is a potential robust predictor of the childhood obesity risk.
Among the 977 DMCs in the placenta associated with children’s BMI-SDS at 6 years of age, both hyper- and hypomethylated sites were identified. Notably, several of the top hypermethylated DMCs were annotated to the same genes—TMEM218, ASPG, and IRS1—and aligned in the same direction, clustering closely together, suggesting a potentially greater biological effect. Most hypermethylated DMCs were located in CpG islands, whereas hypomethylated DMCs were also found in shore regions. This distribution aligns with evidence linking CpG island methylation to stable gene silencing and disease processes, while methylation in shore regions is known to display highly conserved, tissue-specific patterns [20,21].
The pathway analysis revealed that placental DMCs associated with childhood obesity were involved in cell proliferation, survival, and metabolism. Type 2 diabetes and the mammalian target of rapamycin (mTOR) signaling pathway ranked highest, with IRS1 among the overlapping genes. mTOR regulates insulin signaling via IRS1 in metabolic tissues and is implicated in diseases like type 2 diabetes, obesity, and cancer [22]. An EWAS in blood from children with obesity and children of normal weight found that “IRS1 target genes” were among the top enriched pathways in the identified CpGs [23]. These findings underscore the importance of IRS1, whose methylation and expression were longitudinally analyzed in placental samples and children’s blood at age 6 in the present study.
The validation analysis in placental samples revealed a significant relationship between IRS1 (CpG2) methylation and childhood BMI-SDS, consistent with the EWAS results. Placental IRS1 methylation and expression were positively correlated. Although IRS1 (CpG2) is located within a CpG island, where gene silencing is typically expected, it is located in the 3’UTR rather than the promoter region. Similar positive associations between 3’UTR methylation and gene expression have been reported in cancer, emphasizing the 3’UTR’s epigenetic significance and potential as a disease biomarker [24].
IRS1 is a key component of insulin signaling [19], binding to the phosphorylated insulin receptor to activate downstream cascades [25]. IRS1 knockout mice suggest its role in adipocyte differentiation [26]. A nearby SNP has been linked to increased visceral fat, insulin resistance, dyslipidemia, diabetes, and coronary artery disease risks [27]. IRS1 expression in human adipose tissue relates to the fat distribution and metabolic traits [28]. Our findings were consistent with the aforementioned results, showing that IRS1 CpG2 methylation and expression in the placenta correlated with children’s metabolic parameters at age 6, including obesity (waist-to-height ratio and subcutaneous, preperitoneal, and visceral fat) and insulin resistance markers (insulin and HOMA-IR).
Some of the correlations showed sexual dimorphism. Boys presented stronger correlations between placental IRS1 expression and fat distribution, while placental IRS1 expression in girls strongly correlated with insulin resistance-related variables. Sexual dimorphism has previously been reported as the genetic basis of fat distribution [29], and sex-dimorphic effects on fasting insulin at IRS1 loci have also been described [30]. Recent studies have also shown sex differences in subcutaneous adipose tissue IRS1 mRNA expression in adults with obesity [31]. Our results suggest that this sexual dimorphism may already be present before birth and influence visceral fat accumulation in boys by age 6.
It is worth noting that methylation marks are often tissue-specific, and placental epigenetic marks do not necessarily correspond to systemic methylation changes. In this regard, the lack of correlation between IRS1 methylation in the placenta and in leukocytes could be attributed to tissue-specific variability in DNA methylation patterns [20]. However, we did observe an association between IRS1 methylation and/or expression and children’s metabolic parameters at two time points (placenta at birth and leukocytes at 6 years), highlighting the potential significance of this gene in obesity development across different life stages. Finally, prediction models using both LRM and ML methods demonstrated that IRS1 methylation in the placenta strongly predicts children’s obesity.
Our data provide evidence that placental IRS1 methylation could potentially serve as a biomarker for the childhood obesity risk. This study highlights the potential of early-life epigenetic marks, such as those identified in IRS1, as predictive tools in identifying children at a higher risk of developing obesity and related metabolic conditions. This could enable targeted early interventions aimed at modulating risk factors and improving long-term health outcomes.
The major strengths of our study include the longitudinal design and the availability of placental and children’s blood samples from a large, well-phenotyped cohort. Additionally, placenta-based biomarkers may offer clinical relevance due to the simplicity of obtaining and analyzing samples, making them promising candidates for predictive biomarkers. However, some limitations must be acknowledged. The small sample size prevented stratification based on BMI-SDS categories (BMI-SDS < 1, normal weight; 1 < BMI-SDS < 2, overweight; and BMI-SDS > 2, obese). Moreover, the imbalance between children with obesity and children without obesity at 6 years required us to define the BMI status using the 50th percentile as a reference. A larger sample would improve the statistical power and ML model reliability, leading to more robust conclusions.
Moreover, it would be valuable to validate these results in other independent cohorts, as well as to investigate the applicability of our findings to other ethnic groups.
Another limitation of this study was the inability to include additional variables such as the maternal diet, socioeconomic status, and paternal obesity in the multiple regression analysis, as data on these factors were either unavailable or incomplete.
In conclusion, we present the first longitudinal data on IRS1 methylation and expression in the placenta and children’s leukocytes at age 6. We propose that placental IRS1 methylation may play a role regulating obesity and metabolic risk parameters and could serve as an early biomarker for metabolic risk. Our findings highlight the importance of altered placental DNA methylation in fetal programming and the development of non-communicable diseases like childhood obesity. This paves the way for the future use of placenta-based epigenetic biomarkers to predict disease and metabolic dysfunction.
4. Materials and Methods
4.1. Study Participants
This study included 171 pregnant women and their infants from a population-based prenatal cohort in Girona. Of these, 24 women were part of the screening analysis to identify differentially methylated CpG sites (DMCs) associated with BMI-SDS in offspring at age 6 using an EWAS. The remaining 147 mother–infant pairs formed the validation group, used to validate 4 selected DMCs related to the IRS1 gene through pyrosequencing. The sampling method ensured the accurate representation of maternal (pre-pregnancy BMI and age) and offspring characteristics (gender and BMI at 6 years) (Table 1). The study design flow chart is shown in Figure 3, with the inclusion and exclusion criteria detailed in the Supplementary Methods.
4.2. Biological Samples
Four placental tissue biopsies and fasting peripheral blood samples from children were collected at birth and at 6 years of age, respectively. Further details of sample collection and handling are provided in the Supplementary Methods.
4.3. Clinical Assessments
Information on pregnancy, labor, and delivery characteristics was obtained from standardized medical records. The maternal weight at the beginning of gestation (6–9 weeks) was used as a proxy for the pregestational weight. The pregestational BMI was calculated as the pregestational weight divided by the height squared (kg/m^2^). Newborns were weighed and measured immediately after delivery using a calibrated scale and measuring board, respectively. Gestational age- and sex- adjusted z-scores (SDS) for birth weight and length were calculated using regional norms [32].
Anthropometric measurements and blood samples from children were collected during a follow-up visit at age 6. Further details are provided in the Supplementary Methods.
4.4. Infinium MethylationEPIC BeadChip Microarray
A placental epigenome-wide DNA methylation microarray was performed in 24 samples (screening group) using the Infinium^®^ Human MethylationEPIC BeadChip (Illumina, San Diego, CA, USA), covering a total of 850,000 CpGs. Placental DNA was isolated using the Gentra Pure-Gene Tissue Kit (QIAGEN, Hilden, Germany). DNA quality checks, bisulfite treatment, and hybridization were performed at the Epigenomics Unit IIS La Fe (Valencia, Spain), following the manufacturer’s protocol (Illumina Infinium HD methylation protocol).
Further details of data normalization and the statistical analysis of associations between DMCs and BMI-SDS in offspring are provided in the Supplementary Methods.
Gene annotation for the DMCs associated with offspring BMI-SDS was performed as previously described elsewhere [33]. Raw DNA methylation data have been deposited in the Gene Expression Omnibus data repository under accession number GSE192812.
4.5. Pathway Analysis
Gene set enrichment analysis was conducted using the Enrichr analysis tool version 3.3 (Ma’ayan Lab at the Icahn School of Medicine at Mount Sinai, New York, NY, USA). Enrichr identified relevant Gene Ontology (GO) terms and functional pathways associated with the genes annotated for the DMCs in relation to offspring BMI-SDS.
4.6. DNA Methylation Assessment
The methylation percentages of the four DMCs, derived from the microarray analysis and annotated to the IRS1 gene, were assessed in the placental and blood samples from the validation group using sodium bisulfite pyrosequencing. Amplifying primers were designed with the PyroMark Assay Design 2.0 software (QIAGEN, Hilde, Germany) and are listed in Table S5. Details of DNA isolation, bisulfite conversion, real-time PCR amplification, and pyrosequencing are provided in the Supplementary Methods.
4.7. Gene Expression Assessment
IRS1 expression levels were assessed by quantitative reverse transcription PCR (RT-qPCR). Further details are provided in the Supplementary Methods.
4.8. Statistical Analysis
The pyrosequencing and gene expression data from the validation group were analyzed using SPSS version 22.0 (IBM, New York, NY, USA). Further details of the data analysis and statistical tools are provided in the Supplementary Methods.
4.9. Prediction Analysis
Logistic regression models (LRM) were used to examine the contributions of the selected DMCs to the prediction of obesity and metabolic risk. The case–control status (higher or lower risk) served as the outcome variable, while the methylation or expression levels, along with age and sex, were predictors. Further details of the predictive models using machine learning (ML) analyses are provided in Supplementary Methods.
The study was approved by the Ethics Committee of the Institutional Review Board of Dr. Josep Trueta Hospital of Girona (Spain). Informed written consent was obtained from all participants, and data were anonymized. Data will be made available upon reasonable request.
The reference list from the paper itself. Each links out to its DOI / PubMed record.
- 1Garrido-Miguel M. Cavero-Redondo I. Álvarez-Bueno C. Rodríguez-Artalejo F. Moreno L.A. Ruiz J.R. Ahrens W. Martínez-Vizcaíno V. Prevalence and Trends of Overweight and Obesity in European Children From 1999 to 2016: A Systematic Review and Meta-analysis JAMA Pediatr.2019173 e 19243010.1001/JAMAPEDIATRICS.2019.243031381031 PMC 6686782 · doi ↗ · pubmed ↗
- 2Lee E.Y. Yoon K.H. Epidemic obesity in children and adolescents: Risk factors and prevention Front. Med.20181265866610.1007/s 11684-018-0640-130280308 · doi ↗ · pubmed ↗
- 3Novelli G. Cassadonte C. Sbraccia P. Biancolella M. Genetics: A Starting Point for the Prevention and the Treatment of Obesity Nutrients 202315278210.3390/nu 1512278237375686 PMC 10305006 · doi ↗ · pubmed ↗
- 4Sivakumar S. Lama D. Rabhi N. Childhood obesity from the genes to the epigenome Front. Endocrinol.202415139325010.3389/FENDO.2024.1393250 PMC 1126302039045266 · doi ↗ · pubmed ↗
- 5Alfano R. Robinson O. Handakas E. Nawrot T.S. Vineis P. Plusquin M. Perspectives and challenges of epigenetic determinants of childhood obesity: A systematic review Obes. Rev.202223(Suppl. S 1)e 1338910.1111/obr.1338934816569 · doi ↗ · pubmed ↗
- 6Gallardo-Escribano C. Buonaiuto V. Ruiz-Moreno M.I. Vargas-Candela A. Vilches-Perez A. Benitez-Porres J. Romance-Garcia A.R. Ruiz-Moreno A. Gomez-Huelgas R. Bernal-Lopez M.R. Epigenetic approach in obesity: DNA methylation in a prepubertal population which underwent a lifestyle modification Clin. Epigenetics 20201214410.1186/S 13148-020-00935-032967728 PMC 7509923 · doi ↗ · pubmed ↗
- 7Mansell T. Ponsonby A.L. Collier F. Burgner D. Pezic A. Vuillermin P. Ryan J. Saffery R. Carlin J. Allen K. Methylation of the LEP gene promoter in blood at 12 months and BMI at 4 years of age-a population-based cohort study Int. J. Obes.20204484284710.1038/S 41366-020-0553-332107462 · doi ↗ · pubmed ↗
- 8Mansell T. Burgner D. Ponsonby A.L. Collier F. Pezic A. Vuillermin P. Juonala M. Ryan J. Saffery R. HIF 3A cord blood methylation and systolic blood pressure at 4 years—A population-based cohort study Epigenetics 2020151361136910.1080/15592294.2020.178102732530724 PMC 7678916 · doi ↗ · pubmed ↗