Role Analysis of the scarb1 Gene in the Pigmentation of Neocaridina denticulata sinensis
Lili Zhang, Guodong Wang, Haifan Li, Tanjun Zhao

TL;DR
This study explores how the scarb1 gene affects body color in cherry shrimp, finding it influences pigmentation through chromatophore development.
Contribution
The study identifies scarb1 as a key gene involved in pigmentation and provides insights for breeding strategies in ornamental shrimp.
Findings
scarb1 expression is highest in red shrimp and the pre-nauplius stage.
RNAi silencing of scarb1 increases chromatophore development in the metanauplius stage.
A specific SNP in scarb1 shows different frequencies between yellow and other colored shrimp.
Abstract
This study investigates the role of scavenger receptor class B type I (scarb1) in the body color of Neocaridina denticulata sinensis (cherry shrimp). This research aims to understand the relationship between scarb1 and pigmentation by analyzing the expression patterns of the scarb1 gene in different color populations and developmental stages, performing RNA interference (RNAi) to silence scarb1, and identifying single nucleotide polymorphisms (SNPs) within the gene. The results showed significant differences in scarb1 expression across color populations and developmental stages, with the highest expression in red shrimp and the pre-nauplius stage. Silencing scarb1 via RNAi increased chromatophore development in the metanauplius stage. A specific SNP in *scarb1* showed significantly different frequencies between yellow shrimp and shrimp of other colors. This study concludes that scarb1…
Genes, proteins, chemicals, diseases, species, mutations and cell lines named across the full text — each resolved to its canonical identifier and authoritative record.
Click any figure to enlarge with its caption.
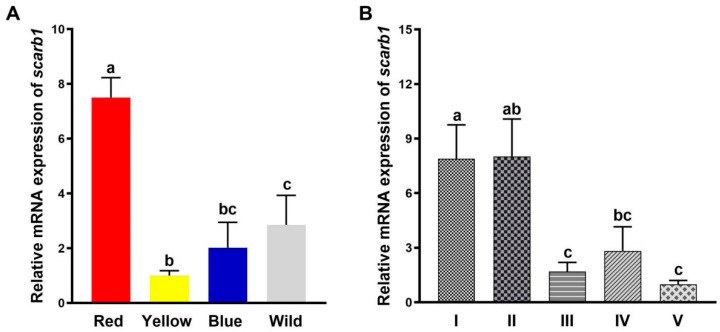 Figure 1
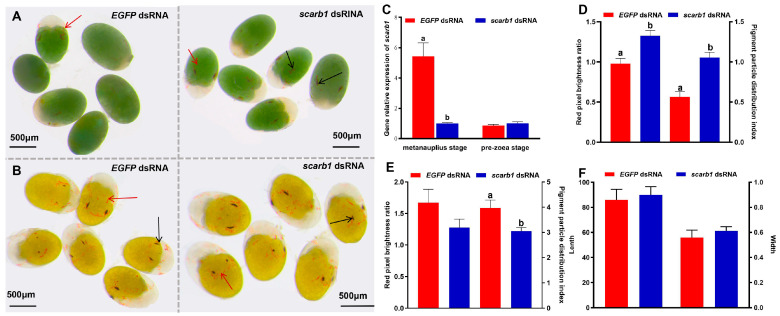 Figure 2
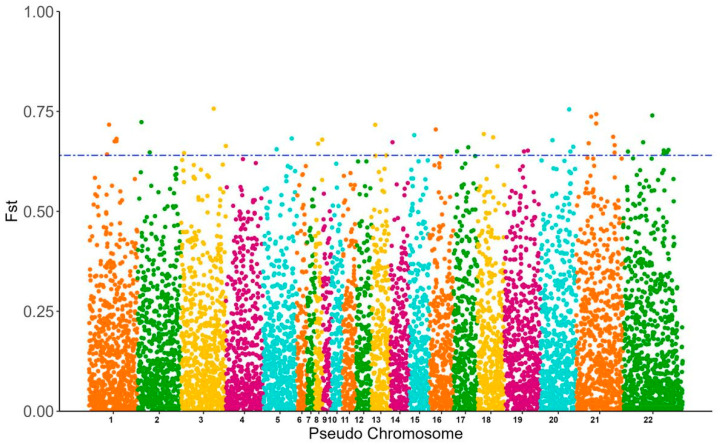 Figure 3
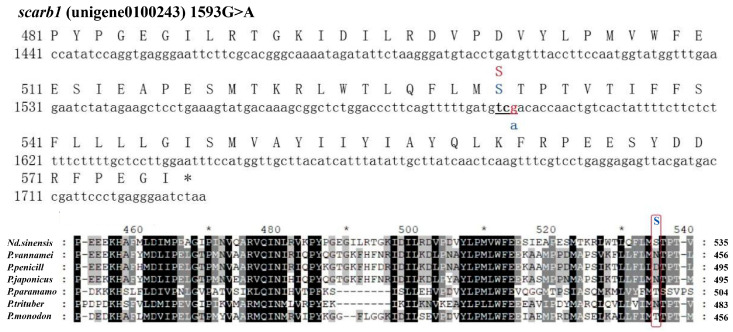 Figure 4
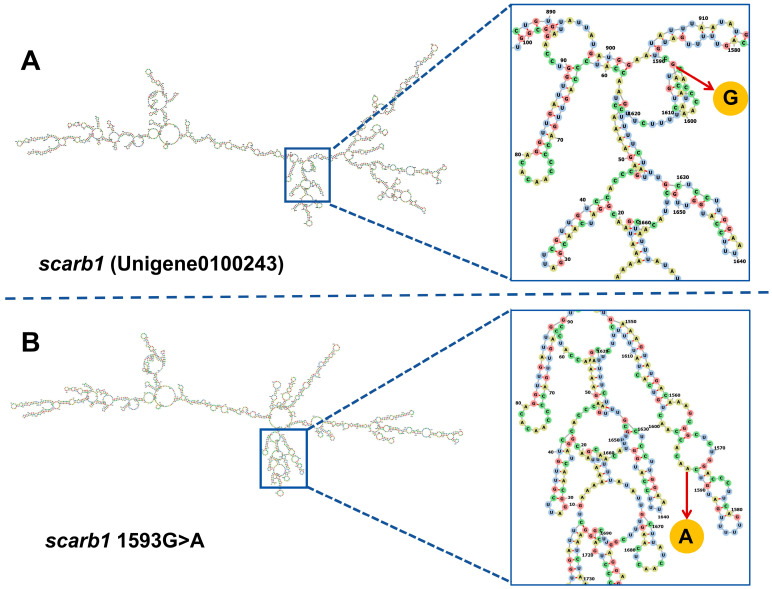 Figure 5
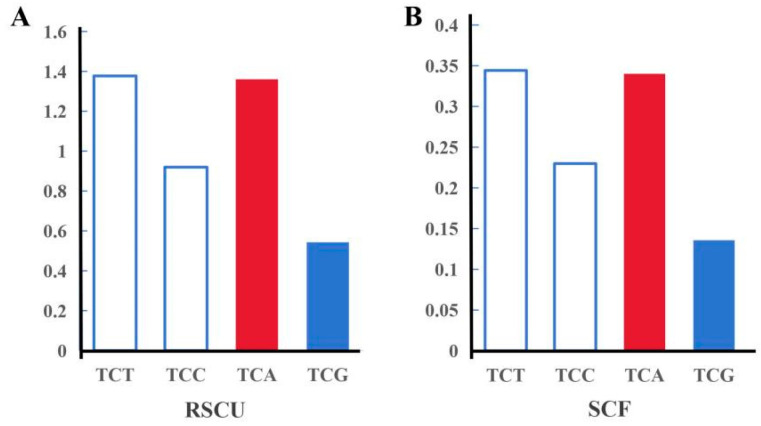 Figure 6
- —National Natural Science Foundation of China
- —Natural Science Foundation of Fujian Province
Peer Reviews
No public reviews on file for this paper yet. If you reviewed it on a platform where reviews are public (OpenReview, ICLR, NeurIPS, ICML), you can paste yours below so the community can read it here.
Videos
No videos yet. Explain this paper in a talk, walkthrough, or lecture? Add one.
Taxonomy
TopicsBotanical Research and Applications · Plant Gene Expression Analysis · Horticultural and Viticultural Research
1. Introduction
Cherry shrimp (Neocaridina denticulata sinensis) is a small shrimp that is widely distributed in the freshwater waters of Asia [1]. This species has strong environmental adaptability, with a wide tolerance range of temperatures and pH levels [2]. Red or blue mutants often appear in natural populations, in which almost all individuals are wild-type with some black spots. Since the 1990s, red mutants have been cultivated and have gradually become an ornamental shrimp named cherry shrimp [3]. Red cherry shrimps stand out from the green background of aquatic plants and have become a major fresh ornamental shrimp since 2003 [4]. Mutants of other colors were also selected from natural populations according to the cultivation process of red mutants. Populations with various body color phenotypes have been gradually cultivated through multiple generations of intragroup mating. Red, yellow, and blue populations are the most common ornamental shrimp of N. d. sinensis. Carotenoids are the main cause of color in most crustaceans [5]. Our previous data suggested that the color of cherry shrimp was mainly from various carotenoids.
Carotenoids, a type of natural pigment with the widest distribution, are found in a variety of organisms, including photosynthetic bacteria, archaea, fungi, algae, plants, and animals [6,7]. Almost all animals cannot synthesize carotenoids de novo, but obtain and convert carotenoids from food [8]. Initially, it was posited that carotenoids undergo transmembrane transport via simple diffusion [9]; however, subsequent discoveries indicating the existence of selectivity and saturation have substantiated that facilitated diffusion is the principal mode of absorption [10]. The first identified transporter of carotenoids was scarb1, through which intestinal epithelial cells absorb carotenoids from intestinal contents. Following the knockout of scarb1 in mice, the absorption of carotene and carotenol in the intestinal tenue significantly decreased [11]. In addition, cluster determinant 36 (CD36) has also been proven to be another transporter of carotenoids, involved in the transmembrane transport of carotenoids in intestinal epithelial cells [12]. Both scarb1 and CD36 are transmembrane glycoproteins with a large extracellular domain. Their 3D structures, obtained from homologous modeling, indicate that the large cavity throughout the entire molecule might serve as a channel for transporting lipids [13,14]. The two proteins recognize their ligands using molecular patterns rather than specific epitopes, resulting in a variety of ligand types [15]. Scarb1 also transports vitamin E and vitamin K besides carotenoids [16,17]. By binding to high-density lipoproteins (HDLs), scarb1 plays an important role in cholesterol transmembrane transport [18]. There are more ligands of CD36, including carotenoids, long-chain lipids, lipoproteins, thrombospondin-1, collagen, apoptotic cells, amyloid B, and red blood cells infected with malaria [18].
The function of scarb1 in carotenoid transportation is highly conserved in evolution. In Drosophila, the scarb1 homolog ninaD transports zeaxanthin and β-carotene, and the loss of ninaD function is associated with the loss of compound eye pigments [19]. A non-synonymous mutation of ninaD leads to a lack of carotenoids, retinoic acid, and vitamin E in Drosophila. NinaD expression in the midgut of Drosophila larvae is necessary for the occurrence of compound eyes [20]. The silkworm homolog of scarb1 is a key factor in the accumulation of carotenoids in silk, and loss-of-function mutations can produce a phenotype of white cocoons [18]. The color of feathers and skin in canaries (Serinus canaria) also requires scarb1, which mutates and inactivates to produce a phenotype of recessive white feathers [21]. Moreover, there is an extremely low level of carotenoids in the blood and tissues of the white mutant, an organism that is severely deficient in vitamin A [21].
There were different expression levels of scarb1 in our previous comparison of the transcriptomes of various colored populations of cherry shrimp [22]. In this paper, we obtained the expression profiles of scarb1 in different color populations and developmental stages using qPCR. By silencing scarb1 via RNAi to corroborate its function in the embryos, a SNP in scarb1 was identified and its correlation analysis with color populations was processed. Our data could provide a new perspective for the functional analysis of the scarb1 gene in cherry shrimp.
2. Materials and Methods
2.1. Experimental Animals
We used four different color populations of cherry shrimp during the experiment: red, yellow, blue, and wild populations. All color populations have undergone more than three years of breeding and have pure colors and a stable genetic inheritance. Thirty adult females and 10 males were cultured in a glass tank (40 cm × 30 cm × 25 cm) containing 500 g aqua soil and two 5 cm segments of Elodea nuttallii. The cultivation medium was tap water that had been aerated for more than 24 h, with half of the water changed every three days. The water temperature was maintained at 25 ± 1 °C. All shrimp were transferred to a new glass tank once a month. After three months, offspring grew up to about 1.2 cm in length, with about 300 individuals.
The cherry shrimp were frozen in liquid nitrogen and crushed in a mortar cooled by liquid nitrogen. The fine powder of the samples served as a biological replicate and was stored at −80 °C. There were seven biological replicates for each color population. For sampling the tissues of cherry shrimp, seven offspring were removed from a culture tank to a small breaker with 30 mL water on ice. After low-temperature paralysis, an individual was placed under a dissecting microscope to dissect and collect tissues from its compound eyes, hepatopancreas, muscles, epidermis, and digestive tract. All samples were firstly frozen in liquid nitrogen and stored at −80 °C. For sampling cherry shrimp embryos, berried females were collected and transferred to a new glass tank. The development stage was identified by microscopic observation with an anatomic microscope, according to the description of Lu et al. [23]. The chromatophores first appear at the metanauplius stage and gradually mature through the pre-zoea and membrane-zoea stages [24]. Larvae from these three stages, as well as the pre-nauplius and post-larva stages, were selected for the detection of gene expression. Embryos were removed from female appendages using tweezers. All embryos of a berried female served as a biological replicate. There were seven replicates in each sampling stage for qPCR. All replicates were frozen in liquid nitrogen and stored at −80 °C.
2.2. Total RNA Extraction, cDNA Preparation, and Quantitative PCR (qPCR)
Total RNA extraction was processed with RNA-solv reagent (Omega Bio-tek, Inc., Norcross, GA, USA) according to the manufacturer’s protocol. Approximately 1 μg total RNA was used as a template to synthesize the first strand of its DNA. The cDNA synthesis reagent kit was from TIANGEN (Tiangen Co., Ltd., Beijing, China). The detailed operation process was carried out according to its manual. Primers (Table 1) for qPCR were designed using Primer3 online software (https://sourceforge.net/projects/primer3/, accessed on 17 March 2025) and synthesized by TsingKe Biotechnology Co., Ltd. (Beijing, China). The relative expression level of the target gene was calculated using the 2^−ΔΔCt^ method based on the internal reference gene of glyceraldehyde-3-phosphate dehydrogenase (GAPDH, GenBank accession MZ734609). The GenBank accession for scarb1 is PRJNA1209655. The qPCR reaction was performed in a 10 μL reaction volume, including 0.25 μL of the forward primer (10 mM), 0.25 μL of the reverse primer (10 mM), 5 μL of SYBR green master mix (GOY-P2028, Coybio, Shanghai, China), and 4.5 μL of the cDNA template. PCR was carried out on a QuantStudio 6 Flex instrument (Applied Biosystems, Carlsbad, CA, USA), with the following procedure: 95 °C for 5 min, 40 cycles of 95 °C for 10 s, 60 °C for 10 s, and 72 °C for 10 s.
2.3. dsRNA Synthesis and RNAi
In vitro transcription was used to prepare the dsRNA for RNAi. We chose an approximately 300 bp sequence located at the 5′ end of the open reading frame (ORF) as the template for synthesizing dsRNA in vitro. The PCR primers for target DNA amplification are shown in Table 1. The details of the dsRNA synthesis were described previously [25]. In brief, the target DNA fragment was added to the T7 promoter sequence at the 5′ end or 3′ end, respectively, by the second PCR amplification, which added the T7F primer or T7R primer (Table 1), which was added to the T7 promoter sequence at the 5′ end of the specific primer. The new DNA fragment with the T7 promoter sequence was chosen as the template for the sense ssRNA or anti-sense ssRNA of the target gene. The sense and anti-sense ssRNA strands were equivalently mixed and annealed to the dsRNA. The annealing procedure was set at 75 °C for 15 min, 65 °C for 15 min, and then dropped to 25 °C at a rate of 0.2 °C/s. The dsRNA of EGFP served as a control to verify the effect of non-specific dsRNA. All primers used in dsRNA preparation are listed in Table 1.
The embryos of the expected stages were collected as above. All embryos from the same berried shrimp were rinsed three times with ultrapure water (0.01 μm) and divided into two equal parts. An appropriate amount of dsRNA was added to ensure that the final concentration was 5 μg/mL. One part was exposed to 5 μg/mL scarb1 dsRNA for 24 h as the treated group (TG), and the other was exposed to 5 μg/mL EGFP dsRNA for 24 h as the control group (CG). After 24 h post-transfection, the samples from the TG and CG were collected for further qPCR analyses and observation. Embryos from one female served as one biological replicate. There were five biological replicates for each gene interference. After dsRNA exposure, the embryonic phenotype was observed and photographed under a microscope.
The red pixel brightness ratio of chromatophores was obtained using Adobe Photoshop2020 software. In general, chromatophores were selected using the magnetic lasso tool, and the histogram of the selected area showed the red pixel brightness and total pixel brightness. The red pixel brightness (RPB) ratio was defined as the ratio of red pixel brightness to total pixel brightness. The length and width values of chromatophore clusters in compound eyes were calculated using Image J1. The state of pigment distribution within chromatophores was assessed by a 5-point scale as follows: stage 1, maximal concentration; stage 5, maximal dispersion; and stages 2, 3, and 4, intermediate conditions, as defined by Hogben and Slome [26]. The pigment distribution scale (PDS) of an embryo was presented by the mean scale of all of its chromatophores.
2.4. Calling and Filtrating SNPs
The calling of SNPs was processed using the Genome Analysis ToolKit (GATK) (v4.5.0.0) [27,28], based on our previous transcriptome data from 216 shrimp from four color populations (red, yellow, blue, and wild) [29]. The potential SNPs were filtered by quality scores ≥ 30, reading depths ≥ 10, and minor allele frequencies ≥ 0.05 to select high-quality SNPs [30]. The frequency of mutant (minor) alleles on each locus of each population was calculated using the read counts of mutant alleles divided by all read counts on the locus. The frequency of the reference allele equaled 1 minus the frequency of mutant alleles. Subsequently, the heterozygosity (H) of each population was calculated using the formula: H = 2 × reference allele frequency × mutational allele frequency, and the average heterozygosity of all populations (H_S_) was defined as the average value of H in all populations. Moreover, the total frequency of the reference allele and mutational allele on each locus was calculated using the total allelic read counts divided by all read counts on the mono locus of the total individuals, and the total heterozygosity (H_T_) was calculated by the formula: H_T_ = 2 × total reference allele frequency × total mutational allele frequency. Finally, the F_st_ value was estimated by the formula F_st_ = (H_T_ − H_S_)/H_T_.
2.5. Genotyping of Candidate SNPs
SNPs ranking in the top 5% according to F_st_ value were defined as candidate SNPs. Genotyping of a candidate SNP in scarb1 was conducted using GT-seq (genotyping-in-thousands by sequencing). GT-seq is a method that uses next-generation sequencing of multiplexed PCR products to generate genotypes from targeted SNPs for thousands of individuals in a single Illumina HiSeq lane [31]. The details of GT-seq were described previously [30].
The individuals of four color populations were used for genotyping. There were 384 individuals in each population. A pleopod of a shrimp was used to extract genomic DNA using Chelex-100 (Solarbio Science & Technology Co., Ltd. Beijing, China). Pearson’s χ^2^-test was performed to investigate the relationships between the SNP genotype and body color. p < 0.05 was considered significant.
The numbers of codon usage of an amino acid were counted using codon W software (v1.4.2) based on the coding sequence (CDS) of cherry shrimp transcriptomes. Relative synonymous codon usage (RSCU) and synonymous codon frequency (SCF) were used to represent codon usage bias. RSCU represents the ratio between the usage count of a synonymous codon and its expected occurrence. The expected value of RSCU is 1, which is more than the mean of preferable usage. SCF denotes the frequency of codons encoding the same amino acid, with a value closer to 1 indicating a stronger preference. RNA secondary structures were predicted using the mfold of UNAFold (http://www.unafold.org/mfold/applications/rna-folding-form-v2.php, accessed on 17 March 2025). The multiple sequence alignment of scarb1 homologs was analyzed using Clustal W2.1 and edited using BioEdit 7.0.
3. Results
3.1. Scarb1 Expression Profiles
There were significant differences in scarb1 expression between red, blue, yellow, and wild populations (p < 0.05) (Figure 1A). The expression level in the red population was significantly higher than in the other three populations (p < 0.05), and the expression in the wild population was significantly higher than in the yellow population (p < 0.05). However, there was no significant difference between wild and blue populations (p > 0.05) (Figure 1A).
Scarb1 expression levels at the nauplius stage were significantly higher than at the zoea stages (p < 0.05) (Figure 1B). There was no significant difference in the red pixel brightness (RPB) ratio and the pigment distribution scale (PDS) between pre-nauplius and metanauplius groups and pre-zoea, membrane-zoea, and post-larva groups (p > 0.05) (Figure 1B).
3.2. Functional Analyses of Scarb1 via RNAi
There appeared to be phenotypic changes in chromatophores (Figure 2A). At the metanauplius stage, the number of chromatophores in the treatment group was more than in the control group, especially near the ommateum (Figure 2A). There appeared to be two clusters of ommateum chromatophores and several developed chromatophores with branches in the treatment group (Figure 2A). On the other hand, only one individual in the control group had a cluster of ommateum chromatophores, and most individuals had one pair of chromatophores without any branching (Figure 2A). Meanwhile, the treatment of scarb1 dsRNA exposure significantly decreased its expression (p < 0.05) at the metanauplius stage (Figure 2C). The PDS and RPB ratios of the treatment group were significantly higher than those of the control group (p < 0.05) (Figure 2D).
At the pre-zoea stage, dsRNA exposure had no effect on silencing scarb1 expression levels, with no significant difference between the treatment group and the control group (Figure 2B). There was no difference in the RPB ratio between the treatment group and the control group at the pre-zoea stage (p > 0.05) (Figure 2E). The number of chromatophores in the control group was similar to the treatment group (p > 0.05), but the PDS of the control group was higher than the treatment group (p < 0.05) (Figure 2E). The length and width of ommateum chromatophore clusters in the treatment group were higher than in the control group, but there was no difference between the two groups (p > 0.05) (Figure 2F).
3.3. SNP Genotyping
There were 326,902 potential SNPs, as called by GATK, and 8424 high-quality SNPs after filtration (Figure 3). The average F_st_ of high-quality SNPs was 0.164, and the F_st_ of the top 5% was 0.640. There was one candidate SNP in scarb1, named G1593A, which was a synonymous mutation and coded for serine (S521). The SNP was located at the third position of the serine codon (Figure 4). The second structure of the reference allele was different than that of the alternative allele (Figure 5). The TCG and TCA codons were from the reference allele and the alternative allele, respectively. The RSCU of TCG was 0.54 and was lower than that of TCA (1.36). The codon usage for the SNP with TCG changed to TCA changed from 13.5% to 34.0%. The other two codons of serine were TCT and TCC, with RSCU values of 1.38 and 0.92 (Figure 6).
The genotype of all red individuals was AA, and the genotype of yellow individuals was GA (Table 2). There was a significant genotype frequency between the red population and the yellow population (p < 0.05). Meanwhile, the blue population and the wild population carried two genotypes (AA and GA), with no significant genotype frequency in the two populations (p > 0.05). Most individuals in the blue population and the wild population were AA homozygotes, with a few individuals being GA heterozygotes. The genotype frequency of the yellow population was significantly different from the blue population and the wild population (p < 0.05).
4. Discussion
Scavenger receptors are a kind of cell surface protein with the ability to clear non-self substances or self mutated molecules and play a role in phagocytosis, endocytosis, adhesion, and signal transduction [32]. There are a total of 12 types of scavenger receptors, and their structures vary greatly. Scavenger receptor class B (scarb1) has two transmembrane domains, one large extracellular domain, and two small intracellular domains. Scarb1 selectively transports lipids and is a major cell membrane surface receptor for HDL, which was found to be involved in the uptake and transport of carotenoids [33].
Scarb1 is a multifunctional protein in animals that participates in physiological processes. It has recently been reported that scarb may be an important mediator of astaxanthin uptake in shrimp [34]. A knockout of or decrease in the expression of scarb1 will lead to changes in carotenoid content in various animals, such as the sharp decrease in the absorption of β-carotenoid and zeaxanthin in the retinal pigment cells of mammals [11,35], the lack of carotenoids in canary feathers [21], the decrease in astaxanthin content and the appearance of white skin in carp [36], impaired carotenoid pigment deposition function in zebrafish [37], and the lack of carotenoids and retinoids in Drosophila [38,39]. The overexpression of scarb1 in mammalian retinal pigment epithelial cells led to greater carotenoid absorption [10]. The higher expression of scarb1 was consistent with the appearance of numerous chromatophores at the pre-nauplius stage of cherry shrimp. The results suggested that scarb1 was involved in the transport of chromatophores and pigmentation in chromatophores. After silencing scarb1 in cherry shrimp, the development of chromatophores and pigmentation was inhibited. The result was consistent with the above articles, which suggested that scarb1 might promote the absorption of carotenoids in chromatophores. In addition, scarb1 expression did not match any kind of carotenoid content, except β-cryptoxanthin, in the four color populations (blue, red, yellow, and wild) of cherry shrimp. Because of the diversity of scarb1 ligands, scarb1 in cherry shrimp might prefer to transport β-cryptoxanthin more than the other carotenoids. The RNAi subject was erythrophores. In cherry shrimp embryos, erythrophores are the only chromatophores that mainly contain astaxanthin [25]. The decrease in β-cryptoxanthin transport might had a minor effect on the hue of embryo erythrophores, so the effect of scarb1 RNAi in cherry shrimp was not as obvious as in the above research. However, our previous data showed that once pigmentation has occurred in erythrophores, the color phenotype almost never changes, and RNAi also had no effect. In this paper, RNAi treatment was applied at the beginning of the occurrence of erythrophores (the metanauplius stage) for a greater effect on color phenotype. Once a large number of erythrophores appeared at the pre-zoea stage, especially when clusters of ommateum chromatophores became thicker, it became difficult for RNAi to alter the color phenotype or even to reduce the expression level of the target genes. There is only 1–2 h for dsRNA exposure at the pre-zoea stage. The asynchronous development of cherry shrimp is a common event. It is difficult to obtain embryos from a maternal parent that has developed synchronously for RNAi. Therefore, this paper did not achieve the expected result of RNAi at pre-zoea. The precise reason for the non-functioning dsRNA exposure remains unknown to us. The inability of dsRNA to enter mature pigment cells could be an important factor.
G1593A is a synonymous mutation, and its encoding amino acids are conserved. The genotyping of G1593A showed that the SNP was associated with body color. Heterozygous GA was the major genotype in the yellow population, and homozygous AA was the major genotype in the other three populations. Traditionally, a synonymous mutation does not cause a change in amino acids and, therefore, does not affect protein structure and function. However, recent studies have shown that synonymous SNPs can affect protein expression and function [40,41,42]. If a synonymous SNP is in linkage disequilibrium with other common functional non-synonymous polymorphisms, the non-synonymous SNP will reflect the effect of the non-synonymous SNP. For example, rs5888, a synonymous SNP in exon 8 of human scarb1, is close to two non-synonymous SNPs [43,44,45]. A synonymous SNP in exon 26 (C3435T) of human P-gp is in linkage disequilibrium with other functional non-synonymous polymorphisms, such as G2677T [46]. Our SNP calling results based on the transcriptomes of cherry shrimp showed that there were other non-synonymous SNPs in the exons of scarb1 of cherry shrimp.
The second possible explanation of synonymous SNP function is that allele-specific differences in mRNA folding could influence splicing, processing, or translational control and regulation. The rs5888 variant has been proven to affect scarb1 RNA’s secondary structure and protein translation and is significantly associated with reduced scarb1 protein expression and function [43]. The predicted results of mRNA showed that G1593A changed the secondary structure of scarb1. The different mRNA folding of the alternative allele could alter mRNA splicing or protein translation, ultimately eliciting changes at the protein level. Subsequent research will analyze the protein level to infer whether it affects the translation process and subsequently affects the coloring process.
A third explanation is that the use of rare codons appears to influence the translation rate, which in turn affects protein folding [47]. G1593A is located in the third base of the codon with the largest effect on protein folding. The different frequencies of genotypes might indicate that there were various protein conformations in the four color populations. In general, tRNA corresponding to high-usage codons has a high abundance [48]. Natural selection may be one of the reasons for forming this correspondence [49,50]. According to Alphafold, S521 was located in the C-terminal transmembrane domain of cherry shrimp scarb1. In human scarb1, the homo-oligomerization is driven by interactions between C-terminal transmembrane domains, in which no non-synonymous polymorphism is found. The translation rate of the C-terminal transmembrane domain might have an influence on its conformation and the function of the whole protein.
The SNPs of human scarb1 are associated with the concentration of β-carotene in plasma, explaining 50% of the concentration variance [51] and suggesting that scarb1 may be one of the major genes influencing plasma β-carotene levels. Our genotyping results also suggested that scarb1 plays a role in body color, especially in the yellow color, of cherry shrimp. An animal’s body color is a quantitative trait controlled by many genes. Certain genes may exert a substantial influence on body coloration, while others may have little influence. The inheritance of human eye color serves as an excellent example [52], where SNPs within eight major genes can be utilized to predict the iris’s color [53]. The genotype of G1593A suggested that scarb1 might be one of the major genes in the yellow phenotype. Interestingly, there is no genotype difference between the blue and wild populations, which may be regulated by another factor, for example, non-coding RNA (ncRNA). Findings have revealed that Apis mellifera could change the body color, perhaps by altering the expression of ncRNA-related key genes [54]. This indicates that G1593A of scarb1 might be one of the major genes responsible for the yellow phenotype, but within the blue population, it may be regulated by more factors.
5. Conclusions
In summary, the scarb1 expression profiles of embryos and populations showed that its expression level had a close relationship with chromatophore occurrence and body color. Although reducing the expression of scarb1 by RNAi affected pigmentation and pigment distribution in erythrophores, its influence on erythrophore phenotype was limited. Conversely, the G1593A genotype of the yellow population significantly deviated from other body colors; this result suggested a substantial influence of scarb1 on xanthophores, which are the major chromatophores of a yellow individual. Unfortunately, we are unable to validate this hypothesis by RNAi during the occurrence of xanthophores, which first appear at the post-larval stage. The dsRNA could not be delivered into post-larvae by soaking, while injections led to a high mortality rate in post-larvae. In the future, gene knockout may be used to study scarb1’s role in the occurrence of xanthophores.
The reference list from the paper itself. Each links out to its DOI / PubMed record.
- 1Flores E.E. Chien Y.-H. Chromatosomes in Three Phenotypes of Neocaridina denticulata Kemp, 1918: Morphological and Chromatic Differences Measured Non-Invasively J. Crustac. Biol.20113159059710.1651/11-3457.1 · doi ↗
- 2Mykles D.L. Hui J.H.L. Neocaridina denticulata: A Decapod Crustacean Model for Functional Genomics Integr. Comp. Biol.20155589189710.1093/icb/icv 05026002561 · doi ↗ · pubmed ↗
- 3Huang C.-W. Chu P.-Y. Wu Y.-F. Chan W.-R. Wang Y.-H. Identification of functional SSR markers in freshwater ornamental shrimps Neocaridina denticulata using transcriptome sequencing Mar. Biotechnol.20202277278510.1007/s 10126-020-09979-y 32529453 · doi ↗ · pubmed ↗
- 4Fujii R. The regulation of motile activity in fish chromatophores Pigment Cell Res.2000133003191104120610.1034/j.1600-0749.2000.130502.x · doi ↗ · pubmed ↗
- 5Wade N.M. Gabaudan J. Glencross B.D. A review of carotenoid utilisation and function in crustacean aquaculture Rev. Aquac.20179141156
- 6Wang L. Liu Z. Jiang H. Mao X. Biotechnology advances in β-carotene production by microorganisms Trends Food Sci. Technol.2021111322332
- 7Jing Y. Guo F. Zhang S. Dong W. Zhou J. Xin F. Zhang W. Jiang M. Recent Advances on Biological Synthesis of Lycopene by Using Industrial Yeast Ind. Eng. Chem. Res.20216034853494
- 8Fraser P.D. Bramley P.M. The biosynthesis and nutritional uses of carotenoids Prog. Lipid Res.2004432282651500339610.1016/j.plipres.2003.10.002 · doi ↗ · pubmed ↗