Vorinostat impairs the cancer-driving potential of leukemia-secreted extracellular vesicles
Crescenzo Massaro, Giulia Sgueglia, Annamaria Muro, Damiana Pieragostino, Paola Lanuti, Maria Concetta Cufaro, Cristina Giorgio, Erika D’Agostino, Laura Della Torre, Serena Rubina Baglio, Marinella Pirozzi, Mariacarla De Simone, Lucia Altucci, Carmela Dell’Aversana

TL;DR
This study shows that Vorinostat changes the content of leukemia cell secretions, reducing their ability to support cancer growth.
Contribution
The study reveals how Vorinostat alters the molecular cargo of leukemia-derived extracellular vesicles, affecting their tumor-supportive functions.
Findings
Vorinostat upregulates miR-194-5p and loads BCLAF1 into EVs, reducing miRNA levels in the same compartment.
Vorinostat modifies EV miRNA and proteomic profiles, altering their tumor-supportive potential in AML and CML.
Modified EVs may enhance sensitivity to antineoplastic agents, suggesting a dual therapeutic role for Vorinostat.
Abstract
Leukemia-secreted extracellular vesicles (EVs) carry biologically active cargo that promotes cancer-supportive mechanisms, including aberrant proliferative signaling, immune escape, and drug resistance. However, how antineoplastic drugs affect EV secretion and cargo sorting remains underexplored. Leukemia-secreted extracellular vesicles (EVs) were isolated by Differential UltraCentrifugation, and their miRNome and proteomic profiling cargo were analyzed following treatment with SAHA (Vorinostat) in Acute Myeloid Leukemia (AML) and Chronic Myeloid Leukemia (CML). The epigenetic modulation of leukemia-secreted EVs content on interesting key target molecules was validated, and their differential functional impact on cellular viability, cell cycle progression, apoptosis, and tumorigenicity was assessed. SAHA significantly alters the cargo of Leukemia-derived EVs, including miR-194-5p and…
Genes, proteins, chemicals, diseases, species, mutations and cell lines named across the full text — each resolved to its canonical identifier and authoritative record.
Click any figure to enlarge with its caption.
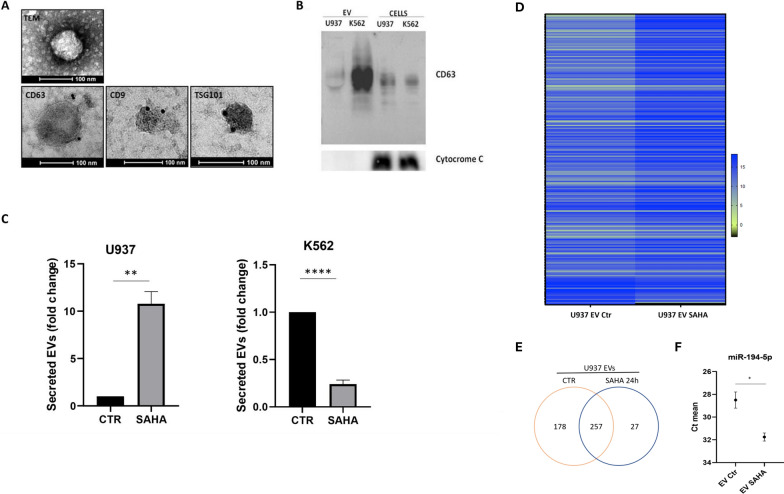 Figure 1
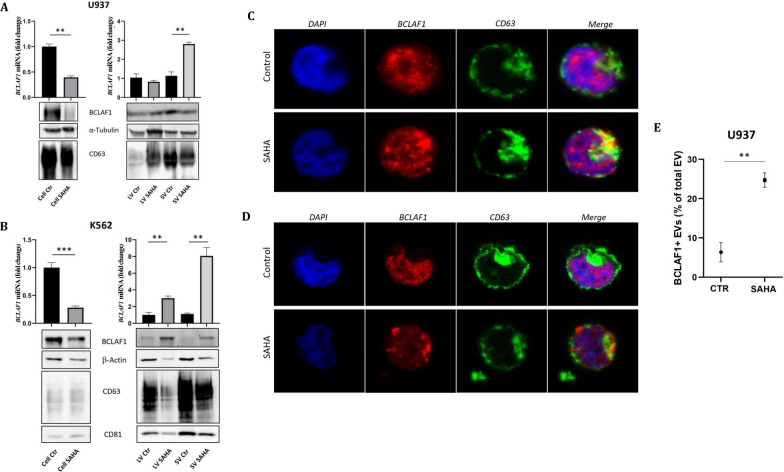 Figure 2
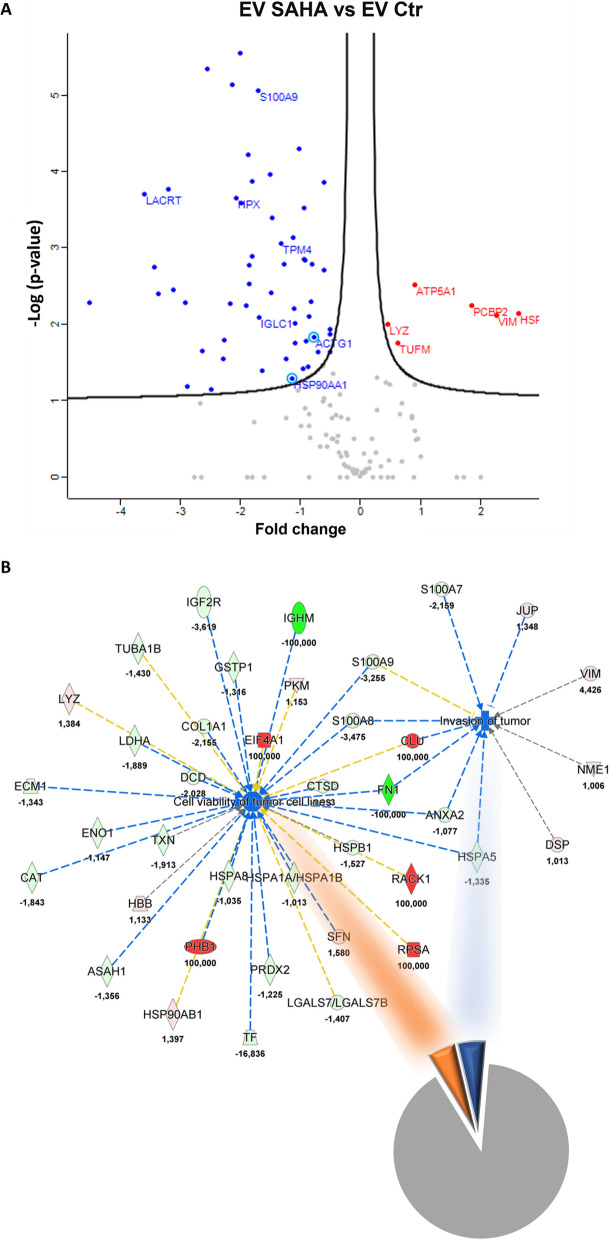 Figure 3
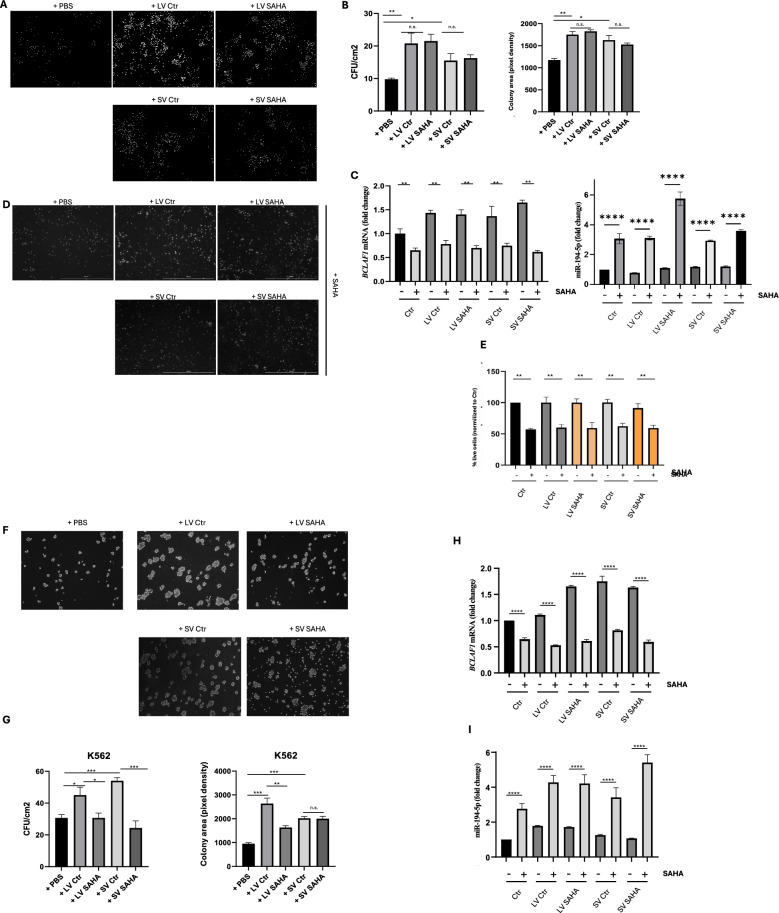 Figure 4
- —http://dx.doi.org/10.13039/501100003407Ministero dell’Istruzione, dell’Università e della Ricerca
- —Ministero delle Imprese e del Made in Italy
- —POR-FESR
- —The National Recovery and Resilience Plan (NRRP)
Peer Reviews
No public reviews on file for this paper yet. If you reviewed it on a platform where reviews are public (OpenReview, ICLR, NeurIPS, ICML), you can paste yours below so the community can read it here.
Videos
No videos yet. Explain this paper in a talk, walkthrough, or lecture? Add one.
Taxonomy
TopicsExtracellular vesicles in disease · MicroRNA in disease regulation · Immune cells in cancer
Introduction
Leukemia is characterized by extensive biological heterogeneity that often leads to relapse/refractory disease, making treatment extremely challenging [1]. In addition, the communication between cancer cells and surrounding stromal components plays a key role in different stages of the disease, further complicating the scenario [2]. Part of these interactions are mediated by extracellular vesicles (EVs), a heterogeneous population of vesicles secreted by all nucleated cells in the extracellular environment, previously regarded as a means to discard waste material [3, 4]. EV heterogeneity is the result of the different mechanisms and cellular compartments involved in vesicle biogenesis. According to current literature, EVs comprise: (i) exosomes (30–200 nm in diameter) originating in the endosomal compartment, where various mechanisms and pathways are involved, thus contributing to vesicle diversity [3, 4]; (ii) microvesicles (100–1000 nm in diameter) generated via direct outward budding of the plasma membrane [4]; (iii) apoptotic bodies (1000–5000 nm in diameter) deriving from apoptotic stimuli, which play a crucial role in maintaining tissue homeostasis and immune response yet their involvement in intercellular communication is generally considered less pronounced compared to exosome and microvesicles [3]. Therefore, we excluded such EV subtype from our study. Despite these classifications, the overlapping size range and the lack of reliable methods to distinguish between EV subtypes represent significant challenges [5, 6]. To address this, we adopted a size-based distinction between small vesicles (SVs) and large vesicles (LVs), acknowledging that vesicles of similar size (e.g. 150 nm) may include both exosomes and microvesicles. EVs contain various cargo molecules in both their lumen and membrane, including proteins, RNAs, miRNA, DNA, lipids, and metabolites, all of which can influence recipient cell phenotypes [7, 8]. As a result, accumulating evidence have highlighted the role of cancer-derived EVs in promoting tumor-supportive functions, including proliferation [9], angiogenesis [10], immune escape [11], and virtually every aspect of cancer biology [12]. Moreover, these vesicles are implicated in the development of refractory phenotypes in recipient cancer cells [13–17], further complicating treatment outcomes. Beyond investigating the mechanisms underlying this type of intercellular communication, growing efforts are focused on harnessing EVs for therapeutic applications. However, comparatively less attention has been paid to how therapeutics alter EV secretion and molecular composition, changes that can variably influence the phenotype and functionality of recipient cells.
In previous studies, we demonstrated that the imbalance between miR-194-5p and its target Bcl-2-associated transcription factor 1 (BCLAF1) drives the differentiation block and apoptosis resistance observed in Acute Myeloid Leukemia (AML) cell lines—hallmarks of cancer progression [18]. Treatment with SAHA (Vorinostat)—an FDA-approved HDAC inhibitor(NDC code: 0006–0568-40, CAS number: 149647-78-9, ATC code: L01XH01)—restored this imbalance, leading cancer cells toward apoptosis. Notably, SAHA not only downregulated BCLAF1 expression, at mRNA and protein level, but also affected its intracellular localization and function.
Here, we investigated whether SAHA modulates the cargo sorting of leukemia-derived EVs and examined the biological impact of these altered vesicles on surrounding tumor cells. We assessed SAHA-mediated effects in both acute myeloid leukemia (AML) and chronic myeloid leukemia (CML) [22]. Our study focused specifically on myeloid leukemias, given their poorer prognosis, lower survival rates, high relapse rates, and resistance to treatment compared to lymphoid leukemias [19, 20].
Additionally, previous studies have highlighted the significant role of soluble factors and EV secretion in the malignant progression of myeloid leukemia, particularly in the reprogramming of the immunosuppressive microenvironment [21]. In this context, EVs may represent a promising therapeutic target to disrupt tumor-supportive communication between leukemia cells and their microenvironment [19, 21].
Our aim was to elucidate the modulatory effects of SAHA on EV secretion and cargo composition in both AML and CML, overcoming the distinct genetic, epigenetic, and molecular backgrounds of these two myeloid leukemia models. Specifically, we sought to identify key leukemic processes and targets influenced by SAHA-induced EVs, proposing them as potential therapeutic candidates.
Our findings reveal that SAHA significantly alters EV secretion and content, thereby skewing their tumor-supportive potential in both AML and CML. Moreover, based on molecular observations and in silico predictions, such changes may enhance the sensitivity of residual Leukemia cells to specific therapeutic agents.
Materials and methods
Cell line culture and chemical compounds
Human cell lines used were U937 (AML; RRID: CVCL_0007)) and K562 (CML; RRID: CVCL_0004). Leukemia cell lines were grown in RPMI 1640 medium (EuroClone, Milan, Italy) supplemented with 10% heat-inactivated FBS (Sigma-Aldrich, St Louis, Missouri, USA) and 2% penicillin/streptomycin (EuroClone). EV-depleted FBS was used to culture cells for EV collection. Briefly, heat-inactivated FBS was ultracentrifuged at 100,000 × g for 12 h at 4 °C, without brake. The supernatant was added to 2% penicillin/streptomycin RPMI at a final concentration of 5%. SAHA (Vorinostat; Merck, Kenilworth, NJ, USA) was dissolved in DMSO (Sigma-Aldrich) and used at a final concentration of 5 μM. All human cell lines have been authenticated using STR profiling within the last 3 years. U937 and K562 cell lines were obtained from ATCC, Manassas, VA, USA. All experiments were performed with mycoplasma-free cells.
Small and large vesicle isolation
Differential ultracentrifugation was performed using an Optima XPN-90 ultracentrifuge (Beckman Coulter, Brea, CA, USA) to isolate small and large vesicle subpopulations (SV and LV). A total of 4 × 10⁵ leukemic cells/ml were plated in 30 ml RPMI containing EV-depleted FBS and treated with SAHA for 24 h before EV isolation. DMSO was added to the control (Ctr) groups. SVs were isolated as described previously [18]. The SV pellet was then carefully resuspended in 200 μl PBS for functional assays or 150 μl PBS for molecular analysis, and stored at − 80 °C. The same protocol was used to isolate EVs for vesicle characterization and miRNA profiling.
LV isolation was performed using the same steps as for SV isolation, but ending the protocol earlier, as LVs were pelleted at 10,000 × g. After centrifugation at 10,000 × g, the pellet was washed with PBS, collected, and referred to as LVs. LV preparations were resuspended in 200 μl PBS for functional assays or 150 μl PBS for molecular analysis, and stored at − 80 °C.
EV sorting, staining, and acquisition
EVs were sorted and acquired as previously described [19]. Protocol details and variations are reported below. Reagent mix was prepared by adding 0.5 μl of fluorescein isothiocyanate (1)-conjugated phalloidin and lipophilic cationic dye (both from BD Biosciences, San Jose, CA, USA; #626267 custom) to 195 μl of PBS 1X. Rosetta Calibration (Exometry, Amsterdam, The Netherlands) was used according to the manufacturer’s instructions, to calibrate side scatter, relate side scatter in arbitrary units to standardized units of nm, as well as to the diameter and refractive index of particle. Samples were acquired by flow cytometry (FACSVerse, BD Biosciences). EVs were identified as LCD positive/phalloidin negative events. EV preparations of LCD positive/phalloidin negative events displayed distributions in the range of ~ 100–300 nm in diameter. Instrument performances were monitored by the Cytometer Setup and Tracking Module (BD Biosciences) and further validated by the acquisition of Rainbow Beads (BD Biosciences). The same settings were used for all other measurements. To stain EVs, 300 ml of CytoFix/CytoPerm 1X (BD Biosciences) was added to 200 ml of supernatants. After 10 min, 2 ml of anti-BCLAF1 was added. After 30 min of staining at room temperature (RT) in the dark, 200 μl of PBS 1X was added to each tube. Next, 1 ml of an anti-rabbit FITC-conjugated (Jackson ImmunoResearch, West Grove, PA, USA) was added to each tube and incubated for 30 min (RT, in the dark). Samples were acquired on a FACSVerse flow cytometer (BD Biosciences), as previously described [20, 21].
Immunofluorescent staining and acquisition
Cells were plated at a confluence of 200,000 cell/ml in 2.5 ml medium using a 6-well plate. After 24 h incubation with SAHA (or DMSO as Ctr), 30,000 live cells were added to a 12-well plate containing round cover glasses (Thermo Fisher Scientific, Waltham, MA, USA; #10006111) pretreated with poly-L-lysine (0.1 mg/ml; Merck, #P4707) and centrifuged at 350 × g for 5 min. Cells were fixed with PBS 4% formaldehyde (Thermo Fisher Scientific, #PI28906) and incubated for 20 min at RT. Cell permeabilization was performed with PBS 0.1% Triton X-100 (Sigma-Aldrich, #9036-19-5) and incubated for 10 min at RT. Cells were blocked with PBS 10% serum (FBS) for 30 min at RT. Cells were incubated with the following primary antibodies diluted in PBS 1% BSA/PBS: 1:100 CD63 (BD Biosciences, #556019), 1:100 BCLAF1 (Thermo Fisher Scientific; #PA5-55686) and incubated for 1 h at RT. Cells were then incubated for 30 min with the following secondary antibodies: Goat anti-Mouse IgG conjugated with AlexaFluor 488 (Thermo Fisher Scientific; #A11029) 1:1000 and Goat anti-Rabbit IgG conjugated with AlexaFluor 594 (Thermo Fisher Scientific; #A11012) 1:1000, and incubated for 30 min. Lastly,round cover glasses were mounted on a microscope slide using one drop of mounting medium containing DAPI (Thermo Fisher Scientific, #P36935) for nuclei staining. Images were acquired using an SP8 LIGHNTING confocal microscope (Leica Microsystems, Wetzlar, Germany) using an S Plan Fluor ELWD 40X/0.60 objective (Nikon, Tokyo, Japan). Images were acquired with NIS-Elements software (Nikon).
miRNA profiling
cDNA synthesis and real-time qPCR were performed using a miRCURY LNA Universal RT microRNA PCR system (Qiagen, Germany) according to the manufacturer’s instructions, as previously described [22]. Real-time PCRs were run on a 7900HT thermocycler (Applied Biosystems, Thermo Fisher Scientific) using thermal-cycling parameters recommended by Qiagen. Briefly, we adhered to the manufacturer’s protocol, where Raw Ct values were calculated using the RQ Manager software v.1.2.1 (Applied Biosystems), with manual adjustments for the threshold and baseline settings. Data were analyzed by applying a ΔRn threshold of 60 and subtracting the baseline between cycles 1–10. miRNA profiles were then determined using the delta-delta Ct method and EV-miRNA data were normalized on RNU6 levels.
Target prediction analysis and GO enrichment
The prediction of target genes was performed using the miRSystem database as reported in [22], accomplished here by a value HIT ≥ 5, included validated genes, and observed/expected (O/E) ratio ≥ 2. For Gene Ontology (GO) enrichment and Kyoto Encyclopedia of Genes and Genomes (KEGG) pathway analysis was used the Database for Annotation, Visualization and Integrated Discovery (DAVID) (http://david.abcc.ncifcrf.gov/home.jsp). The Bonferroni Correction and the Benjamini–Hochberg Procedure were used in order to calculate the False Discovery Rate (FDR, p < 0.05) and the statistical significance at a p-value of < 0.05 was set.
RNA isolation
Cells were collected by centrifugation at 350 × g for 5 min and lysed in 1 ml TRIzol (Invitrogen, Waltham, MS, USA). Similarly, 50 μl (out of 150 μl) of vesicle preparations were lysed in 1 ml TRIzol. RNA was extracted as previously described 9, with the addition of 3 μl glycogen (Roche) to the aqueous phase from vesicle preparations (but not to the cell lysate) before adding 500 μl of cold isopropylic alcohol, followed by vigorous shaking. RNA was resuspended in 10 μl DEPC-treated H_2_O (for vesicles) and 20 μl DEPC-treated H_2_O (for cells).
Reverse transcription and real-time qPCR
mRNA was reverse transcribed using the SuperScript VILOTM cDNA Synthesis Kit (Invitrogen), according to the manufacturer’s instructions. A total of 1 μg RNA was reverse transcribed using a Peltier Thermal Cycler (MJ Research, Deltona, FL, USA). Gene expression was evaluated by real-time qPCR. A total of 50 ng of cDNA was amplified using the Power SYBR Green PCR Master Mix (Applied Biosystems, Waltham, MA, USA), according to the manufacturer’s instructions. Gene expression was normalized to GAPDH levels. Real-time qPCR was performed using a CFX96 detection system (Bio-Rad). The analysis was conducted using the ΔΔCt method. Primers used: BCLAF1 forward TCCGATCCATCTTTGACCACA, reverse BCLAF1 TGATACGAAGTGAACCGCTCG; GAPDH forward GGAGTCAACGGATTTGGTCGT, GAPDH reverse GCTTCCCGTTCTCAGCCTTGA.
miRNA real-time PCR
After RNA extraction, the miRNA fraction was converted into cDNA and subsequentially miRNA Real-Time PCR was performed as described in [23].
Western blotting
Cells and vesicles were lysed with RIPA buffer containing protease inhibitor cocktail (Roche, Switzerland), and the protein concentration was determined by BCA assay (Pierce, Etten-Leur, The Netherlands). Cell and vesicle lysates were diluted in different types of loading buffer according to the protein of interest. Blotting for vesicle-associated markers (CD63, CD81) required loading buffer without reducing agents, while blotting for other proteins was performed using loading buffer containing reducing buffer (beta-mercaptoethanol, Sigma- Aldrich, St. Louis, MO, USA), in both cases boiled at 95 °C for 5 min. Cell lysates and EV preparations in sample buffer were run on a 10% SDS gel and blotted on a nitrocellulose membrane (GE Healthcare, Eindhoven, The Netherlands). Membranes were incubated with antibodies against CD63 (BD Biosciences, San Jose, CA, USA; #556019) 1:300, BCLAF1 (Thermo Fisher Scientific, Waltham, MA, USA; #PA5-55686) 1:1000, and horseradish peroxidase-conjugated goat anti-mouse (Bio-Rad, Hercules, CA, USA; #1706516) 1:3 000 and goat anti-rabbit (Bio-Rad, #1706515) 1:3 000 antibodies.
Transmission electron microscopy
EV pellets were fixed with 2.5% glutaraldehyde and all analysis were performed as described in [24].
EV immunogold-labeling
Isolated EVs were loaded onto carbon-coated grids, fixed in 2% paraformaldehyde, washed, and then immune-labeled with anti-CD63 antibody (Abcam, United Kingdom; #ab59479), anti-CD9 antibody (Abcam, #ab92726), and anti-Tsg-101 (Abcam, #ab125011), followed by a 10 nm gold-labeled secondary antibody (Sigma-Aldrich). EVs were post-fixed in 2.5% glutaraldehyde, washed three times, contrasted with 2% uranyl acetate, and then examined with a JEOL 100CX transmission electron microscope (JEOL, Peabody, MA, USA).
Cell viability assay
Cell viability was evaluated using a CCK8 kit (Sigma-Aldrich, #96992) following the manufacturer’s instructions. A total of 100 ul containing 10 000 cells/well were plated in a 96-well plate followed by the addition of 10 ul/well of WST-8 solution (1:10) and incubated overnight. The absorbance was then measured at 460 nm using an Infinite M200 plate reader (Tecan, Switzerland). Data were analyzed and presented as a percentage of live cells normalized to the relative control.
Propidium iodide staining and cell cycle assessment
A total of 400,000/ml cells were transferred to polypropylene tubes, centrifuged at 350 × g, and the pellet was resuspended in 500 μl PBS. Propidium iodide (Sigma-Aldrich) was then added at a final concentration of 1 μg/ml, and cells were immediately analyzed by FACS Celesta Flow Cytometer (BD, Franklin Lakes, NJ, USA). For cell cycle assessment, cell cycle buffer was prepared by dissolving sodium citrate (10%; Sigma-Aldrich), NP-40 (10%; Sigma-Aldrich), and propidium iodide (2 mg/ml, Thermo Fisher Scientific) in PBS. Cells were resuspended in 500 μl cell cycle buffer, incubated for 15 min at room temperature, and then analyzed by FACS Celesta Flow Cytometer.
Tumorigenicity assay
The tumorigenic capability of leukemic cells upon EVs w/wo SAHA treatment was evaluated by colony-forming unit assay using MethoCult (Stem cells, #SF H4236). A total of 500,000 leukemic cells/well were plated in a 6-well plate in 2.5 ml medium, to which 50 μl EV preparation were added, and incubated for 24 h. Subsequently, SAHA was added to the appropriate wells and incubated for 24 h. Following completion of the treatments, 10,000 cells were resuspended in 100 μl medium and added to 900 μl MethoCult medium. The mixture was then carefully pipetted to a new 6-well plate and incubated for five days. Images were acquired using a Cytation Cell Imaging Reader (Biotek, Winooski, VT, USA) at 4× magnification.
Label-free proteomics analysis
To evaluate the protein cargo of sorted EVs from U937 medium, 700,000 purified EVs were used for proteomics analysis by comparing EVs of the two cell lines treated with SAHA to related controls. Samples were prepared for the Filter Aided Sample Preparation(FASP) protocol. EVs were lysed by sonication on ice (U200S sonicator control, IKA, Staufen, Germany) at 70% amplitude in a lysis buffer (urea 6 M in 100 mM Tris/HCl, pH = 7.5) for overnight tryptic digestion at 37 °C. As previously reported, the number of separated EVs was used as a normalization parameter for protein label-free identification and quantification [25]. Tryptic peptides were analyzed in triplicate by LC–MS/MS using the UltiMate3000 UPLC chromatographic system (Thermo Fisher Scientific, Milan, Italy) coupled to the Orbitrap Fusion Tribrid mass spectrometer (Thermo Fisher Scientific). Details of LC–MS/MS parameters are reported in our previous works [25, 26]. Briefly, the flow rate was set at 300 nL/min, with a total run time of 65 min using a chromatographic gradient from 2 to 90% of acetonitrile/water. Peptides were acquired in positive-ion polarity with data-dependent acquisition mode and MS2 sequence, using N2 as collision gas for HCD fragmentation.
Proteomics LC–MS/MS raw data were then processed using the free computational platforms MaxQuant version 1.6.10.50 and Perseus version 1.6.10.50 (Max-Planck Institute for Biochemistry, Martinsried, Germany).
and the UniProt database (released 2020_06, taxonomy Homo Sapiens, 20 588 entries), as previously described in full [27]. Proteins with a − 0.05 < p-value > 0.05 and FC > 1 were considered differentially loaded into EVs. Lastly, protein ratios (EV SAHA/EV Ctr) were used for Gene Ontology and functional enrichment analysis using the Ingenuity Pathway Analysis (IPA) tool (Qiagen, Hilden, Germany). Briefly, IPA can predict the activation (z-scores ≥ 2.0) or inhibition (z-scores ≤ − 2.0) of transcriptional regulators or downstream for the loaded dataset based on prior knowledge of expected effects from published literature citations stored in the IPA system. The proteomics data have been deposited to the ProteomeXchange Consortium via the PRIDE [28] partner repository with the dataset identifier PXD042168.
Statistical analysis
All experiments were repeated three times (biological replicates). Statistical analysis was performed using GraphPad Prism 7 software; data were expressed as means of values and error bars represent standard deviation of the means. A two-tailed unpaired t-test was applied to assess the effects of independent variables on quantitative results. Significance was defined as a p-value < 0.05, indicated by asterisks in the figures (ns = not significant, * = p < 0.05, ** = p < 0.01, *** = p < 0.001, **** = p < 0.0001).
Results
SAHA modulates secretion and miRNA content in leukemia-derived EVs
We previously conducted a comprehensive analysis of SAHA’s effect on cell viability and apoptosis across various leukemia cell lines [11]. Briefly, we demonstrated that SAHA increased the proportion of cells in the pre-G1 phase, while enhancing Caspase-8 and −9 activity after 24 h of treatment, resulting in approximately 50% cell death in U937 cells and 40% in K562 cells (Fig. S1A). Building on these observations, we then shifted our focus to investigating the impact of SAHA on the EV secretion and composition. We isolated and characterized EVs using electron microscopy (Fig. 1A) and Western blotting (Fig. 1B). Flow cytometry analysis, optimized for stained EVs within the 100–300 nm size range, revealed that SAHA treatment increase4d EV secretion from U937 (Fig. 1C). Although SAHA exerted a cytotoxic effect on Leukemia cells [18], the enhanced EV secretion could not be attributed to an increase in apoptotic bodies, given the applied sorting threshold. Conversely, SAHA reduced EV secretion in K562 cells (Fig. 1C). Though changes in EV yield may significantly influence the tumor microenvironment, SAHA-induced intracellular molecular rearrangements [18] may be reflected in the extracellular compartment further contributing to phenotypic alterations in recipient cell, highlighting the need for molecular evaluations to investigate the malignant potential of Leukemia-derived EVs following treatment.Fig. 1. Characterization of leukemia-derived EVs and SAHA affects leukemia EV-associated miRNA profile. A Top, transmission electron microscopy micrographs of EVs isolated from U937 cells. Scale bar, 100 nm; Bottom, CD63, CD9, and Tsg101 analysis by immunoelectron microscopy in EVs isolated from U937 cells; B Western blot for CD63 and cytochrome C in U937 and K562 cells and corresponding EVs; C Left, SAHA-induced effect on EV secretion in U937 cells assessed by FACS; Right, SAHA induced effect on EV secretion in K562 cells assessed by FACS. Data were normalized to viable cell count and conditioned medium volume and expressed as fold change relative to the experimental control. Error bars indicate standard deviation; D Heat map of differentially expressed miRNAs in EVs derived from untreated vs SAHA-treated cells (Supplementary Table 1 shows the miRNA list); E Venn diagram of miRNAs carried by EVs derived from untreated vs SAHA-treated cells; F miR-194-5p sorting in U937 EVs modulated by SAHA expressed as SAHA mean. Error bars indicate standard deviation
Accordingly, we assessed the miRNA profile of AML cells and their corresponding EVs to determine how SAHA affects miRNA loading. Treatment-induced changes in miRNA composition were observed both intracellularly and within EVs (Fig. S1 B-C). Notably, SAHA significantly altered the miRNA profile of U937 EVs (Fig. 1D, E, Table S1). Among 257 miRNAs shared between cells and vesicles, several tumor suppressors—such as miR424-5p, miR455-3p, miR-16-5p, miR-19a-3p, miR-19b-1-5p, miR-15a-5p [29–36]—were lowered in EVs following treatment (Table S1). In contrast, SAHA enhanced the loading of miRNAs associated with drug sensitivity, including miR424-5p, miR-451a, miR-153-3p, miR-17-5p, miR-21-5p, miR-27a-3p [30, 37–39]. Intriguingly, these miRNAs exhibit diverse effects on drug responsiveness, suggesting that SAHA-altered EVs may support pro-tumorigenic functions while potentially enhancing the efficacy of specific therapies. Gene Ontology (GO) analysis for the predictive targets of miRNAs differentially expressed in SAHA-modulated EV in AML, distinguishing between up- and down-regulated, reveals some peculiar biological processes and key pathways such as miRNA involvement in cancer, regulation of the G1/S transition in the mitotic cell cycle, the positive induction of apoptosis and differentiation, and the regulation of transcription by RNA pol II. These findings underscore the critical role of miRNAs in U937-derived EVs and their modulation by SAHA, prompting us to speculate on the potential impact of these changes on recipient cells. Furthermore, miR-194-5p was upregulated intracellularly upon SAHA treatment, yet its EV-associated levels were reduced (Fig. 1F; Table S1).
To explore SAHA’s impact on BCLAF1 (mRNA and protein) sorting into EVs, we analyzed specific EV subpopulations, by specifically analyzing different vesicle subpopulations (small vesicles, SVs, and large vesicles, LVs). EVs from untreated cells were designed as EV Ctr (LV Ctr and SV Ctr), while those from SAHA-treated leukemic cells were referred to as EV SAHA (LV SAHA and SV SAHA). Such deeper investigation highlighted that the reduced miR-194-5p loading was observed in both SV and LV (Supplementary Fig. 1 C-D). These findings highlight that EV content modifications induced by treatment may not directly mirror intracellular expression changes, warranting further investigation into other EV-associated molecules.
SAHA enhances BCLAF1 secretion via EVs in leukemia cells
In U937, SAHA downregulated BCLAF1mRNA in cells (Fig. 2A, left) yet it increased its loading into SVs. However, BCLAF1 protein levels in EVs were not significantly altered, aligning with trends observed for EV-associated markers (CD63 for small vesicles—being it a recognized endosomal marker—and α-tubulin, indicative of larger ones)(Fig. 2A, right). Particularly, LV SAHA showed increased α-tubulin levels, suggesting enhanced LV secretion (Fig. 1C, left) and resulting in greater BCLAF1 circulation.Fig. 2BCLAF1 quantification in leukemic cells and related EVs. A BCLAF1 and EV marker expression in U937 cells and cognate vesicles after 24 h SAHA treatment. Top left, BCLAF1mRNA quantification in U937 cells normalized to GAPDH expression; Bottom left, BCLAF1 protein quantification normalized to tubulin expression and CD63 expression in U937 cells with or without SAHA; Top right, BCLAF1mRNA quantification in U937-derived EVs normalized to Y-RNA; Bottom right, BCLAF1 and EV-associated marker quantification in U937-derived EVs; B BCLAF1 expression in K562 cells after 24 h SAHA treatment. Top left, mRNA quantification in K562 cells normalized to GAPDH mRNA expression; Bottom left, protein quantification normalized to β-actin and CD63 expression in K562 cells treated with or without SAHA; Top right, bclaf1mRNA quantification in K562-derived EVs normalized to Y-RNA; Bottom right, BCLAF1 and EV-associated marker quantification in K562-derived EVs. Error bars indicate standard deviation; C Immunofluorescence-based co-staining of BCLAF1 and CD63 (with DAPI for nucleus staining) in U937 cells untreated or treated with SAHA; D BCLAF1 and CD63 co-staining in K562 cells untreated or treated with SAHA; 40X magnification; E FACS-based quantification of BCLAF1-positive vesicles in EVs derived from SAHA treated vs untreated U937 cells. Data were normalized to viable cells and conditioned medium volume. Results are expressed as percentage of BCLAF1 + EVs to the total number of events. Error bars indicate standard deviation
On the other hand, in K562, SAHA induced BCLAF1 loading (both mRNA and protein) in all EV subpopulations, despite reduced EV marker detection (Fig. 2B, right), thus further proving that the treatment differently affected intra- and extra-cellular compartment content.
Furthermore, imaging approach revealed increased BCLAF1/CD63 overlap in both U937 (Fig. 2C) and K562 cells (Fig. 2D), therefore confirming the enhanced association of BCLAF1 with the extracellular compartment following SAHA treatment (observation confirmed in U937 also at cytometry level in Fig. 2E). Based on these results, we speculated that BCLAF1 might be either regarded as waste for disposal or exert functional activity within the tumor microenvironment, potentially contributing to treatment resistance.
SAHA induces prominent changes in leukemia EV proteomics
Besides BCLAF1, we also explored the entire proteomic landscape. Proteomics analysis of U937-derived EVs detected 140 proteins in EV Ctr and 150 in EV SAHA, with 130 proteins (81.3%) shared between the two groups (Table 1). EV SAHA exhibited lower levels of actin (ACTG1) and heat shock protein 90 (HSP90) (Fig. 3), both implicated in drug resistance [40–42]. Conversely, proteins such as Cullin-3 (Cul3), associated with drug sensitivity [43], and Interleukin Enhancer Binding Factor 2 (ILF2), linked to resistance to genotoxic drugs [44], were uniquely identified in EV SAHA. Moreover, Ingenuity Pathway Analysis highlighted differential biological functions induced by the EV groups, predicting that EV SAHA could inhibit tumor invasion and viability (Table 2, Fig. 3).Table 1. Proteomics in U937 EVs w/wo SAHAT: Majority protein IDsT: Protein namesT: Gene namesMean CTRLMean SAHAratioN: Razor + unique peptidesN: Unique peptidesN: Sequence coverage [%]N: Unique + razor sequence coverage [%]N: Unique sequence coverage [%]N: ScoreN: IntensityN: MS/MS countN: Deamidation (NQ) site IDsN: Oxidation (M) site IDsN: Deamidation (NQ) site positionsN: Oxidation (M) site positionsP0DOY3Ig lambda-1 chain C regionsIGLC13024333958543,30,3169442228,328,328,38,155383641000120000O43505Beta-1,4-glucuronyltransferase 1B4GAT1359740000226,76,76,72,02822,05E+0820000P12814Alpha-actinin-1ACTN117439,518951,51,0867111,31,31,32,0368378470010000O75223Gamma-glutamylcyclotransferaseGGCT954640830313,30,8697663322,322,322,35,683757203000120000O75629Protein CREG1CREG1640396,73561300,556108119,59,59,54,96792370100070000O95498Vascular non-inflammatory molecule 2VNN21843167665846,70,361251112,72,72,72,28311,51E+0870000P00338L-lactate dehydrogenase A chainLDHA11800146246500,5293585415,415,411,77,043997451000140000P00558Phosphoglycerate kinase 1PGK1150228,7225636,71,5019554416,116,116,17,488930445000140000P00738HaptoglobinHP865240781860,090363227,47,47,415,8376054500060000P01009Alpha-1-antitrypsinSERPINA1371513,341407,330,111456226,76,76,73,00332725300060000P01023Alpha-2-macroglobulinA2M6591700337,23,33,35,1451012900040000P01833Polymeric immunoglobulin receptorPIGR41321,523055,330,55795337,17,17,16,9351622410030000P01834Ig kappa chain C regionIGKC2076633373465330,3537714464,564,564,521,0664,22E+08200000P01857Ig gamma-1 chain C regionIGHG1948126711322130,1194168329,729,714,538,0544,78E+08380000P01859Ig gamma-2 chain C regionIGHG2871910116103,70,1331622165,85,85,42053853200050000P01860Ig gamma-3 chain C regionIGHG3561986,71785550,3177212120,77,43,22,80153473200050000P01871Ig mu chain C regionIGHM193566,700113,53,53,52,15181544800040000P01876Ig alpha-1 chain C regionIGHA126268006269700,2386825522,922,922,97,31611,56E+08140000P02042Hemoglobin subunit deltaHBD0379640#DIV/0!2249,721,821,83,6179155110003092056P02452Collagen alpha-1(I) chainCOL1A11326600615536,70,463996131311,311,311,363,3054,31E+08530000P02545Prelamin-A/CLMNA88461,33700440,791804448,38,38,38,317719496000120000P02647Apolipoprotein A-IAPOA1909843,397142,50,1067686628,528,528,59,412152628000120000P02656Apolipoprotein C-IIIAPOC31154500001116,216,216,22,82382062400050000P02671Fibrinogen alpha chainFGA5159800335,85,85,85,494603700060000P02679Fibrinogen gamma chainFGG21556500227,77,77,72,65111295700040000P02751FibronectinFN114648000774,74,74,713,85748538000130000P02753Retinol-binding protein 4RBP42802200288456,70,1029393322,422,422,46,11592719000100000P02787SerotransferrinTF75836045043,670,0593968817,215,515,511,98898819000160000P02788LactotransferrinLTF1235633337136,70,272845101021,518,618,619,3232,22E+08270000P02790HemopexinHPX681426,7162616,70,238641228885,11835823900090000P04040CatalaseCAT8495204608900,542538820,720,720,716,4131,14E+08200000P04075Fructose-bisphosphate aldolase AALDOA258683,32470900,9551834419,519,519,56,80453489800090000P04083Annexin A1ANXA12322151627300,700773229,59,59,53,86731905200070000P04259Keratin, type II cytoskeletal 6BKRT6B199320339326,71,7024222254,45,55,54,87184249900060000P04406Glyceraldehyde-3-phosphate dehydrogenaseGAPDH780183344413670,569272121247,247,247,255,3046,24E+08460980105P04439HLA class I histocompatibility antigen, A-3 alpha chainHLA-A0214133,3#DIV/0!2210,410,410,48,55461666100060000P04792Heat shock protein beta-1HSPB1730773,34785600,6548683328,328,328,36,372750792000100000P05089Arginase-1ARG11303387939136,70,7205367732323210,1941,14E+08150990212P05090Apolipoprotein DAPOD731366737486000,5125477736363616,9652,99E+08291030580P05109Protein S100-A8S100A82946833384812330,2878085533,333,333,3158,969,11E+08300000P05141ADP/ATP translocase 2SLC25A5352896,7145526,30,412377227,47,47,43,2552841000070000P06576ATP synthase subunit beta, mitochondrialATP5B678429,79429831,389956615,715,715,720,7321,41E+08170000P06702Protein S100-A9S100A940364333124016670,3072434435,135,135,117,9191,27E+09270000P06733Alpha-enolaseENO1282986724661330,871466131340,840,840,8102,783,5E+08500000P67936Tropomyosin alpha-4 chainTPM415910064219,670,403643116661,8751004900030000P07195L-lactate dehydrogenase B chainLDHB775513,76360800,8202054418,615156,45571991000140000P07339Cathepsin DCTSD11840809921800,8379337723,823,823,811,7851,24E+08150000P07355Annexin A2ANXA2401510037286670,9286611717565656149,795,34E+08690000P07437Tubulin beta chainTUBB232760025065001,0768614436,736,713,532,3112,9E+08380000P07900Heat shock protein HSP 90-alphaHSP90AA174588333840,447579114222,2077712610010000P08123Collagen alpha-2(I) chainCOL1A229384931305,670,106537443,73,73,76,00196730700090000P081954F2 cell-surface antigen heavy chainSLC3A2960820984966,71,0251319923232331,2381,69E+08210000P08238Heat shock protein HSP 90-betaHSP90AB11917372679401,397435437,77,75,87,613445508000110000P08603Complement factor HCFH5155100111,51,51,51,7397714390020000P08670VimentinVIM127883,3565976,74,4257277721,5202025,887707740002101090183P0886540S ribosomal protein SARPSA0570986,7#DIV/0!3313,913,913,93,3112446900040000P09211Glutathione S-transferase PGSTP1970100737076,70,759795443131317,289556337000110000P0C0L5Complement C4-BC4B23457036175,670,154221113,21,31,32,41876579200020000P62987Ubiquitin-60S ribosomal protein L40UBA52136147014965401,0992093326,626,626,612,0525144400060000P0DMV9Heat shock 70 kDa protein 1BHSPA1B53216,33525360,987216226,74,74,73,11711015200030000P0DP252122050382903,30,180442222,122,122,13,20654853500060000P10599ThioredoxinTXN327663317125670,522663319191970,3831,05E+0890000P1080960 kDa heat shock protein, mitochondrialHSPD1133788,37608105,686669121231,431,431,421,873858820001901100145P10909ClusterinCLU075574,33#DIV/0!339,19,19,13,8193579570050000P1102178 kDa glucose-regulated proteinHSPA52307701728700,749101449,39,39,35,84562940400080000P11142Heat shock cognate 71 kDa proteinHSPA8673410650916,70,9665987615151312,6331,31E+08250000P11717Cation-independent mannose-6-phosphate receptorIGF2R14463,333996,4670,276317221,11,11,11,799703330010000P12109Collagen alpha-1(VI) chainCOL6A1398336,7910400,22855334,34,34,36,508879278000150000P12273Prolactin-inducible proteinPIP39583000257910000,6515689963636324,0921,77E+09840000P12724Eosinophil cationic proteinRNASE31876367771363,30,4110943320202024,17463545000110000P14618Pyruvate kinase PKMPKM656820757583,31,153411101028,128,128,118,8131,4E+08250000P14923Junction plakoglobinJUP193390026073331,348226202036,436,436,445,3126,27E+086901110193P15531Nucleoside diphosphate kinase ANME1286900288746,71,0064372219,119,119,12,40481296000020000P15924DesmoplakinDSP816183,3826963,31,013208494921,921,921,9186,478,04E+081300000P18206VinculinVCL9340310588,730,113366222,52,52,53,53752339800040000P35321Cornifin-ASPRR1A897543,36098900,679512233,733,733,72,88723165600070000P22531Small proline-rich protein 2ESPRR2E626196738953000,6220575579,279,279,239,5831,83E+08290000P22626Heterogeneous nuclear ribonucleoproteins A2/B1HNRNPA2B10255576,7#DIV/0!229,99,99,93,02911659600030000P22735Protein-glutamine gamma-glutamyltransferase KTGM1324880175636,70,54062447,67,67,69,144170573000110000P23284Peptidyl-prolyl cis–trans isomerase BPPIB901680533236,70,5913812212,512,512,53,90615165700090000P23528Cofilin-1CFL1140096711038670,7879323331,931,931,97,726575145000150000P25311Zinc-alpha-2-glycoproteinAZGP1622180028396330,456401101039,639,639,689,8754,89E+08570000P25705ATP synthase subunit alpha, mitochondrialATP5A1222403,3422236,71,898518551313138,455959951000150000P26038MoesinMSN2438701341340,550023661313137,20937422000120000P27482Calmodulin-like protein 3CALML3548010118752,70,2166981111,411,411,42,22421597500030000P29401TransketolaseTKT537161127122,098295225,55,55,52,7178832150040000P29508Serpin B3SERPINB3311286716463330,5288812539,239,221,545,3873,14E+08570000P31025Lipocalin-1LCN11126400019261000,1709965543,843,843,813,8523,17E+08200000P31151Protein S100-A7S100A7906546741995330,4632454435,635,635,66,54482,79E+08130000P31943Heterogeneous nuclear ribonucleoprotein HHNRNPH10161783,3#DIV/0!3310,910,910,95,1523873630030000P31944Caspase-14CASP1428478677567700,2657325526,926,926,964,761,62E+08180000P3194714-3-3 protein sigmaSFN1866402949301,5802083315,715,715,76,44961839600080000P32119Peroxiredoxin-2PRDX2995530,3812433,30,8160813325,319,719,73,865770510000100000P35232ProhibitinPHB0106717#DIV/0!228,88,88,82,1655666200040000P47929Galectin-7LGALS7218486715527000,7106614436363610,1531,12E+08140000P48594Serpin B4SERPINB4284826,7163788,70,5750472225,47,77,72,48182826300050000P49411Elongation factor Tu, mitochondrialTUFM108802165426,71,5204383310,810,810,85,26512468100050000P50990T-complex protein 1 subunit thetaCCT8022514,5#DIV/0!112,72,72,71,7523166610020000P51571Translocon-associated protein subunit deltaSSR40522070#DIV/0!2217,317,317,34,37781210800040000P56470Galectin-4LGALS4361494,73845401,06375229,39,39,34,85013133300070000P58107EpiplakinEPPK104834,633#DIV/0!112,22,22,22,3164395960030000P60174Triosephosphate isomeraseTPI1452483,3190602,70,4212373317,317,317,34,70273279700060000P60660Myosin light polypeptide 6MYL63886505825901,4990092218,518,518,53,72372525100040000P63261Actin, cytoplasmic 2ACTG118784333109453330,582684211065,965,940,5130,061,78E+09750000P60842Eukaryotic initiation factor 4A-IEIF4A10281923,3#DIV/0!226,46,46,42,96042438900030000P60953Cell division control protein 42 homologCDC420445463,3#DIV/0!111111113,48551564900030000P61626Lysozyme CLYZ20341000281520001,3840038855,455,455,463,3771,31E+09370000P61978Heterogeneous nuclear ribonucleoprotein KHNRNPK0186296,7#DIV/0!3310,610,610,63,81171285400050000P6226340S ribosomal protein S14RPS14151860215467671,0185475519,919,919,97,41293678400070000P62318Small nuclear ribonucleoprotein Sm D3SNRPD3406245289036,70,711484117,97,97,92,10141007800030000P63267Actin, gamma-enteric smooth muscleACTG20330633,3#DIV/0!4447,121,821,89,69041983800050000P62805Histone H4HIST1H4A270353327841671,0298255551,551,551,58,480998778000130000P6288860S ribosomal protein L30RPL30355340198566,70,5588082224,324,324,32,5793997030020000P6291360S ribosomal protein L11RPL11216583,31717050,79279117,97,97,91,78993160010000P62937Peptidyl-prolyl cis–trans isomerase APPIA156030724167331,5488844431,531,531,56,65931,19E+08130000P6310414-3-3 protein zeta/deltaYWHAZ741813,34561100,6148584418,418,418,444,40550313000110000P63244Guanine nucleotide-binding protein subunit beta-2-like 1GNB2L10250430#DIV/0!331212124,49061833100060000P68104Elongation factor 1-alpha 1EEF1A1275390015485330,5623067724,224,224,245,1322,71E+08300000P68363Tubulin alpha-1B chainTUBA1B469713332843000,69921410335,935,99,830,9445,03E+08450000P68371Tubulin beta-4B chainTUBB4B230970280496,71,2144291125,82,72,75,9532606900060000Q71DI3Histone H3.2HIST2H3A345050028623670,8295512213,213,213,22,424375754000100000P68871Hemoglobin subunit betaHBB720460081616671,1328417355,84927,943,3775,07E+08260153056P69905Hemoglobin subunit alphaHBA128117667134996670,4801138570,470,447,958,0939,99E+08320000P81605DermcidinDCD1817500089633000,4931664433,633,633,643,1144,07E+08120000Q01469Fatty acid-binding protein, epidermalFABP5559693334093330,6091438873,373,373,326,242,16E+08280000Q02241Kinesin-like protein KIF23KIF23118891,700333,93,93,96,36881783400060000Q02413Desmoglein-1DSG1241363316974670,703283212134,734,734,759,7085,06E+08550000Q06828FibromodulinFMOD19812057155,670,28849113,53,53,53,4136995580040000Q06830Peroxiredoxin-1PRDX1275646728833001,0460139838,738,733,213,2422,54E+08280000Q08188Protein-glutamine gamma-glutamyltransferase ETGM31219600763213,30,625797718,818,818,820,0562,38E+08280000Q08554Desmocollin-1DSC11331333873716,70,656272111117,617,617,649,4933,18E+084201670453Q12905Interleukin enhancer-binding factor 2ILF2091951,67#DIV/0!227,97,97,92,9966524130020000Q13510Acid ceramidaseASAH1128174,794507,330,737332115,85,85,82,9621603300040000Q13618Cullin-3CUL30115725#DIV/0!111,81,81,81,85721018400020000Q13835Plakophilin-1PKP12093251939800,926693559,19,19,161,44146027000160000Q13867Bleomycin hydrolaseBLMH179283,3182646,71,01876227,37,37,32,43912823100050000Q14574Desmocollin-3DSC3140909,7132313,30,938994223,23,23,24,55740164000100000Q15365Poly(rC)-binding protein 1PCBP13280406157101,8769365320,820,812,122,361481310001201710137Q15366Poly(rC)-binding protein 2PCBP21247954357703,4918872215,97,47,42,32928589000201710137Q15517CorneodesmosinCDSN0116080#DIV/0!227,97,97,92,1572348240030000Q16610Extracellular matrix protein 1ECM12081051550100,744864225,25,25,22,6262731800040000Q3V6T2GirdinCCDC88A56381,3320425,670,362277221,21,21,22,04712166000010000Q3ZCM7Tubulin beta-8 chainTUBB84982503614300,7253991115,17,27,22,838544352000401020267Q494V2Coiled-coil domain-containing protein 37CCDC3796047,500111,11,11,11,8333499440000000Q53RT3Retroviral-like aspartic protease 1ASPRV17622703961900,51975113,83,83,81,80443822900060000Q5T749Keratinocyte proline-rich proteinKPRP444373353440001,202592181843,443,443,449,3897,34E+08790000Q5T750Skin-specific protein 32XP32509216732780670,6437475520,420,420,47,88852,76E+08230000Q5T7P3Late cornified envelope protein 1BLCE1B533730022121670,4144731138,138,138,14,92083462200050000Q6UWP8SuprabasinSBSN103502738610,7136193316,616,616,68,21881371500040000Q6ZVX7F-box only protein 50NCCRP1329156,7358696,71,089744228884,0572476300060000Q8WVV4Protein POF1BPOF1B263826,72811301,0655866613,913,913,921,67944142000110000Q92841Probable ATP-dependent RNA helicase DDX17DDX17043555#DIV/0!223,33,33,31,8434322310010000Q96DR8Mucin-like protein 1MUCL168797667171980000,2499792213,313,313,33,3975,16E+0891430850Q96P63Serpin B12SERPINB123712506994601,8840679927,727,727,716,38564243000130000Q96QA5Gasdermin-AGSDMA313646,72300800,733564338,38,38,38,986139148000110000Q9BV38WD repeat-containing protein 18WDR18029124,5#DIV/0!224,44,44,42,7211110670020000Q9GZZ8Extracellular glycoprotein lacritinLACRT69586005722350,0822342216,716,716,77,62348808100040000Q9NZT1Calmodulin-like protein 5CALML5240540011772870,4894354446,646,646,612,44196733000100000Q9UGM3Deleted in malig0t brain tumors 1 proteinDMBT150616139410,275427115,25,25,23,09991509700010000S4R460IGHV3OR16-91274167323823,30,2541451119,819,819,89,40252397000060000Venn Diagram in U937 EVsUnique in EV SAHAP02042HBDP04439HLA-AP08865RPSAP10909CLUP22626HNRNPA2B1P31943HNRNPH1P35232PHBP50990CCT8P51571SSR4P58107EPPK1P60842EIF4A1P60953CDC42P61978HNRNPKP63267ACTG2P63244GNB2L1Q12905ILF2Q13618CUL3Q15517CDSNQ92841DDX17Q9BV38WDR18Unique in EV CTRO43505B3GNT1P01023A2MP01871P02656APOC3P02671FGAP02679FGGP02751FN1P08603CFHQ02241KIF23Q494V2CCDC37Shared between EV CTR and SAHAP02787TFQ9GZZ8LACRTP00738HPP02753RBP4P08123COL1A2P02647APOA1P01009SERPINA1P18206VCLP01857P01859P0C0L5C4BP31025LCN1P0DP25CALM3P27482CALML3P12109COL6A1P02790HPXP01876Q96DR8MUCL1S4R460ENSP00000474135P31944CASP14P02788LTFQ9UGM3DMBT1P11717IGF2RP05109S100A8Q06828FMODP06702S100A9P0DOY3P01860P01834O95498VNN2Q3V6T2CCDC88AP67936TPM4P12724RNASE3P05141SLC25A5Q5T7P3LCE1BP60174TPI1P07900HSP90AA1P25311AZGP1P31151S100A7P02452COL1A1P69905HBA2Q9NZT1CALML5P81605DCDP05090APODQ53RT3ASPRV1P10599TXNP29508SERPINB3P00338LDHAP22735TGM1P04040CATP26038MSNO75629CREG1P01833PIGRP62888RPL30P68104EEF1A1P04406GAPDHP48594SERPINB4P63261ACTG1P23284PPIBQ01469FABP5P63104YWHAZP22531SPRR2EQ08188TGM3Q5T750C1orf68P12273PIPP04792HSPB1Q08554DSC1P35321SPRR1AP68363TUBA1BP04083ANXA1Q02413DSG1P47929LGALS7BP62318SNRPD3Q6UWP8SBSNP05089ARG1Q3ZCM7TUBB8Q96QA5GSDMAQ13510ASAH1Q16610ECM1P11021HSPA5P09211GSTP1P23528CFL1P02545LMNAP62913RPL11P32119PRDX2P07195LDHBQ71DI3HIST2H3DP07339CTSDO75223GGCTP06733ENO1Q13835PKP1P07355ANXA2Q14574DSC3P04075ALDOAP11142HSPA8P0DMV9HSPA1BP15531NME1P15924DSPP62263RPS14Q13867BLMHP08195SLC3A2P62805HIST1H4FQ06830PRDX1P56470LGALS4Q8WVV4POF1BP07437TUBBP12814ACTN1Q6ZVX7NCCRP1P62987UBA52P68871HBBP14618PKMQ5T749KPRPP68371TUBB4BP14923JUPP61626LYZP06576ATP5BP08238HSP90AB1P60660MYL6P00558PGK1P49411TUFMP62937PPIAP31947SFNP04259KRT6BQ15365PCBP1Q96P63SERPINB12P25705ATP5A1P29401TKTQ15366PCBP2P08670VIMP10809HSPD1Fig. 3SAHA-induced changes in AML EV content and resulting biological functions predicted to be inhibited in recipient cells. A Volcano plot showing differentially loaded proteins in AML EVs upon SAHA treatment. Proteins most detected in EV SAHA compared to EV Ctr are in red; proteins less detected in the SAHA group compared to related Ctr are in blue. Proteins involved in drug resistance are circled (ACTG1, fold change = − 0.76; HSP90AA1, fold change = − 1.13); B Ingenuity Pathway Analysis showing functions predicted to be modulated in recipient cells by U937 EVs. Bottom, pie chart of all functions predicted to be modulated by the vesicle groups. Functions not significantly modulated in the comparison between EV SAHA vs EV Ctr are in gray. Functions predicted to be significantly inhibited in EV SAHA are in orange (“Cell viability of tumor cell lines”, 4.3%) and blue (“Invasion of tumor”, 4.3%). Top, proteins involved in the reported functions. The function “Invasion of tumor” showed a p-value of 6.5 × 10^–6^ and z-score of − 2.155. The function “Cell viability of tumor cell lines” showed a p-value of 1.10 × 10^–9^ and z-score of − 2.391. Activation z-score £ − 2 means the function is inhibited; z-score ≥ + 2 means the function is inducedTable 2Downstream analysis by IPA tool—U937 EVsFunctionp-valueActivation stateActivationz-scoreProteins involved (n)Invasion of tumor6.50E-06Decreased− 2.15511Cell viability of tumor cell lines1.10E-09Decreased− 2.39134Immune response of cells6.13E-08–− 1.89523Activation of leukocytes1.07E-06–− 1.22623Complement activation4.37E-11–− 1.13112Cell movement of mononuclear leukocytes7.34E-07–− 0.77219Proliferation of mononuclear leukocytes5.34E-10–− 0.62329Activation of myeloid cells6.34E-06–− 0.62314Activation of phagocytes3.82E-06–− 0.58715Proliferation of lymphatic system cells9.74E-09–− 0.50828Proliferation of lymphocytes3.18E-08–− 0.50826Migration of mononuclear leukocytes1.23E-05–− 0.10815Proliferation of immune cells9.71E-11–− 0.07331Adhesion of myeloid cells1.69E-07–− 0.02411Migration of granulocytes1.27E-05–09Adhesion of granulocytes4.38E-08–0.01710Migration of neutrophils2.06E-05–0.0498Cell movement of lymphocytes6.06E-06–0.05116Cell proliferation of T lymphocytes1.72E-07–0.08922Migration of phagocytes5.02E-06–− 0.47213Angiogenesis3.72E-10–− 1.78435Cell movement of tumor cell lines2.37E-12–− 1.67741Migration of tumor cell lines3.75E-13–− 1.41439Invasion of cells4.46E-13–− 1.35242Invasion of tumor cell lines8.50E-12–− 1.15636Growth of tumor1.03E-05–− 1.10727Colony formation of cells1.98E-07–− 0.75321Colony formation of tumor cell lines1.06E-07–− 0.68817Cell proliferation of tumor cell lines3.03E-11–− 0.25753Invasive tumor1.76E-11–0.09542Metastasis4.01E-10–0.09536Advanced malignant tumor1.17E-09–0.09537Development of tumor cell lines7.74E-08–− 0.49419Cell movement of endothelial cells5.06E-06–− 0.44215Proliferation of vascular cells6.30E-06–− 0.06113Migration of endothelial cells7.75E-06–− 0.5614Apoptosis of leukemia cell lines3.06E-06–− 0.38913Apoptosis of tumor cell lines1.42E-14–− 1.05448Cell survival6.85E-17–− 1.33357Organization of actin filaments2.33E-07–− 0.7479Aggregation of blood platelets1.48E-06–− 0.55511Most relevant biological functions predicted to be modulated by U937 EVs (SAHA vs CTR) in receiving cells. z-score £ − 2 indicates decreased function activation induced by EV SAHA compared to EV CTR. z-score ^3^ 2 indicates increased function activation induced by EV SAHA compared to EV CTR
Regarding K562, EV SAHA contained 234 proteins compared to 124 in EV Ctr, with 100 proteins (38.8%) shared (Table 3). Bioinformatic predictions suggested that EV SAHA might enhance pro-tumoral functions (Table 4). However, proteins like 60S ribosomal protein L11 (RPL11), which sensitize cells to therapeutic agents [36], were more abundant in EV SAHA.Table 3. Proteomics in K562 EVs w/wo SAHAT: Majority protein IDsT: Protein namesT: Gene namesMean CTRLMean SAHAratioN: Razor + unique peptidesN: Unique peptidesN: Sequence coverage [%]N: Unique + razor sequence coverage [%]N: Unique sequence coverage [%]N: ScoreN: IntensityN: MS/MS countN: Deamidation (NQ) site IDsN: Oxidation (M) site IDsN: Deamidation (NQ) site positionsP6225814-3-3 protein epsilonYWHAE94237199653,33332,1186299794427,123,123,19,1403133860007000P6198114-3-3 protein gammaYWHAG0129858#DIV/0!2116,212,15,73,389662332003000P3194714-3-3 protein sigmaSFN358796,66672326666,6676,48463846710947,247,243,150,4551,29E+0834000P6310414-3-3 protein zeta/deltaYWHAZ384766,66671076846,6672,7987005116630,626,526,574,9356138700025000P6227740S ribosomal protein S13RPS13350410002216,616,616,62,634994611005000P6226340S ribosomal protein S14RPS14336390003323,223,223,26,54223357700301350P6224940S ribosomal protein S16RPS16164446,6667720700,4382575912214,414,414,44,114270124008000P6226940S ribosomal protein S18RPS18271048002215,115,115,14,081694266006000P6285440S ribosomal protein S26RPS268249306145850,7450147292220,920,920,94,8418185200008000P6285740S ribosomal protein S28RPS284000503586100,8964129481117,417,417,47,476568279007000P2339640S ribosomal protein S3RPS351770,33333164602,33333,1794721563316,516,516,55,04991233300010000P6124740S ribosomal protein S3aRPS3A053970,5#DIV/0!3314,814,814,84,305431527004000P6270140S ribosomal protein S4, X isoformRPS4X129309,6667003312,512,512,56,239162069005000P6208140S ribosomal protein S7RPS7078364,5#DIV/0!2211,911,911,93,238915673003000P0886540S ribosomal protein SARPSA58135502306,66678,6403486143319,319,319,37,56562185700011000P491894-trimethylaminobutyraldehyde dehydrogenaseALDH9A10146470#DIV/0!4411,711,711,79,3656109850007000P1080960 kDa heat shock protein, mitochondrialHSPD1072371,5#DIV/0!4412,612,612,611,7158494005000P2763560S ribosomal protein L10RPL10095124,66667#DIV/0!3324,324,324,35,371930109007000P6291360S ribosomal protein L11RPL1196445,966671137601,179520554117,97,97,92,419263061006000P3005060S ribosomal protein L12RPL12096624,5#DIV/0!119,19,19,12,452217392002000P2637360S ribosomal protein L13RPL13205680954060,463856476115,25,25,27,896554195005000P1862160S ribosomal protein L17RPL17289766,6667002216,316,316,32,842978237003000P8409860S ribosomal protein L19RPL19302896,6667002213,313,313,35,6693106110006000P3526860S ribosomal protein L22RPL22790483,3333794963,33331,0056674191110,210,210,22,5405190250006000P8373160S ribosomal protein L24RPL24162773,333300118,38,38,32,829144341006000P1102178 kDa glucose-regulated proteinHSPA598438,36667964976,66679,80285126181729,729,729,747,5829570700051000P63261Actin, cytoplasmic 2ACTG13652666,6679525533,3332,607829896221062,462,440,5134,027,91E+0877000P63267Actin, gamma-enteric smooth muscleACTG2275093,3333002230,9996,6296189450005000P61158Actin-related protein 3ACTR30167705#DIV/0!3315,315,315,35,317470435005000P23526AdenosylhomocysteinaseAHCY082303,66667#DIV/0!226,96,96,95,246749382004000Q9UKK9ADP-sugar pyrophosphataseNUDT50330765#DIV/0!4422,822,822,88,709672769007000P30838Aldehyde dehydrogenase, dimeric NADP-preferringALDH3A1056450,33333#DIV/0!224,64,64,63,859635564004000A8K2U0Alpha-2-macroglobulin-like protein 1A2ML10442193,3333#DIV/0!191919,119,119,150,2689020800036000O43707Alpha-actinin-4ACTN40255700#DIV/0!101016,116,116,119,4834219000023000P06733Alpha-enolaseENO1725183,333337643005,190825309212163,863,863,8156,482,96E+0868000P04083Annexin A1ANXA1354506,6667875946,66672,470889123101030,130,130,128,4987382800040000P07355Annexin A2ANXA22230566,66710337333,334,634397836272761,961,961,9248,518,67E+08115000P09525Annexin A4ANXA40279180#DIV/0!6626,626,626,611,8221842600012000P08758Annexin A5ANXA5068933#DIV/0!227,87,87,84,533730330002000P20073Annexin A7ANXA7050733#DIV/0!225,15,15,13,96121308003000P05090Apolipoprotein DAPOD2969251325066,6674,4626308557729,629,629,645,04841121000111428358O75342Arachidonate 12-lipoxygenase, 12R-typeALOX12B72146,56637209,1996146736611,311,311,319,5787687600018000P05089Arginase-1ARG1456906,66674083133,3338,936471344111143,543,543,537,5752,32E+0841000P25705ATP synthase subunit alpha, mitochondrialATP5A1161363,3333246046,66671,5247991087717,217,217,217,3153788900029000P06576ATP synthase subunit beta, mitochondrialATP5B343926,66671930500,561311528819,719,719,717,5244671700022000O15523ATP-dependent RNA helicase DDX3YDDX3Y026156#DIV/0!224,24,24,24,54232172004000P07686Beta-hexosaminidase subunit betaHEXB038851,5#DIV/0!113,83,83,82,790122534002000P21810BiglycanBGN693100006626,426,426,415,2153596700016000Q13867Bleomycin hydrolaseBLMH948131176233,33312,40582339111133333334,454966760002701640P27482Calmodulin-like protein 3CALML3218850187823,33330,8582286193330,930,930,97,9575134200009000Q9NZT1Calmodulin-like protein 5CALML551184026423005,1623554248860,360,360,349,2278516200022255025P07384Calpain-1 catalytic subunitCAPN150404,5355503,33337,053007833557,87,87,811,0374202400012000Q9UI42Carboxypeptidase A4CPA40594426,6667#DIV/0!228,68,68,68,4294374490007000P31944Caspase-14CASP14514723,33333052266,6675,929917043161652,952,952,983,1731,61E+0846000P04040CatalaseCAT463266,66671857466,6674,009497769111130,930,930,952,5442,02E+0843000P07858Cathepsin BCTSB0569180#DIV/0!4412,112,112,18,53693244300010000P07339Cathepsin DCTSD988191688066,66717,082409938822,622,622,626,2511,02E+0827000O60911Cathepsin L2CTSV01154133,333#DIV/0!6632,932,932,917,8416232400019000P60953Cell division control protein 42 homologCDC42082089#DIV/0!2216,216,216,23,015914776002000Q00610Clathrin heavy chain 1CLTC014051,6#DIV/0!222,52,52,54,639625293002000P35606Coatomer subunit betaCOPB2043873#DIV/0!223334,082863178004000P23528Cofilin-1CFL10516530#DIV/0!4431,931,931,915,5291595800012000P02452Collagen alpha-1(I) chainCOL1A134108,200555,15,15,112,67275720009000P12109Collagen alpha-1(VI) chainCOL6A13455600223,23,23,23,103955981004000P08123Collagen alpha-2(I) chainCOL1A279993,3333300221,61,61,613,757165590009000P12111Collagen alpha-3(VI) chainCOL6A33131,8500220,70,70,72,655610774002000O75131Copine-3CPNE30145126,6667#DIV/0!4412,712,712,77,4679104490005000Q15517CorneodesmosinCDSN526983,3333619096,66671,1747936375512,312,312,317,0035157300012000Q9BYD5CornifelinCNFN01491833,333#DIV/0!1119,619,619,65,782989510005000P35321Cornifin-ASPRR1A01628666,667#DIV/0!1170,819,119,14,6057342020003000P22528Cornifin-BSPRR1B1225053,33313414533,3310,950162717270,870,828,118,973,07E+0833000P21291Cysteine and glycine-rich protein 1CSRP1176100004436,836,836,87,071496056006000Q9UGL9Cysteine-rich C-terminal protein 1CRCT103611233,333#DIV/0!2250,550,550,58,3217541680009000Q07065Cytoskeleton-associated protein 4CKAP4070393,66667#DIV/0!6616,416,416,411,89480247008000Q3MJ16Cytosolic phospholipase A2 epsilonPLA2G4E032684,5#DIV/0!223,23,23,23,213122226003000P07585DecorinDCN265049,3333004412,812,812,830,9611510800071430193P81605DermcidinDCD7795166,6672541666,6670,3260567454435,535,535,515,4521,55E+0819000P17661DesminDES043025,66667#DIV/0!118,53,23,23,858341305004000Q08554Desmocollin-1DSC1892603,333317247001,932213264181826,726,726,781,8073,77E+0863000Q14574Desmocollin-3DSC392316,33333435096,66674,7131060237712,312,312,319,8077753000025000Q02413Desmoglein-1DSG11730266,6675274566,6673,048412576313141,141,141,1134,148,62E+0877000P15924DesmoplakinDSP784736,333310046766,6712,8027290718118160,260,260,2323,315,3E+09547000P04843Dolichyl-diphosphooligosaccharide--protein glycosyltransferase subunit 1RPN1044993,33333#DIV/0!337,77,77,75,267649943006000P68104Elongation factor 1-alpha 1EEF1A19113571498339,6671,6440754468829,229,229,239,351,52E+083101370P13639Elongation factor 2EEF234074,6666780905023,74344577171726,126,126,152,7361,14E+0848000Q92817EnvoplakinEVPL095881#DIV/0!996,36,36,320,6153279100019000P58107EpiplakinEPPK1041760,33333#DIV/0!558,86,26,219,9573420200012000P60842Eukaryotic initiation factor 4A-IEIF4A10181316,6667#DIV/0!225,75,75,74,7995125110006000P56537Eukaryotic translation initiation factor 6EIF6325715972056,33332,9843769353322,922,922,919,7293210900010000Q16610Extracellular matrix protein 1ECM10960000#DIV/0!7720,720,720,720,715912440001401670P52907F-actin-capping protein subunit alpha-1CAPZA10533670#DIV/0!4425,925,925,910,1052160600012000P47756F-actin-capping protein subunit betaCAPZB0260565#DIV/0!3313,713,713,74,81588592004000Q16658FascinFSCN1059986,66667#DIV/0!114,94,94,95,005850389003000P49327Fatty acid synthaseFASN017483,25#DIV/0!331,91,91,95,289843708003000Q01469Fatty acid-binding protein, epidermalFABP52710966,667150960005,568493403111173,373,373,394,4164,27E+0847000Q6ZVX7F-box only protein 50NCCRP11793904755366,66726,508538196623,623,623,614,2581,76E+0821000P02751FibronectinFN134133005533315,6061034200010000P21333Filamin-AFLNA022139,83333#DIV/0!5533311,05389002006000O75369Filamin-BFLNB08101,6#DIV/0!221,41,41,44,047334513003000Q13642Four and a half LIM domains protein 1FHL16458600228,78,78,73,08634877004000P04075Fructose-bisphosphate aldolase AALDOA300489,33331530733,3335,094135344121140,940,933,246,7961,26E+08360770P09972Fructose-bisphosphate aldolase CALDOC026912#DIV/0!1112,14,44,43,204612380002000P47929Galectin-7LGALS7345058,66675281566,66715,306286089965,465,465,491,5821,69E+0837000O75223Gamma-glutamylcyclotransferaseGGCT488296,66672249466,6674,6067622829947,347,347,323,3571,07E+0831000P17900Ganglioside GM2 activatorGM2A0158060,5#DIV/0!229,89,89,82,743825290002000Q96QA5Gasdermin-AGSDMA83387,666671135813,33313,620879196611,911,911,923,7238778300017000P04062GlucosylceramidaseGBA098282,33333#DIV/0!224,14,14,13,948279609005000P15104Glutamine synthetaseGLUL0285603,3333#DIV/0!4414,214,214,211,3981285200010000P09211Glutathione S-transferase PGSTP1149613,33331146263,3337,6615052137751,951,951,920,1174276300015000P04406Glyceraldehyde-3-phosphate dehydrogenaseGAPDH3061266,66711402766,673,724852458161650,450,450,475,317,38E+08520820Q7L5L3Glycerophosphodiester phosphodiesterase domain-containing protein 3GDPD30444126,3333#DIV/0!5519,219,219,211,714213180009000Q9Y2T3Guanine deaminaseGDA052317#DIV/0!3311,211,211,25,361627205004000P0DMV9Heat shock 70 kDa protein 1BHSPA1B116134309576,66672,6656850427119,716,52,315,7024086800025000P17066Heat shock 70 kDa protein 6HSPA60110653,3333#DIV/0!1110,61,71,74,9675122820006000P11142Heat shock cognate 71 kDa proteinHSPA8210013,33339102404,334201003171432,532,527,438,8711,11E+0852000P04792Heat shock protein beta-1HSPB13499604559766,66713,029393848860606026,7852,06E+0825000P07900Heat shock protein HSP 90-alphaHSP90AA1528861635703,0928790235516,39,29,215,3171968400014000P08238Heat shock protein HSP 90-betaHSP90AB1282463,33334377001,54958165710417177,925,2397129700033000P69905Hemoglobin subunit alphaHBA14599733,333739016,66670,1606651113356,338,738,79,2861,28E+0818000P68871Hemoglobin subunit betaHBB4534133,333615016,66670,1356415048474,861,936,136,2771,7E+082401380P55795Heterogeneous nuclear ribonucleoprotein H2HNRNPH20148463,3333#DIV/0!113,83,83,84,820875716004000Q00839Heterogeneous nuclear ribonucleoprotein UHNRNPU5759380347,666671,395094311445,65,65,69,0325131810008000P22626Heterogeneous nuclear ribonucleoproteins A2/B1HNRNPA2B144774219650,66674,9057637624414,214,214,26,98541586500010000P42357Histidine ammonia-lyaseHAL29437,333331248273,66742,40444107151533,633,633,658,5311,3E+0844000Q99878Histone H2A type 1-JHIST1H2AJ5683366,6673131133,3330,550929322115,615,68,66,08361,32E+089000Q99880Histone H2B type 1-LHIST1H2BL5052800368856,66670,0730004494434,934,934,97,1866784850007000P62805Histone H4HIST1H4A967130055528000,5741523899962,162,162,156,2912,74E+083401360Q9BYJ1Hydroperoxide isomerase ALOXE3ALOXE30157420#DIV/0!4499919,924136960009000P01876Ig alpha-1 chain C regionIGHA1390065317373,33330,813642171441515159,67212771600012000P01857Ig gamma-1 chain C regionIGHG11216233,3334304600,3539287977429,429,418,814,0587410200024000P01860Ig gamma-3 chain C regionIGHG3176508002120,411,183,619699621004000P01834Ig kappa chain C regionIGKC888056,66671018153,3331,1464959075551,451,451,415,2992859300011000O14732Inositol monophosphatase 2IMPA20335140#DIV/0!227,37,37,33,8275130700004000P14735Insulin-degrading enzymeIDE067509#DIV/0!668,98,98,911,74101260007000Q9NZH8Interleukin-36 gammaIL36G094290,45#DIV/0!221313133,416120744003000P07476InvolucrinIVL0326440#DIV/0!101022,122,122,134,4763231800028000P14923Junction plakoglobinJUP124220013450333,3310,82783234383863,463,463,4223,462,03E+091231520432Q9UKR3Kallikrein-13KLK130158919#DIV/0!3313,413,413,45,034557211006000Q9Y337Kallikrein-5KLK50163956,6667#DIV/0!227,57,57,53,513168863006000P49862Kallikrein-7KLK70263036,6667#DIV/0!3318,618,618,67,3533868020041790202P02788LactotransferrinLTF850833,333364802,666670,076163761161632,829,929,942,6441,29E+08551270280Q5T7P2Late cornified envelope protein 1ALCE1A04261800#DIV/0!2261,861,861,89,21672557100010000Q5T7P3Late cornified envelope protein 1BLCE1B014256000#DIV/0!1166,928,828,83,7533589420003000Q5T752Late cornified envelope protein 1DLCE1D03151350#DIV/0!1127,227,227,213,586126050002000Q5T753Late cornified envelope protein 1ELCE1E017570500#DIV/0!2164,464,426,318,815702820008000Q5T754Late cornified envelope protein 1FLCE1F08987100#DIV/0!2264,464,464,421,63539240005000Q5TA79Late cornified envelope protein 2ALCE2A0937620#DIV/0!1123,623,623,63,950656257003000Q5TA81Late cornified envelope protein 2CLCE2C107770055977005,1941171012223,623,623,613,069378970009000Q5TA82Late cornified envelope protein 2DLCE2D01025990#DIV/0!1122,722,722,76,749561558003000Q9BYE3Late cornified envelope protein 3DLCE3D01048513,333#DIV/0!113737373,87462910006000P31025Lipocalin-1LCN14830866,6674550450,0941953132212,512,512,54,74691,23E+088000P00338L-lactate dehydrogenase A chainLDHA0651053,3333#DIV/0!4413,613,613,68,51013515700010000P23490LoricrinLOR04835600#DIV/0!224,24,24,23,0726482610004000P51884LumicanLUM53691002215,19,59,54,847917181003000P10619Lysosomal protective proteinCTSA0169436,6667#DIV/0!114,24,24,214,212102890004000P11279Lysosome-associated membrane glycoprotein 1LAMP10589186,6667#DIV/0!226,26,26,28,4513335840005000P61626Lysozyme CLYZ7012566,6671298006,6670,185097235543,943,943,921,3242,24E+0821000P40121Macrophage-capping proteinCAPG0109300,6667#DIV/0!227,27,27,24,101445905005000P40925Malate dehydrogenase, cytoplasmicMDH10211870#DIV/0!229,69,69,64,583295341005000P40926Malate dehydrogenase, mitochondrialMDH2084699,66667#DIV/0!3314,514,514,55,51953361005000P26038MoesinMSN28122,5378011,344155036447,17,17,16,477443510003000P60660Myosin light polypeptide 6MYL61444102675951,8530226442217,217,217,24,075682401006000Q7Z406Myosin-14MYH1408292,3#DIV/0!222,51,21,23,838125623004000P35579Myosin-9MYH90728580#DIV/0!353320,720,719,4182,52,27E+0888000P48163NADP-dependent malic enzymeME1021967,66667#DIV/0!223,73,73,73,571318453004000Q09666Neuroblast differentiation-associated protein AHNAKAHNAK4609,35292436,34427847714145,85,85,831,79836452000281851581084P80188Neutrophil gelatinase-associated lipocalinLCN20168796,6667#DIV/0!3322,222,222,27,476545575004000P62937Peptidyl-prolyl cis-trans isomerase APPIA0417340#DIV/0!229,19,19,13,338783467002000P23284Peptidyl-prolyl cis-trans isomerase BPPIB210766,6667125874,66670,5972228373318,518,518,56,71731211900010000O60437PeriplakinPPL0136333,3333#DIV/0!161613131336,7064621700034000Q06830Peroxiredoxin-1PRDX110096504082433,3334,04341438510945,245,239,724,2392,29E+0841000P32119Peroxiredoxin-2PRDX24514901881833,3334,1680509729934,328,828,820,0389099900027000P30041Peroxiredoxin-6PRDX60112677#DIV/0!2214,714,714,75,094333803003000P51659Peroxisomal multifunctional enzyme type 2HSD17B4040898#DIV/0!335,25,25,25,847234355004000Q96G03Phosphoglucomutase-2PGM2048117#DIV/0!336,76,76,76,140332720003000P00558Phosphoglycerate kinase 1PGK1771534441005,7560950325522,322,322,319,9384013800016000P18669Phosphoglycerate mutase 1PGAM10271323,3333#DIV/0!228,38,38,37,9611111770007000Q6P4A8Phospholipase B-like 1PLBD10163656,6667#DIV/0!224,34,34,33,3715122740005000Q13835Plakophilin-1PKP1277296,66674112666,66714,831287792929494949143,816,06E+081054240635Q15149PlectinPLEC017441#DIV/0!651,61,61,210,5815174000114280520Q15365Poly(rC)-binding protein 1PCBP10139976,6667#DIV/0!227773,446771388003000P01833Polymeric immunoglobulin receptorPIGR027800,5#DIV/0!112,62,62,63,675122796002000P02545Prelamin-A/CLMNA6297601200910,3331,906933329252537,237,237,285,5952,25E+08820760P12273Prolactin-inducible proteinPIP2582233,333164523,33330,0637135816640,440,440,412,8987416200020000P25786Proteasome subunit alpha type-1PSMA10152330#DIV/0!4420,220,220,26,492577689006000P25788Proteasome subunit alpha type-3PSMA30225070#DIV/0!114,74,74,72,605787777003000P25789Proteasome subunit alpha type-4PSMA40129245#DIV/0!2211,111,111,15,734933604004000P28066Proteasome subunit alpha type-5PSMA50272734,3333#DIV/0!3314,514,514,56,390890002006000O14818Proteasome subunit alpha type-7PSMA799371,33333328296,66673,3037361554424,624,624,67,60891796200011000P20618Proteasome subunit beta type-1PSMB10285856,6667#DIV/0!3322,822,822,816,281120060006000P49721Proteasome subunit beta type-2PSMB20195933,3333#DIV/0!117,57,57,53,139158781003000P28070Proteasome subunit beta type-4PSMB40236365#DIV/0!2215,915,915,95,883852000003000P28074Proteasome subunit beta type-5PSMB50162180,3333#DIV/0!5524,724,724,78,684972982008000P28072Proteasome subunit beta type-6PSMB60444015#DIV/0!228,48,48,42,932797684004000Q8WVV4Protein POF1BPOF1B138366,66676095933,33344,05637196252548,748,748,7119,585,05E+088501820P31949Protein S100-A11S100A110308816,6667#DIV/0!222020204,358646322004000Q9HCY8Protein S100-A14S100A143582801462966,6674,0833054224458,758,758,716,0953573800012000P29034Protein S100-A2S100A201465250#DIV/0!3327,627,627,65,085117220004000P31151Protein S100-A7S100A71578933,33351794003,2803158258837,637,637,618,6121,42E+0823000P05109Protein S100-A8S100A87703466,66775526666,679,804243977101046,246,246,2116,212E+09380840P06702Protein S100-A9S100A95526333,333452260008,183726401101070,270,270,247,2471,22E+09400850Q01105Protein SETSET9579100228,38,38,33,367865138004000O43548Protein-glutamine gamma-glutamyltransferase 5TGM50230996,6667#DIV/0!6613,813,813,816,4852286900013000Q08188Protein-glutamine gamma-glutamyltransferase ETGM31987002019233,33310,1622211212140,740,740,756,9862,66E+087101540P22735Protein-glutamine gamma-glutamyltransferase KTGM1168759,33332140966,66712,6865082202036363691,8683,26E+0848397110234P00491Purine nucleoside phosphorylasePNP0125516,3#DIV/0!2211,111,111,13,75367779004000P55786Puromycin-sensitive aminopeptidaseNPEPPS029524#DIV/0!335,45,45,45,567628343003000P14618Pyruvate kinase PKMPKM183196,66671829033,3339,983988064191947,347,347,381,3651,99E+085315188199P50395Rab GDP dissociation inhibitor betaGDI2081140,33333#DIV/0!226,16,16,14,900968157004000P61106Ras-related protein Rab-14RAB14059692,5#DIV/0!117773,639419102002000P51149Ras-related protein Rab-7aRAB7A0100383#DIV/0!2212,112,112,14,374328108003000P02753Retinol-binding protein 4RBP424688500115552,715658073004000Q53RT3Retroviral-like aspartic protease 1ASPRV102425066,667#DIV/0!3313,713,713,718,2928002700011000Q9H1E1Ribonuclease 7RNASE70396313,3333#DIV/0!3332,732,732,712,72783226006000P13489Ribonuclease inhibitorRNH1032162#DIV/0!227,67,67,63,458125086006000P02787SerotransferrinTF516593,33331224100,236956213131325,522,622,627,3417357900036000Q96P63Serpin B12SERPINB129428803606933,3333,825442616131344,444,444,4117,22,73E+085101860P29508Serpin B3SERPINB3331770489110014,7424420514742,342,324,479,6213,45E+0853000P48594Serpin B4SERPINB40150855#DIV/0!2225,67,77,73,664463358003000P36952Serpin B5SERPINB50169955,3333#DIV/0!3312,812,812,87,2195112170007000P50452Serpin B8SERPINB8059989,66667#DIV/0!227,87,87,85,162137794005000Q8NEX9Short-chain dehydrogenase/reductase family 9C member 7SDR9C70195948,3#DIV/0!4416,916,916,98,446111690007000Q9Y3R4Sialidase-2NEU20157543#DIV/0!3311,311,311,36,64685074005000P84550SKI family transcriptional corepressor 1SKOR1036390,5#DIV/0!111,11,11,12,641234207003000Q5T750Skin-specific protein 32XP321882646,667124900006,6342772769948,848,848,828,154,74E+0830195027P35325Small proline-rich protein 2BSPRR2B3079566,66719152333,336,2191650347079,279,2035,0514E+0843000P22532Small proline-rich protein 2DSPRR2D01609033,333#DIV/0!1179,225252,811289630004000P22531Small proline-rich protein 2ESPRR2E02237933,333#DIV/0!1179,218,118,12,637424610005000Q9BYE4Small proline-rich protein 2GSPRR2G465510001161,631,531,54,582546551002000Q96PI1Small proline-rich protein 4SPRR403227933,333#DIV/0!444343438,14857747100010000Q9NY59Sphingomyelin phosphodiesterase 3SMPD3029197#DIV/0!226,66,66,63,719716934003000P38646Stress-70 protein, mitochondrialHSPA9041330#DIV/0!224,44,44,44,000431411002000P00441Superoxide dismutase [Cu-Zn]SOD10282804#DIV/0!3329,229,229,26,833978408005000Q6UWP8SuprabasinSBSN231970543186,66672,3416246355522222273,7997441500032000P50990T-complex protein 1 subunit thetaCCT8026066#DIV/0!337,17,17,14,609219289005000P10599ThioredoxinTXN60619537560006,1960260315531,431,431,412,0058736300018000Q9BQ50Three prime repair exonuclease 2TREX20385886,6667#DIV/0!3318,618,618,66,7891138920009000P19971Thymidine phosphorylaseTYMP050477,33333#DIV/0!225,85,85,84,240536344006000P37837TransaldolaseTALDO10117649#DIV/0!227,77,77,73,433760000005000P55072Transitional endoplasmic reticulum ATPaseVCP0383903,3333#DIV/0!141426,726,726,732,7715182700031000P29401TransketolaseTKT0250480#DIV/0!338,58,58,58,5964192330009000P51571Translocon-associated protein subunit deltaSSR40358883,3333#DIV/0!2217,317,317,34,922875365005000P49755Transmembrane emp24 domain-containing protein 10TMED100278880#DIV/0!3320,520,520,55,6769100400006000Q9BVK6Transmembrane emp24 domain-containing protein 9TMED90136257,6667#DIV/0!2214,514,514,54,782557228005000P60174Triosephosphate isomeraseTPI194687,5550613,33335,8150583067744,644,644,619,7863130100021000Q71U36Tubulin alpha-1A chainTUBA1A833583,33332254833,3332,7049885039031,531,5034,4491,95E+0835000Q9BQE3Tubulin alpha-1C chainTUBA1C077750,66667#DIV/0!1133,25,35,33,612848983004000P68371Tubulin beta-4B chainTUBB4B128666,6667324526,66672,5222279797217,817,86,115,3012719200018000Q5VVQ6Ubiquitin thioesterase OTU1YOD10389106,6667#DIV/0!5520,120,120,115,0411867700014000P62987Ubiquitin-60S ribosomal protein L40UBA523637766,66750469001,3873622095538,338,338,339,9141,56E+0818000P08670VimentinVIM2658900368933,33330,138754121272459,957,952,688,6543,09E+0882000P18206VinculinVCL16672,5185483,333311,125106219910,910,910,923,4184423400022000P38606V-type proton ATPase catalytic subunit AATP6V1A0114554,6667#DIV/0!4411,811,811,810,688116850007000P21281V-type proton ATPase subunit B, brain isoformATP6V1B20147260#DIV/0!225,35,35,33,4364110440005000P25311Zinc-alpha-2-glycoproteinAZGP1609306,6667843743,33331,384759727101039,339,339,321,9457846500038000A0A1B0GTR40810820#DIV/0!2215,715,715,74,329297299006000P0DP25344630001111,411,411,43,683293051003000S4R460IGHV3OR16-9144886,6667001119,819,819,84,127446487005000Venn Diagram in K562 EVsShared between EV CTR and SAHAP09211GSTP1P35268RPL22P13639EEF2Q13867BLMHP62854RPS26P14618PKMP31944CASP14P68104EEF1A1P10599TXNP47929LGALS7BP23396RPS3O75342ALOX12BP08238HSP90AB1Q01469FABP5P32119PRDX2P12273PIPP11142HSPA8P63104YWHAZP22626HNRNPA2B1P01876P04040CATQ09666AHNAKP62258YWHAEP63261ACTG1P07339CTSDP35325SPRR2BQ9HCY8S100A14Q5T750C1orf68P05089ARG1P00558PGK1P62857RPS28P04083ANXA1P62249RPS16P31025LCN1Q99878HIST1H2AJQ06830PRDX1Q6UWP8SBSNO75223GGCTQ71U36TUBA1AP01834P05090APODP61626LYZP60660MYL6P0DMV9HSPA1BQ96QA5GSDMAQ14574DSC3P27482CALML3P08670VIMP01857Q96P63SERPINB12P56537EIF6P29508SERPINB3P81605DCDQ99880HIST1H2BLP31151S100A7Q6ZVX7NCCRP1P68871HBBQ5TA81LCE2CP04075ALDOAP60174TPI1P31947SFNP02545LMNAP25705ATP5A1Q08554DSC1P22735TGM1P06733ENO1Q15517CDSNP62987UBA52P11021HSPA5P07384CAPN1P25311AZGP1P02787TFP06702S100A9P62805HIST1H4FP07355ANXA2P23284PPIBO14818PSMA7Q13835PKP1Q08188TGM3P18206VCLQ02413DSG1P42357HALP08865RPSAP02788LTFP62913RPL11P04406GAPDHP04792HSPB1P14923JUPP15924DSPP68371TUBB4BQ00839HNRNPUQ8WVV4POF1BP69905HBA2P07900HSP90AA1P26373RPL13Q9NZT1CALML5P22528SPRR1BP05109S100A8P26038MSNP06576ATP5BUnique in EV SAHAP61981YWHAGP61247RPS3AP62081RPS7P49189ALDH9A1P10809HSPD1P27635RPL10P30050RPL12P61158ACTR3P23526AHCYQ9UKK9NUDT5P30838ALDH3A1A8K2U0A2ML1O43707ACTN4P09525ANXA4P08758ANXA5P20073ANXA7O15523P07686HEXBQ9UI42CPA4P07858CTSBO60911CTSVP60953CDC42Q00610CLTCP35606COPB2P23528CFL1O75131CPNE3Q9BYD5CNFNP35321SPRR1AQ9UGL9CRCT1Q07065CKAP4Q3MJ16PLA2G4EP17661DESP04843RPN1Q92817EVPLP58107EPPK1P60842EIF4A1Q16610ECM1P52907CAPZA1P47756CAPZBQ16658FSCN1P49327FASNP21333FLNAO75369FLNBP09972ALDOCP17900GM2AP04062GBAP15104GLULQ7L5L3GDPD3Q9Y2T3GDAP17066HSPA6P55795HNRNPH2Q9BYJ1ALOXE3O14732IMPA2P14735IDEQ9NZH8IL36GP07476IVLQ9UKR3KLK13Q9Y337KLK5P49862KLK7Q5T7P2LCE1AQ5T7P3LCE1BQ5T752LCE1DQ5T753LCE1EQ5T754LCE1FQ5TA79LCE2AQ5TA82LCE2DQ9BYE3LCE3DP00338LDHAP23490LORP10619CTSAP11279LAMP1P40121CAPGP40925MDH1P40926MDH2Q7Z406MYH14P35579MYH9P48163ME1P80188LCN2P62937PPIAO60437PPLP30041PRDX6P51659HSD17B4Q96G03PGM2P18669PGAM1Q6P4A8PLBD1Q15149PLECQ15365PCBP1P01833PIGRP25786PSMA1P25788PSMA3P25789PSMA4P28066PSMA5P20618PSMB1P49721PSMB2P28070PSMB4P28074PSMB5P28072PSMB6P31949S100A11P29034S100A2O43548TGM5P00491PNPP55786NPEPPSP50395GDI2P61106RAB14P51149RAB7AQ53RT3ASPRV1Q9H1E1RNASE7P13489RNH1P48594SERPINB4P36952SERPINB5P50452SERPINB8Q8NEX9SDR9C7Q9Y3R4NEU2P84550SKOR1P22532SPRR2DP22531SPRR2EQ96PI1SPRR4Q9NY59SMPD3P38646HSPA9P00441SOD1P50990CCT8Q9BQ50TREX2P19971TYMPP37837TALDO1P55072VCPP29401TKTP51571SSR4P49755TMED10Q9BVK6TMED9Q9BQE3TUBA1CQ5VVQ6YOD1P38606ATP6V1AP21281ATP6V1B2A0A1B0GTR4NEU2Unique in EV CTRLP12109COL6A1P01860S4R460ENSP00000474135P02751FN1P63267ACTG2P08123COL1A2Q9BYE4SPRR2GP62701RPS4XP21291CSRP1P51884LUMP02452COL1A1P21810BGNQ01105SETP62263RPS14P07585DCNP12111COL6A3P0DP25CALM3P18621RPL17Q13642FHL1P62277RPS13P84098RPL19P62269RPS18P02753RBP4P83731RPL24Table 4Downstream analysis by IPA tool—K562 EVsFunctionp-valueActivation stateActivation z-scoreMolecules (n)Apoptosis of tumor cell lines3.22E-11–− 1.27458Cell death of cancer cells3.48E-16–− 1.05933Interaction of tumor cell lines1.68E-06–1.00622Cell movement of granulocytes4.19E-07–0.10722Transmigration of leukocytes3.33E-07–0.23913Cell movement of lymphocytes2.00E-06–0.63922Cell movement of phagocytes3.47E-07–0.73729Leukocyte migration1.06E-11–1.02349Cell movement of leukocytes1.87E-11–1.10944Cell movement of myeloid cells6.99E-08–1.13130Migration of myeloid cells1.43E-06–− 0.15514Immune response of cells9.66E-08–0.48430Inflammation of body cavity2.41E-11–− 0.22851Inflammation of organ3.52E-28–− 0.87591Development of benign tumor8.37E-07–− 0.40428Development of malignant tumor2.96E-07–− 0.351182Hematopoietic neoplasm1.72E-09–− 0.017103Invasion of tumor2.20E-07–0.07816Formation of solid tumor8.55E-09–0.397209Metastatic solid tumor1.62E-08–0.1833Hematological lymphatic system tumor1.29E-09–0.201104Tumorigenesis of tissue1.18E-15–0.23241Invasive tumor1.78E-10–1.35455Metastasis1.02E-09–1.35448Vasculogenesis2.23E-07–1.86236Angiogenesis1.10E-09Increased2.11246Development of vasculature4.13E-09Increased2.11448Cell proliferation of tumor cell lines5.46E-10Increased2.53871Migration of cells1.28E-15Increased2.55290Cell movement of tumor cell lines3.83E-11Increased2.83253Cell movement1.23E-16Increased2.95198Migration of tumor cell lines2.31E-10Increased3.40947Invasion of tumor cell lines5.75E-09Increased3.64843Cell survival5.04E-17Increased3.72477Cell viability7.58E-14Increased3.81269Most relevant biological functions predicted to be modulated by K562 EVs (SAHA vs CTR) in receiving cells. z-score £ −2 indicates decreased function activation induced by EV SAHA compared to EV CTR. z-score ^3^ 2 indicated increased function activation induced by EV SAHA compared to EV CTR
These observations suggest the potential therapeutic value of SAHA in particular when combined with complementary therapies.
SAHA-inducedEVs affect tumorigenicity but not resistance to SAHA in leukemic cells
Following molecular assessments and in silico predictions, we interrogated the functional impact of EV SAHA on recipient leukemic cells. Specifically, we evaluated whether EV SAHA influences tumorigenicity and modulates resistance to SAHA treatment.
In U937 cells, neither EV Ctr nor EV SAHA significantly affected cell viability or cell cycle (Fig. S3A-B).In a tumorigenicity assay, however, AML-derived EV SAHA elicited pro-tumoral effects comparable to those observed with EV Ctr (Fig. 4A, B). Notably, EV treatments increased BCLAF1mRNA levels in recipient cells, gain that was abrogated by SAHA treatment (Fig. 4C Left). Expectedly, the EV intervention did not enhance the miRNA levels in recipient AML cells; instead, SAHA induced miR-194-5p overexpression regardless of EV exposure (Fig. 4C Right). Furthermore, neither EV Ctr nor EV SAHA conferred resistance to the treatment in recipient cells (Fig. 4D, E).Fig. 4. Tumorigenic capability, drug resistance and molecular delivery induced by EV SAHA in U937 and K562. A Images acquired with Cytation of U937 colony formation upon treatment with PBS, LV Ctr, LV SAHA, SV Ctr, and SV SAHA; B Left, number of newly formed colonies (per cm^2^); Right, area of the colonies (indicated as pixel density). Error bars indicate standard deviation; C Left, BCLAF1mRNA yield in U937 cells exposed to EVs from different sources and subsequently untreated or treated with SAHA (5 µM at 24 h), normalized to GAPDH expression; Right, miR-194-5p yield in U937 cells exposed to EVs from different sources and subsequently untreated or treated with SAHA (5 µM at 24 h), normalized to RNU6 expression; D Survival and tumorigenic capability of U937 cells pretreated with EVs from different sources followed by SAHA treatment (5 µM at 24 h). Images acquired with Agilent BioTek Cytation 5; E Propidium Iodide-based evaluation of cell survival following SAHA treatment induced by EVs from different sources. Error bars indicate standard deviation; F Images acquired with Cytation of K562 colony formation upon treatment with PBS, LV Ctr, LV SAHA, SV Ctr, and SV SAHA; G Left, number of newly formed colonies (per cm^2^); Right, area of the colonies (indicated as pixel density). Error bars indicate standard deviation; H BCLAF1mRNA yield in K562 cells exposed to EVs from different sources and subsequently untreated or treated with SAHA (5 µM at 24 h), normalized to GAPDH expression; I miR-194-5p yield in K562 cellsexposed to EVs from different sources and subsequently untreated or treated with SAHA (5 µM at 24 h), normalized to RNU6 expression
Comparable evaluations were performed in K562 cells (Fig. 4). While EVs did not affect viability or cell cycle (Fig. S3C-D), EV SAHA (both SV and LV) produced fewer new tumor colonies relative to EV Ctr (Fig. 4F, G), indicating an anti-neoplastic effect. Consistent with the AML findings, EV treatments delivered BCLAF1 mRNA to recipient CML cells, with only LV Ctr showing a restrained BCLAF1accumulation (Fig. 4H). Regarding the miRNA expression, no significant differences were observed between cells treated with EV SAHA and those receiving EV Ctr, although LVs appeared to deliver greater amounts of miR-194-5p than SVs. Interestingly, EV exposure prior SAHA treatment resulted in an overall enhancement of miR-194-5p expression compared to SAHA treatment alone (Fig. 4I).
In summary, our findings suggest that EV SAHA does not exacerbate tumor progression in AML, whereas it may inhibit malignant development in CML. These results underscore the context-dependent therapeutic potential of SAHA in leukemia.
Discussion
EV-mediated communication between cancer cells and their microenvironment is gaining increasing recognition as a pivotal process in tumor progression, as it significantly contributes to numerous cancer-related processes, such as tumorigenesis, tumor growth, angiogenesis, immune escape, metastasis, and drug resistance [45, 46]. However, albeit their relevance, the impact of anti-cancer treatments on vesicle-mediated communication is often underestimated and therefore under explored.
This study provides valuable insights into the role of SAHA in modulating EV secretion and composition, while also offering interesting speculations on the potential function of SAHA-modified EVs in Leukemia. By altering both the quantity and molecular content of EVs, SAHA affects intracellular dynamics and extracellular communication, presenting new avenues for therapeutic exploration.
Our previous efforts revealed that SAHA reverses the miR-194-5p/BCLAF1 imbalance responsible for the differentiation arrest and apoptosis resistance characteristic of Leukemia cells. In this study, we uncover that SAHA, while upregulating miR-194-5p expression at the expense of BCLAF1 intracellularly, it selectively fosters BCLAF1 (at both mRNA and protein level) loading into EVs and reduces the miRNA levels in the same compartment. This highlights a previously unrecognized role for SAHA in regulating selective cargo sorting into vesicles, potentially reshaping the tumor microenvironment. Regardless of whether this is traceable to waste disposal dynamics or communication means, EV-associated content may influence recipient cells and considering the anti-apoptotic role of BCLAF1, we speculated whether EV-BCLAF1 endows cancer cells with a phenotype refractory to SAHA. Noteworthy, the overall increase in extracellular BCLAF1 did not confer recipient cancer cells with resistance to SAHA treatment. To explain this result, we initially hypothesized a reduction in EV uptake yet the BCLAF1mRNA levels are increased in AML cells treated with EV SAHA, suggesting that the vesicles are internalized by recipient cells and avoid lysosome degradation. Interestingly, treatment with SAHA impaired even BCLAF1gained via EV communication. This effect may result from SAHA’s dual role, whereby it enhances miR-194-5p expression while simultaneously limiting its incorporation into EVs, leading to elevated intracellular miRNA levels which could further restrict the accumulation of BCLAF1.
In addition to our molecules of interest, SAHA significantly modulated the overall miRNA profile and proteomic landscape of Leukemia-derived EVs. Such altered vesicular composition was predicted—and confirmed for some biological functions—not to exacerbate the aggressive phenotype of recipient cancer cells, as demonstrated by our functional analysis. Moreover, SAHA modulated the loading of many factors linked to drug resistance and sensitivity, underscoring a dual role for SAHA who has the potential to limit tumor progression while enhancing therapeutic responsiveness, thereby suggesting new options for potential combinatorial therapies.
Trials exploring the use of SAHA in combination with other drugs are ongoing (NCT00392353, NCT01522976) or concluded (NCT00948064, NCT00875745, NCT00479232, NCT00275080, NCT01550224, NCT01534260), and, despite showing promising results in some early-phase studies, the overall success of these trials varies. Our findings suggest the possibility of testing SAHA in combination with drugs for which trials have not been designed yet. Moreover, previous trials investigated SAHA in combination with other therapeutics, while our results suggest adopting a sequential approach, wherein SAHA is used prior to other drugs. In this regard, pre-treatment with SAHA might directly kill malignant cells meanwhile increasing the efficacy of cisplatin and paclitaxel, due to impaired delivery of actin and HSP90 as well as increased transportation of miR-424-5p via EV SAHA. Similarly, these vesicles have the potential to increase the sensitivity to doxorubicin, because of the unique presence of Cul3 in EV SAHA. Moreover, the ability of SAHA to enhance sensitivity to other treatments could allow for dose reductions, potentially minimizing toxicity-related side effects—one of the leading causes of treatment-associated mortality [47]. Additionally, SAHA pre-treatment may influence the efficacy of cell-based and antibody-based therapies, for instance by upregulating surface antigen expression or attenuating immunosuppressive signaling, thereby increasing tumor susceptibility to both the host immune system and CAR-T cells [48, 49].
These findings highlight SAHA’s potential to modulate the extracellular compartment as part of a broader anti-cancer strategy thereby supporting its potential clinical relevance as a component of combination therapies aimed at overcoming resistance in Leukemia.
Importantly, these predictions were only observed in AML cells, as EV SAHA from CML cells were predicted to enhance some tumor-supportive function. SAHA-induced EVs demonstrated a context-dependent impact also at functional level. In CML, EV SAHA treatment hindered the process of colony formation, while no differences between EV Ctr and EV SAHA were observed in AML cells. These different outcomes may be attributed to the diverse differentiation potential, genetic, epigenetic and molecular background, as well as cell lineage and function of acute versus chronic leukemia cells [50]. Moreover, SAHA also exerted differential effects on EV secretion in AML and CML cells, likely reflecting cell-specific differences invesicle biogenesis pathways or sensitivity to SAHA-induced stress, therefore emphasizing the importance of tailoring therapeutic approaches to specific Leukemia subtype.
In conclusion, SAHA’s effects on leukemic EV secretion and molecular composition, along with its direct cytotoxicity toward tumor cells, support its application as a therapeutic agent, especially in combination regimens customized to specific leukemic subtypes. Our findings provide a speculative yet promising foundation for future research into novel therapeutic strategies, encouraging further investigation into the mechanisms underlying these effects and their potential clinical implications.
Supplementary Information
Additional file 1Additional file 2Additional file 3Additional file 4
The reference list from the paper itself. Each links out to its DOI / PubMed record.
- 1Serafini FL, Lanuti P, Delli Pizzi A, Procaccini L, Villani M, Taraschi AL, et al. Diagnostic impact of radiological findings and extracellular vesicles: are we close to radiovesicolomics? Biology (Basel). 2021;10(12).10.3390/biology 10121265 PMC 869845234943180 · doi ↗ · pubmed ↗
- 2Potenza F, Cufaro MC, Di Biase L, Panella V, Di Campli A, Ruggieri AG, et al. Proteomic Analysis of Marinesco-Sjogren Syndrome Fibroblasts Indicates Pro-Survival Metabolic Adaptation to SIL 1 Loss. Int J Mol Sci. 2021;22(22).10.3390/ijms 222212449 PMC 862050734830330 · doi ↗ · pubmed ↗
- 3Battula VL, Le PM, Sun JC, Nguyen K, Yuan B, Zhou X, et al. AML-induced osteogenic differentiation in mesenchymal stromal cells supports leukemia growth. JCI Insight. 2017;2(13).10.1172/jci.insight.90036 PMC 549936528679949 · doi ↗ · pubmed ↗