Prevalence and Factors Associated With Eating Disorder Risk Among College Students in Kerala, India: A Cross-Sectional Study
Swathy Krishna, Jeby Jose Olickal, P Sankara Sarma, Kavumpurathu Raman Thankappan

TL;DR
This study found that nearly one-third of college students in Kerala, India, are at risk for eating disorders, with higher risk among those from high-income groups, underweight or overweight individuals, and those with social media disorder.
Contribution
The study provides the first empirical data on eating disorder risk among college students in Kerala, India, and identifies specific sociodemographic and behavioral risk factors.
Findings
29.4% of students in Kerala were at risk for eating disorders.
High-income students had significantly higher risk compared to lower-income groups.
Social media disorder and weight status (underweight/overweight) were strongly associated with increased ED risk.
Abstract
Introduction Unhealthy diets are a major contributor to the global burden of disease, with eating disorders (EDs) being among the most prevalent psychological disorders affecting youth worldwide. Despite their increasing recognition, there is limited research quantifying ED risk in India. Therefore, we aimed to estimate the risk of ED in the Indian state of Kerala and to find the sociodemographic factors associated with it. Methods We conducted this study among 823 students (females: 60%) aged 18-22 years in randomly selected colleges in two of the 14 districts in Kerala. Data were collected using the self-administered Eating Attitudes Test-26 (EAT-26). Information on social media disorder was collected using the Bergen Social Media Addiction Scale (BSMAS). Log binomial regression analysis was done to find the factors associated with ED risk, and adjusted prevalence ratios (APR) with…
Genes, proteins, chemicals, diseases, species, mutations and cell lines named across the full text — each resolved to its canonical identifier and authoritative record.
Click any figure to enlarge with its caption.
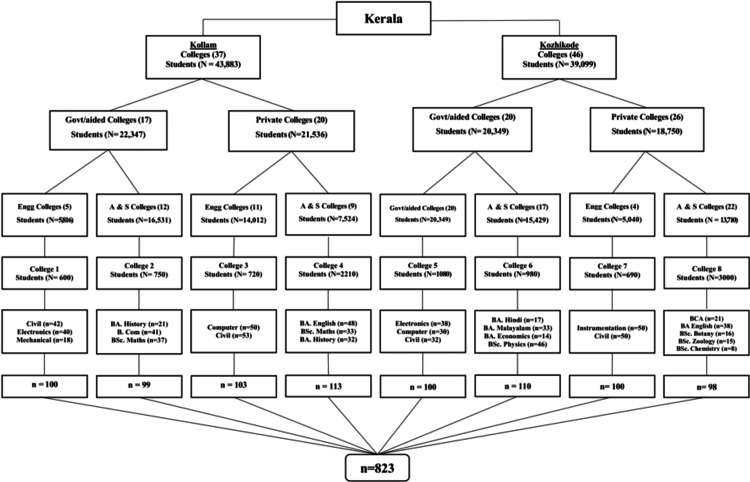 Figure 1
| Variables | n | % |
| Age in years | ||
| 18 | 148 | 18.0 |
| 19 | 204 | 24.8 |
| 20 | 225 | 27.3 |
| 21 | 114 | 13.9 |
| 22 | 132 | 16.0 |
| Gender | ||
| Male | 327 | 39.7 |
| Female | 496 | 60.3 |
| College | ||
| Government | 310 | 37.7 |
| Aided | 99 | 12.0 |
| Private | 414 | 50.3 |
| Course | ||
| B.Tech | 403 | 49.0 |
| Arts and Science | 420 | 51.0 |
| District | ||
| Kozhikode | 408 | 49.6 |
| Kollam | 415 | 50.4 |
| Social-class* | ||
| Class 1 (³₹9,098) | 251 | 30.5 |
| Class 2 (₹4,549-9,097) | 235 | 28.5 |
| Class 3 (₹2,729-4,548) | 142 | 17.3 |
| Class 4 (₹1,364-2,728) | 147 | 17.9 |
| Class 5 | 48 | 5.8 |
| Place of stay | ||
| Home | 607 | 73.8 |
| Hostel | 158 | 19.2 |
| Paying guest | 58 | 7.0 |
| Marital status | ||
| Married | 18 | 2.2 |
| Unmarried | 805 | 97.8 |
| Religion | ||
| Hindu | 441 | 53.6 |
| Muslim | 235 | 28.5 |
| Christian | 144 | 17.5 |
| Others§ | 3 | 0.4 |
| Sibling status | ||
| Yes | 732 | 88.9 |
| No | 91 | 11.1 |
| Body mass index (BMI) † | ||
| Underweight (<18.5 kg/m2) | 233 | 28.3 |
| Normal (18.5-24.9 kg/m2) | 465 | 56.5 |
| Overweight (25-29.9 kg/m2) | 98 | 11.9 |
| Obese (30 kg/m2 and above) | 27 | 3.3 |
| Variables | n | % |
| Follow social media accounts that promote restaurants | 471 | 57.2 |
| Social media posts influence what you choose to eat in a day | 290 | 35.2 |
| Interested in food-related posts shared on social media and consume that food | 620 | 75.3 |
| Fast food consumption increased after starting social media use | 352 | 42.8 |
| Use social media for body fitness | 473 | 57.5 |
| Variables | n | ED Risk | No ED Risk | χ2 value | P-value |
| n (%) | n (%) | ||||
| ED | 823 | 242 (29.4) | 581 (70.6) | ||
| Age in years | |||||
| 18 | 148 | 44 (29.7) | 104 (70.3) | 2.12 | 0.713 |
| 19 | 204 | 62 (30.4) | 142 (69.6) | ||
| 20 | 225 | 70 (31.1) | 155 (68.9) | ||
| 21 | 114 | 34 (29.8) | 80 (70.2) | ||
| 22 | 132 | 32 (24.2) | 100 (75.8) | ||
| Gender | |||||
| Female | 496 | 149 (30.0) | 347 (70.0) | 0.248 | 0.622 |
| Male | 327 | 93 (28.4) | 234 (71.6) | ||
| Course | |||||
| B. Tech | 403 | 126 (31.3) | 277 (68.7) | 1.32 | 0.251 |
| Arts and science | 420 | 116 (27.6) | 304 (72.4) | ||
| District | |||||
| Kollam | 415 | 131 (31.6) | 284 (68.4) | 1.88 | 0.170 |
| Kozhikode | 408 | 111 (27.2) | 297 (72.8) | ||
| Social-class | |||||
| Class 1 | 251 | 141 (56.2) | 110 (43.8) | 155.26 | <0.001 |
| Class 2 | 235 | 69 (29.4) | 166 (70.6) | ||
| Class 3 | 142 | 22 (15.5) | 120 (84.5) | ||
| Class 4 & 5 | 195 | 10 (5.1) | 185 (94.9) | ||
| Place of stay | |||||
| Home | 607 | 192 (31.6) | 415 (68.4) | 5.52 | 0.019 |
| Hostel/ Paying guest | 216 | 50 (23.1) | 166 (76.8) | ||
| Marital status | |||||
| Married | 18 | 9 (50.0) | 9 (50.0) | 3.76 | 0.052 |
| Unmarried | 805 | 233 (28.9) | 572 (71.1) | ||
| Religion | |||||
| Muslim | 235 | 74 (31.5) | 161 (68.5) | 1.08 | 0.582 |
| Christian/others* | 147 | 45 (30.6) | 102 (69.4) | ||
| Hindu | 441 | 123 (27.9) | 318 (72.1) | ||
| Sibling status | |||||
| No | 91 | 32 (35.2) | 59 (64.8) | 0.163 | 0.200 |
| Yes | 732 | 210 (28.7) | 522 (71.3) | ||
| Body Mass Index (BMI) | |||||
| Underweight | 233 | 68 (29.2) | 165 (70.8) | 108.65 | <0.001 |
| Overweight/ Obese | 125 | 84 (67.2) | 41 (32.8) | ||
| Normal | 465 | 90 (19.4) | 375 (80.7) | ||
| Social Media Disorder (SMD) | |||||
| SMD | 38 | 21 (55.3) | 17 (44.7) | 12.83 | <0.001 |
| Normal | 785 | 221 (28.2) | 564 (71.9) | ||
| Variables | APR (95% CI) | P-value | |
| District | |||
| Kollam | 1.05 (0.87-1.29) | 0.570 | |
| Kozhikode | 1 | - | |
| Social class | |||
| Class 1 | 9.54 (5.11-17.84) | <0.001 | |
| Class 2 | 5.51 (2.90-10.47) | <0.001 | |
| Class 3 | 3.17 (1.54-6.53) | 0.002 | |
| Class 4 & 5 | - | - | |
| Place of stay | |||
| Home | 1.40 (1.08-1.80) | 0.001 | |
| Hostel/Paying guest | - | - | |
| Marital status | |||
| Married | 1.18 (0.82-1.70) | 0.390 | |
| Unmarried | - | - | |
| Sibling status | |||
| No | 1.09 (0.84-1.42) | 0.518 | |
| Yes | - | - | |
| Body Mass Index (BMI) | |||
| Underweight | 1.61 (1.25-2.06) | <0.001 | |
| Overweight/Obese | 2.43 (1.96-3.02) | <0.001 | |
| Normal | - | - | |
| Social Media Disorder (SMD) | |||
| SMD | 1.67 (1.26-2.22) | <0.001 | |
| Normal | - | - | |
Peer Reviews
No public reviews on file for this paper yet. If you reviewed it on a platform where reviews are public (OpenReview, ICLR, NeurIPS, ICML), you can paste yours below so the community can read it here.
Videos
No videos yet. Explain this paper in a talk, walkthrough, or lecture? Add one.
Taxonomy
TopicsEating Disorders and Behaviors · Obesity, Physical Activity, Diet · Obesity and Health Practices
Introduction
Unhealthy diets are a significant contributor to the global burden of disease, with dietary risk factors accounting for 11 million deaths and 255 million disability-adjusted life years (DALYs) in 2017 [1]. Eating disorders (EDs) disrupt healthy eating patterns [2]. An ED is defined as any disorder characterized primarily by a pathological disturbance of attitudes and behaviors related to food, including anorexia nervosa (AN), bulimia nervosa (BN), and binge-eating disorder (BED) [3]. EDs are among the most common psychological disorders affecting the youth worldwide [4]. According to the Global Burden of Diseases Study, an estimated 13.6 million people, equivalent to 176.2 per 100,000, had AN or BN in 2019. Additionally, a study by Santomauro et al. estimated 41.9 million prevalent cases of BED and other specified feeding or eating disorders (OSFED) globally in 2019, equivalent to 541.1 per 100,000 people [4].
Sociodemographic factors, such as age, gender, and socioeconomic status significantly influence the risk of developing EDs. For example, females and adolescents are particularly vulnerable [5,6]. Similarly, cultural and racial pressures, combined with low self-esteem and high body image preoccupation, further exacerbate susceptibility [7]. Social media use has also been linked to an increased risk of EDs, as platforms such as Instagram and TikTok often promote unrealistic body ideals, leading to body dissatisfaction and disordered eating behaviors [8,9]. The frequent exposure to appearance-focused content and engagement in social comparison intensify these risks, particularly among adolescents and young adults. Additionally, social media platforms expose children and adolescents to various forms of food marketing, most of which promote unhealthy food choices [10].
Compared to other Indian states, Kerala is in a more advanced stage of epidemiological transition [11]. This is evident from the finding that the proportion of total disease burden from non-communicable diseases (NCDs) in Kerala is 74.6% in the age group of 15-69 years, which is higher than in other Indian states. Research on EDs in India is limited, with a few studies examining associated risk factors and the influence of social media. For instance, a study conducted in Mysore in the neighboring state of Karnataka found that 26.06% of students exhibited abnormal eating attitudes, indicating a significant prevalence of EDs among university students [12]. However, this study did not extensively explore the socio-demographic factors contributing to these disorders. There have been no studies conducted in Kerala on EDs, leaving a gap in understanding their prevalence and associated factors in this unique socio-cultural context. Therefore, this study aimed to estimate the risk of EDs among college students aged 18-22 years in Kerala and to find the sociodemographic factors associated with the risk of EDs.
Materials and methods
Study design
This study was a college-based cross-sectional study.
Study setting
Kerala is the 21st largest Indian state, with 14 districts and a population of 33 million as per census 2011. This study was conducted in selected colleges from two districts: Kollam in the South and Kozhikode in the north of Kerala. Government colleges, colleges run by private management with financial support from the government (aided colleges), and private arts and science and engineering colleges with no financial aid from the government were included. No routine health campaigns have been conducted in these selected colleges to promote healthy dietary habits in students in the post-COVID period.
Study population
Students aged 18-22 years pursuing arts and science or engineering courses in Kollam and Kozhikode districts are included.
Study duration
The study duration was eight months from November 2023 to May 2024. The data collection period was from February 15, 2024, to April 15, 2024.
Sample size
The sample size was estimated assuming the proportion of college students at risk of EDs as 26.06% [12], with 5% absolute precision and a design effect of two; the calculated sample size for the study was 592. The sample size was calculated using Open Epi Version 3.01 (version 7.1.5; Centers for Disease Control and Prevention, Atlanta, GA). After considering a non-response rate of 20%, the final sample size for the study was 740. However, we have included all the students from the selected clusters (class divisions), and the final sample size used for the analysis was 823.
Sampling technique
Among the 14 districts in Kerala, two districts (Kollam and Kozhikode) were randomly selected from the seven Southern and seven Northern districts of Kerala. In Kollam, 22,347 students were enrolled in government colleges, including aided colleges, and 21,536 students in private colleges. In Kozhikode, 20,349 students were enrolled in government colleges, including aided colleges, and 18,750 students in private colleges. From each district, two arts and science and two engineering colleges, both of government/aided and private sector, were selected by a simple random sampling (lottery method). The class divisions were selected from the colleges chosen using a computer-generated simple random sampling method. All the students present in the classroom during the data collection were included. The detailed sample selection technique is given in Figure 1.
Flowchart depicting the selection of study participants
Study tools
A self-administered structured and validated questionnaire was used. The ED risk was assessed by the Eating Attitudes Test-26 (EAT-26) questionnaire. The questionnaire was originally developed and validated by Garner et al. [13]. Permission to use EAT-26 was obtained from Dr. David M. Garner, the original author. The full questionnaire is provided in the appendix. This is a 26-item scale, with each item answered on a six-point Likert scale ranging from “never” to “always.” The most symptomatic response is assigned a score of three, the next most symptomatic response a score of two, and the least symptomatic a score of one. The remaining three choices are assigned a score of zero. Total scores are derived as a sum of the composite items, ranging from zero to 78, with the 26th question reverse scored. Scores greater than 20 indicated abnormal eating attitudes and behaviors and were considered to have a risk of ED.
To assess social media disorder (SMD), a validated six-item scale, the Bergen Social Media Addiction Scale (BSMAS), was used. The BSMAS is reproduced from Andreassen et al. [14] with proper attribution. The scale is freely available for academic research purposes. No additional permissions were required for its use in this study. The BSMAS is freely accessible, and it has been used in studies conducted previously in India. The scale uses a five-point Likert scale, ranging from one (very rarely) to five (very often). A score of 24 and above was used as a clinical cut-off point for SMD.
Procedure of data collection
Permission from the higher officials of each college was sought before data collection. Questionnaires were distributed to the students of the selected class divisions, and a brief explanation of the purpose of the study was given. It took about 20-30 minutes to complete the data collection in each class division.
Independent and outcome variables
The independent variables were age, gender (male, female, transgender), marital status (married or unmarried), social class (I/higher income group, II, III, IV, V/lowest income group based on revised BG Prasad's classification 2024) [15], religion (Hindu, Christian, Muslim, or others), course pursuing (engineering and arts & science courses such as B Com, BA, and other BSc and MSc courses), self-reported weight and height, and SMD. The outcome variable was the risk of ED (Yes/No).
Ethical considerations
A written informed consent was obtained before distributing the questionnaires. Participants were informed that participation in the study was voluntary and that their responses would be treated with the strictest confidence. No sensitive personal data were collected from the participants.
Statistical analysis
The collected data were entered into EpiData Version 4, and the statistical analyses were performed using STATA Version 14 (StataCorp LLC, College Station, TX). The categorical variables, such as gender, course pursued in college, type of college, sibling status, place of stay, religion, marital status, and socioeconomic class, were summarized as frequencies and percentages. The continuous variables such as age, monthly household income, duration of daily social media use, and SMD were summarized as mean (SD). The prevalence of ED risk was calculated with 95% confidence intervals (CI). The factors associated with ED risk were assessed using the chi-squared test. Variables with a p-value of less than 0.2 in the bivariate analysis were included in the multivariable analysis using a log-binomial model to estimate the adjusted PR (APR) with 95% CI. A p-value less than 0.05 was considered statistically significant.
Results
Of the 823 participants, nearly two-fifths (n=327, 39.7%) were males and the mean (SD) age was 19.8 (1.3) years. Table 1 depicts the sociodemographic characteristics of the participants. An equal number of students from government/aided and private colleges have participated. Of the total sample, 415 (50.4%) were from Kollam districts, and 805 (97.8%) students were unmarried. About four-fifths (n=607, 73.5%) of the students were coming from home, 732 (89%) students had siblings, and about 125 (15%) were overweight or obese.
Table 2 shows the participants' eating behaviors related to social media use. Three-fourths (n=620, 75.3%) were interested in watching food-related social media posts. More than half of the participants used social media to follow accounts that promote restaurants (n=471, 57.2%) and body fitness (n=473, 57.5%), and 352 (42.8%) reported an increase in fast-food consumption after they started using social media.
Item-wise response to the EAT-26 questionnaire is provided in the appendix. A significant proportion of respondents reported never experiencing behaviors associated with disordered eating, particularly vomiting after meals (521, 63.30%) and feeling that food controls their lives (285, 34.63%). However, a notable percentage often or sometimes exhibited a preoccupation with food (157, 19.08%; 228, 27.70%, respectively), calorie awareness (116, 14.09%; 160, 19.44%), and dieting behaviors (153, 18.59%; 162, 19.68%). Some respondents also expressed concern about body weight, with 328 (39.85%) never being occupied with a desire to be thinner, while 129 (15.67%) often and 173 (21.02%) sometimes worried about body fat. The highest always response was for enjoying trying new rich foods (146, 17.74%).
The prevalence of the risk of ED among young adults was 29.4% (n=242, 95% CI: 26.3-32.6). Table 3 presents the bivariate analysis of sociodemographic factors and social media usage associated with the risk of EDs. Social class, place of stay, BMI, and SMD were significantly associated with ED risk.
Table 4 presents the log-binomial regression analysis of sociodemographic factors and social media usage associated with the risk of EDs. Compared to respondents staying in hostels or as paying guests, those staying at home were 1.40 times more likely to report an ED risk (APR = 1.40; 95% CI: 1.08-1.80; p = 0.010). Similarly, those in social class I (APR = 9.60; 95% CI: 5.11-18.04; p < 0.001), class II (APR = 5.51; 95% CI: 2.89-10.47; p < 0.001), and class III (APR = 3.18; 95% CI: 1.54-6.56; p = 0.002) were at significantly higher risk. Underweight individuals (APR = 1.60; 95% CI: 1.24-2.05; p < 0.001) and those who were overweight or obese (APR = 2.42; 95% CI: 1.96-3.01; p < 0.001) also showed an elevated risk. Additionally, individuals with social media disorder were 1.69 times more likely to develop an ED risk (APR = 1.69; 95% CI: 1.27-2.24; p < 0.001).
Table 4: Sociodemographic and social media usage factors associated with the risk of ED: Log binomial regression analysis results (n=823)ED=eating disorder, APR=adjusted prevalence ratio*Variables that had a p-value < 0.2 in the bivariate analysis are used in the regression model. We assessed how social class and social media disorder interact to influence ED risk. The interaction term (social class × social media disorder) in the model was not significant; therefore, the final model was presented without it.
Discussion
This study investigated the prevalence of the risk of ED and the socio-demographic factors and social media use associated with it among college students aged 18-22 years in Kerala. The results show that the prevalence of the risk of ED among young adults was 29.4%. Similar to our study, research by Nivedita et al. reported the risk of ED among medical students in south India as 26.06% [12]. The sociocultural differences between Kerala and Mysore may contribute to variations in ED prevalence, influenced by factors such as dietary practices, beauty standards, and media exposure. A high level of packaged food consumption was reported in Kerala among adults aged 18-30 years in a study by Haseena et al. [16]. International studies have reported varying ED prevalence rates, with higher rates observed in Western countries where sociocultural emphasis on thinness and body image is more pronounced, while lower prevalence is noted in some Asian countries, possibly due to cultural differences in food attitudes and body perception [17,18]. Although it has been known for some time that EDs pose several health risks, Arcelus et al. in their meta-analysis in 2011 found high mortality rates in patients with EDs. This elevated risk of death was most pronounced among individuals with AN, as evidenced by a weighted annual mortality rate of five per 1,000 person-years [17]. An examination of obesity and EDs by Marcus presented that individuals exhibiting symptoms of disordered eating are especially prevalent among those with higher body weight, regardless of racial/ethnic background, socioeconomic status (SES), age, or severity of obesity [18].
Data from the GBD study suggest that an unhealthy diet is the most important behavioral risk factor for NCDs, accounting for 11 million deaths globally, and India had a significantly higher diet-related death rate compared to high-income countries [1]. Age-standardized mortality rates attributable to a diet low in fiber in 2019 were highest among Southeast Asia regions [19]. Kerala has the highest prevalence of most NCDs among the Indian states; for example, the state has a 25.5% diabetes prevalence, the highest among the major Indian states [20]. The high prevalence of risk of EDs among young adults highlights the critical need for integrated public health initiatives that address the emerging issue of EDs, particularly given that EDs can contribute to the development of NCDs.
The current study found that underweight and overweight individuals have a high risk of ED. These findings must be interpreted with caution; traditionally, EDs were viewed as conditions primarily affecting individuals with low body weight. However, a growing body of evidence now refutes this misconception. The most prevalent EDs, including BED, OSFED, and BN, can manifest across a spectrum of body weights. In addition, EDs represent a significant and growing public health concern, with a particularly concerning rise in prevalence among individuals of higher body weight [21]. For those in social class I, the risk of ED was much higher. This finding of our study is contrary to prior research conducted by Burke et al., which identified that participants from lower SES exhibited a 1.27-fold greater likelihood of screening positive for an ED compared to their higher SES counterparts [22]. The findings from studies exploring socioeconomic factors concerned with EDs vary widely; for instance, no association was found between ED features and in a study by Mulders et al. [23]. Additionally, Nagata et al. stated that lower household income was associated with both BED and binge-eating behavior in household incomes [24]. Most studies reported a null effect of socioeconomic status; however, some studies reported an association with lower socioeconomic status [5].
The results of the present study also demonstrated that the participants with SMD had a high risk of ED. A systematic review by Purba et al. previously reported that young people exposed to health-risk behavior content on social media, particularly marketer-generated content, exhibited a significant increase in unhealthy food consumption compared to adolescents with no such exposure [25]. Additional evidence comes from recent studies showing that young people acquire access to social media platforms at a significantly earlier age compared with the older generations [26]. This makes them more susceptible to social media addiction as they feel more comfortable using social media for communication [27]. Evidence of a possible association between social networking site (SNS) usage and the risk of ED comes from a meta-analysis conducted by Zhang et al. [28]. Notably, Instagram, as a visually driven social media platform, might induce body dissatisfaction and disordered eating mediated by appearance comparison processing through celebrity worship, according to a study by Brown et al. [29]. Additionally, a systematic review done by Holland et al suggested that a limited number of studies showed that social comparison based on appearance mediates the relationship between SNS use and body image and eating concerns [8]. In contrast, a review of reviews conducted by Stiglic et al. reported no or insufficient evidence for an association of screen time with EDs [30].
Similarly, more than half of the participants who used social media in the present study were following accounts that promote restaurants (57.2%) and body fitness (57.5%), and 42.8% reported an increase in fast-food consumption after they started using social media. The findings of this investigation were in line with a meta-analysis done by Zhang et al. [28], which revealed a positive association between excessive use of SNSs and the risk of developing disordered eating behaviors. Furthermore, their analysis indicated a stronger correlation between SNS usage and disordered eating behaviors among university students compared to other populations [28]. Filippone et al.previously reported a correlational relationship between social media time exposure and cognitive impulsivity and demonstrated a cross-sectional relationship between social media time exposure and food craving through an increase in cognitive impulsivity levels [23].
To the best of our knowledge, this is the first study from India looking at the factors associated with ED. However, this research has a few limitations. We included colleges from only two districts (one from the northern districts and another from the southern districts); studies among a larger population may provide better generalizability. Our study did not specifically examine different social media behaviors, such as engagement with body image-focused content. While our findings indicate a significant association between social media disorder and ED risk, the cross-sectional design of this study prevents us from inferring causality. Additionally, the use of self-reported height and weight for BMI calculation may introduce reporting bias, although college students are generally aware of their weight and height. Moreover, response bias and social desirability bias cannot be ruled out, as participants may have underreported or overreported their eating behaviors.
Conclusions
Nearly one-third of the college students were at risk of ED. Students from high-income backgrounds; those who were overweight, obese, or underweight; and those experiencing social media disorder were significantly more likely to report ED risk. The findings emphasize the urgent need for targeted interventions, particularly in high-risk groups, to promote healthy eating behaviors and mental well-being. Given the role of social media in influencing dietary habits, awareness programs addressing the impact of digital exposure on eating attitudes should be integrated into students’ health initiatives. Additionally, routine mental health screenings and accessible support services within educational institutions can help in early identification and management of ED risk. Addressing these factors through a multi-pronged approach involving students, educators, parent teacher associations, and healthcare professionals is crucial in mitigating the growing burden of EDs among young adults.
The reference list from the paper itself. Each links out to its DOI / PubMed record.
- 1Health effects of dietary risks in 195 countries, 1990-2017: a systematic analysis for the Global Burden of Disease study 2017 Lancet Afshin A Sur PJ Fay KA 1958197239320193095430510.1016/S 0140-6736(19)30041-8PMC 6899507 · doi ↗ · pubmed ↗
- 2Evolving food choices among the urban Indian middle-class: a qualitative study Front Nutr Kumar GS Kulkarni M Rathi N 844413920223542579910.3389/fnut.2022.844413 PMC 9001910 · doi ↗ · pubmed ↗
- 3Eating disorders 3 2025 2025 https://www.apa.org/topics/eating-disorders
- 4The hidden burden of eating disorders: an extension of estimates from the Global Burden of Disease study 2019 Lancet Psychiatry Santomauro DF Melen S Mitchison D Vos T Whiteford H Ferrari AJ 320328820213367568810.1016/S 2215-0366(21)00040-7PMC 7973414 · doi ↗ · pubmed ↗
- 5The epidemiology of eating disorders: genetic, environmental, and societal factors Clin Epidemiol Mitchison D Hay PJ 8997620142472813610.2147/CLEP.S 40841 PMC 3933432 · doi ↗ · pubmed ↗
- 6Eating disorders in adolescent boys and young men: an update Curr Opin Pediatr Nagata JM Ganson KT Murray SB 4764813220203252082210.1097/MOP.0000000000000911 PMC 7867380 · doi ↗ · pubmed ↗
- 7Sexual orientation and disordered eating in women: a meta-analysis Eat Weight Disord Dotan A Bachner-Melman R Dahlenburg SC 13252620213179733110.1007/s 40519-019-00824-3 · doi ↗ · pubmed ↗
- 8A systematic review of the impact of the use of social networking sites on body image and disordered eating outcomes Body Image Holland G Tiggemann M 1001101720162699515810.1016/j.bodyim.2016.02.008 · doi ↗ · pubmed ↗