Risk Factors, Trends, and Financial Impact for 30-Day Unplanned Readmissions in Patients Admitted With Myocarditis and COVID-19: Insights From the Healthcare Cost and Utilization Project (HCUP) Nationwide Readmission Database
Dheeraj Kommineni, Priji Prasad Jalaja, Ramakrishna Tumati, Dilip Kumar, Anirban Majumder, Chrishanti Anna Joseph

TL;DR
This study examines the high readmission rates and costs for patients with both myocarditis and COVID-19, identifying risk factors and the need for better post-discharge care.
Contribution
The study provides new insights into the financial and clinical impact of 30-day readmissions for patients with myocarditis and COVID-19.
Findings
17.04% of patients with myocarditis and COVID-19 were readmitted within 30 days, a notably high rate.
Heart failure, chronic kidney disease, and diabetes significantly increase the risk of readmission.
The median cost of initial hospitalization was over USD 56,000, highlighting the financial burden.
Abstract
Background:The coronavirus disease 2019 (COVID-19) outbreak was first documented in Wuhan, China, in December 2019. Myocarditis, an inflammatory condition characterized by swelling and thickening of the heart muscle, has been linked to severe COVID-19 cases, contributing to worse clinical outcomes. The SARS-CoV-2 virus enters human cells through angiotensin-converting enzyme 2 (ACE2), and myocardial involvement can result from direct viral invasion, hyperinflammation, and immune-mediated damage. The exact prevalence of myocarditis among COVID-19 patients remains uncertain due to initial diagnostic limitations. Objective: This study aims to evaluate the risk factors, trends, financial impact, and preventive strategies related to 30-day unplanned hospital readmission in patients diagnosed with both myocarditis and COVID-19. Methodology: A retrospective analysis was conducted using a…
Genes, proteins, chemicals, diseases, species, mutations and cell lines named across the full text — each resolved to its canonical identifier and authoritative record.
Click any figure to enlarge with its caption.
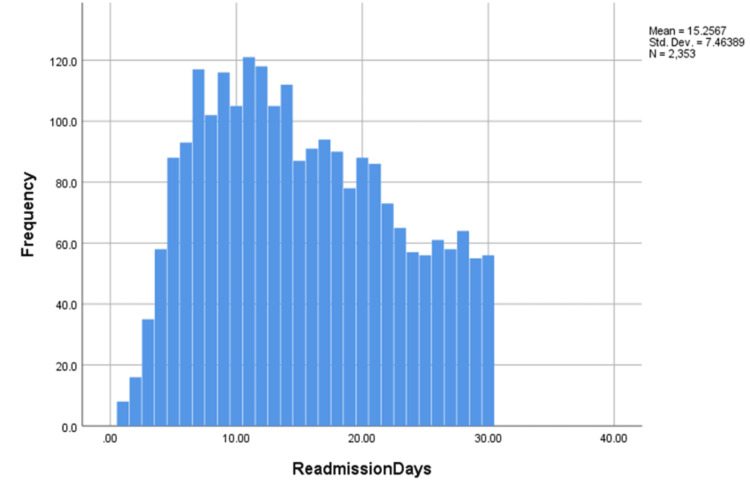 Figure 1
| Characteristics | Total population in study | No readmission (24,275) | 30-day readmission | Test statistic | Effect size | P value |
| (n=28,666) | (n=4,391 (13.1%) | |||||
| Age (in years), median (IQR) | 67.00 (56-78) | 67.00 (56-78) | 67.00 (56-78) | U = 1.2×10⁹ | - | < .001 |
| Women | 9435 (38.9%) | 1487 (33.9%) | 10922 (38.1%) | χ² = 25.6 (df=1) | Phi = 0.03 | < .001 |
| Elective | 482 (2.0%) | 63 (1.4%) | 545 (1.9%) | χ² = 5.9 (df=1) | Phi = 0.02 | 0.015 |
| Weekend admission | 6036 (24.9%) | 1150 (26.2%) | 7186 (25.1%) | χ² = 3.5 (df=1) | Phi = 0.01 | 0.063 |
| Insurance status | - | - | - | χ² = 120.4 (df=5) | Cramer’s V = 0.05 | < .001 |
| Medicare | 14747 (60.9%) | 2959 (67.5%) | 17706 (61.9%) | - | - | - |
| Medicaid | 3137 (13.0%) | 635 (14.5%) | 3772 (13.2%) | - | - | - |
| Private | 4947 (20.4%) | 590 (13.5%) | 5537 (19.4%) | - | - | - |
| Self-pay | 608 (2.5%) | 84 (1.9%) | 692 (2.4%) | - | - | - |
| No charge | 70 (0.3%) | <10 (0.1%) | 76 (0.3%) | - | - | - |
| Other | 711 (2.9%) | 110 (2.5%) | 821 (2.9%) | - | - | |
| Cost of hospitalization in US$, median (IQR) | 56480.37 (56433.13-56930.00) | - | - | U = 8.9×10⁸ | - | < .001 |
| LOS, median (IQR) | 7 days (6-7) | 6 days (6-7) | 7 days (6-7) | U = 1.0×10⁹ | - | - |
| Quartile of median household income | - | - | - | χ² = 15.2 (df=3) | Cramer’s V = 0.02 | < .001 |
| 0-25th | 8823 (36.7%) | 1687 (38.8%) | 10510 (37.0%) | - | - | - |
| 26th-50th | 6857 (28.5%) | 1253 (28.8%) | 8110 (28.6%) | - | - | - |
| 51st-75th | 4847 (20.2%) | 859 (19.8%) | 5706 (20.1%) | - | - | - |
| 76th-100th | 3511 (14.6%) | 549 (12.6%) | 4060 (14.3%) | - | - | - |
| APRDRG-SOI, likelihood of dying | - | - | - | χ² = 11.3 (df=3) | Cramer’s V = 0.02 | 0.01 |
| Minor | 17 (0.1%) | <10 (0.1%) | 20 (0.1%) | - | - | - |
| Moderate | 616 (2.5%) | 66 (1.5%) | 682 (2.4%) | - | - | - |
| Major | 12465 (51.3%) | 2263 (51.5%) | 14728 (51.4%) | - | - | - |
| Extreme | 11177 (46.0%) | 2060 (46.9%) | 13237 (46.2%) | - | - | - |
| APRDRG-SOI, loss of function | - | - | - | χ² = 2.7 (df=3) | Cramer’s V = 0.01 | 0.419 |
| Minor (includes cases with no comorbidity or complications) | 10 (0.0%) | <10 (0.1%) | 16 (0.1%) | - | - | - |
| Moderate | 264 (1.1%) | 29 (0.7%) | 293 (1.0%) | - | - | - |
| Major | 13559 (55.9%) | 2414 (55.0%) | 15973 (55.7%) | - | - | - |
| Extreme | 10442 (43.0%) | 1942 (44.2%) | 12384 (43.2%) | - | - | - |
| Hospital bed size | - | - | - | χ² = 3.8 (df=2) | Cramer’s V = 0.01 | 0.151 |
| Small | 4555 (18.8%) | 823 (18.7%) | 5378 (18.8%) | - | - | - |
| Medium | 6137 (25.3%) | 1162 (26.5%) | 7299 (25.5%) | - | - | - |
| Large | 13583 (56.0%) | 2407 (54.8%) | 15990 (55.8%) | - | - | - |
| Control/ownership of hospital | - | - | - | χ² = 45.1 (df=2) | Cramer’s V = 0.04 | < .001 |
| Government | 2653 (9.3%) | 483 (1.7%) | 3136 (10.9%) | - | - | - |
| Private non-profit | 18601 (76.6%) | 3247 (73.9%) | 21848 (76.2%) | - | - | - |
| Private for-profit | 3021 (12.4%) | 661 (15.1%) | 3682 (12.8%) | - | - | - |
| Hospital designation | - | - | - | χ² = 12.9 (df=3) | Cramer’s V = 0.02 | 0.004 |
| Large metropolitan, ≥1 million residents | 14076 (58.0%) | 2627 (59.8%) | 16703 (58.3%) | - | - | - |
| Small metropolitan, ≤1 million residents | 8194 (33.8%) | 1426 (32.5%) | 9620 (33.6%) | - | - | - |
| Micropolitan | 1617 (6.7%) | 288 (6.6%) | 1905 (6.6%) | - | - | - |
| Non-urban residual | 390 (1.6%) | 50 (1.1%) | 440(1.5%) | - | - | - |
| Hospital teaching status | - | - | - | - | - | - |
| Metropolitan, non-teaching | 4112 (16.9%) | 878 (20.0%) | 4990 (17.4%) | - | - | - |
| Metropolitan, teaching | 18157 (74.8%) | 3175 (72.3%) | 21332 (74.4%) | - | - | - |
| Non-metropolitan | 2006 (8.3%) | 338 (7.7%) | 2344 (8.2%) | - | - | - |
| Discharge location | - | - | - | χ² = 120.7 (df=4) | Cramer’s V = 0.05 | < .001 |
| Home self-care | 11749 (48.4%) | 1972 (44.9%) | 13721 (47.9%) | - | - | - |
| Home healthcare | 347 (1.4%) | 63 (1.4%) | 410 ((1.4%) | - | - | - |
| Transfer to short-term hospital | 6764 (27.9%) | 1213 (27.6%) | 7977 (27.8%) | - | - | - |
| Transfer to other care facility | 5043 (20.8%) | 1000 (22.8%) | 6043 (21.1%) | - | - | - |
| Against medical advice | 335 (1.4%) | 144 (3.3%) | 479 (1.7%) | - | - | - |
| Comorbidities | Total (n=28,666) | No readmission (n=24,275) | 30-day readmission (n=4,391) | Test statistic | Effect size | P value |
| Acute MI | 3,591 (12.5%) | 3,027 (12.5%) | 564 (12.8%) | χ² = 0.5 (df=1) | Phi = 0.004 | 0.489 |
| Tobacco abuse | 7 (0.0%) | 7 (0.0%) | 0 (0.0%) | Fisher’s exact test† | — | 0.605† |
| Alcohol abuse | 911 (3.2%) | 733 (3.0%) | 178 (4.1%) | χ² = 15.2 (df=1) | Phi = 0.02 | <0.001 |
| Lipid disorders | 14,933 (52.1%) | 12,621 (52.0%) | 2,312 (52.6%) | χ² = 0.6 (df=1) | Phi = 0.005 | 0.431 |
| Hypertension (HTN) | 4,496 (15.7%) | 3,996 (16.5%) | 500 (11.4%) | χ² = 45.1 (df=1) | Phi = 0.04 | <0.001 |
| Diabetes | 13,395 (46.7%) | 11,140 (45.9%) | 2,255 (51.3%) | χ² = 32.7 (df=1) | Phi = 0.03 | <0.001 |
| Obesity | 7,849 (27.4%) | 6,709 (27.6%) | 1,140 (26.0%) | χ² = 5.2 (df=1) | Phi = 0.02 | 0.023 |
| Heart failure | 20,288 (70.8%) | 16,899 (69.6%) | 3,389 (77.2%) | χ² = 85.7 (df=1) | Phi = 0.06 | <0.001 |
| Chronic lung disease | 18,757 (65.4%) | 15,859 (65.3%) | 2,898 (66.0%) | χ² = 0.7 (df=1) | Phi = 0.005 | 0.408 |
| Acute kidney injury (AKI) | 11,312 (39.5%) | 9,571 (39.4%) | 1,741 (39.6%) | χ² = 0.07 (df=1) | Phi = 0.002 | 0.789 |
| Chronic kidney disease (CKD) | 11,448 (39.9%) | 9,242 (38.1%) | 2,206 (50.2%) | χ² = 210.3 (df=1) | Phi = 0.09 | <0.001 |
| Non-cardiac chest pain | 504 (1.8%) | 397 (1.6%) | 107 (2.4%) | χ² = 14.2 (df=1) | Phi = 0.02 | <0.001 |
| Valvular heart disease | 2,147 (7.5%) | 1,743 (7.2%) | 404 (9.2%) | χ² = 22.4 (df=1) | Phi = 0.03 | <0.001 |
| Cerebrovascular accident (CVA) | 602 (2.1%) | 526 (2.2%) | 76 (1.7%) | χ² = 3.3 (df=1) | Phi = 0.01 | 0.069 |
| Transient ischemic attack (TIA) | 85 (0.3%) | 73 (0.3%) | 12 (0.3%) | χ² = 0.02 (df=1) | Phi = 0.003 | 0.88 |
| Peripheral arterial disease (PAD) | 1,229 (4.3%) | 1,019 (4.2%) | 210 (4.8%) | χ² = 3.1 (df=1) | Phi = 0.01 | 0.08 |
| Pulmonary circulatory disorders | 2,887 (10.1%) | 2,348 (9.7%) | 539 (12.3%) | χ² = 25.4 (df=1) | Phi = 0.03 | <0.001 |
| GI bleed | 994 (3.5%) | 811 (3.3%) | 183 (4.2%) | χ² = 7.4 (df=1) | Phi = 0.02 | 0.007 |
| Thyroid disorders | 4,204 (14.7%) | 3,557 (14.7%) | 647 (14.7%) | χ² = 0.02 (df=1) | Phi = 0.003 | 0.891 |
| Fluid/electrolyte disorders | 16,028 (55.9%) | 13,605 (56.0%) | 2,423 (55.2%) | χ² = 1.2 (df=1) | Phi = 0.01 | 0.283 |
| Coagulation disorders | 4,546 (15.9%) | 3,863 (15.9%) | 683 (15.6%) | χ² = 0.3 (df=1) | Phi = 0.004 | 0.559 |
| Depression | 3,270 (11.4%) | 2,699 (11.1%) | 571 (13.0%) | χ² = 20.7 (df=1) | Phi = 0.03 | <0.001 |
| Dementia/neurocognitive disorders | 3,624 (12.6%) | 3,045 (12.5%) | 579 (13.2%) | χ² = 1.4 (df=1) | Phi = 0.01 | 0.246 |
| Cancer | 1,728 (6.0%) | 1,427 (5.9%) | 301 (6.9%) | χ² = 6.0 (df=1) | Phi = 0.02 | 0.014 |
| Shock | 1,455 (5.1%) | 1,240 (5.1%) | 215 (4.9%) | χ² = 0.3 (df=1) | Phi = 0.004 | 0.574 |
| Cardiogenic shock | 28,666 (100.0%) | 24,275 (100.0%) | 4,391 (100.0%) | — | — | — |
| Cardiac arrest | 445 (1.6%) | 388 (1.6%) | 57 (1.3%) | χ² = 2.1 (df=1) | Phi = 0.01 | 0.147 |
| Cardiac dysrhythmias | 13,268 (46.3%) | 11,004 (45.3%) | 2,264 (51.6%) | χ² = 85.7 (df=1) | Phi = 0.06 | <0.001 |
| Conduction disorders | 2,983 (10.4%) | 2,578 (10.6%) | 405 (9.2%) | χ² = 7.8 (df=1) | Phi = 0.02 | 0.005 |
| Pericardial complications | 720 (2.5%) | 627 (2.6%) | 93 (2.1%) | χ² = 3.1 (df=1) | Phi = 0.01 | 0.077 |
| Pericardiocentesis | 26 (0.1%) | 23 (0.1%) | <10 (0.1%) | Fisher’s exact test† | — | 0.788† |
| Pericardial window | <10 (0.0%) | <10 (0.0%) | <10 (0.0%) | Fisher’s exact test† | — | 0.372† |
| Variable | OR (95% CI) | Wald χ² (df) | Effect size (OR) | P value |
| Sex | ||||
| - Male | 1 (Reference) | — | — | — |
| - Female | 0.806 (0.750–0.866) | 28.5 (1) | Moderate | <0.001 |
| Insurance status | ||||
| - Medicaid | 1 (Reference) | — | — | — |
| - Medicare | 0.999 (0.902–1.107) | 0.001 (1) | Negligible | 0.991 |
| - Private insurance | 0.685 (0.605–0.776) | 25.8 (1) | Moderate | <0.001 |
| - Self-pay | 0.733 (0.572–0.939) | 6.1 (1) | Small | 0.014 |
| - No charge | 0.442 (0.190–1.027) | 3.6 (1) | Small | 0.058 |
| - Other | 0.807 (0.646–1.008) | 3.5 (1) | Small | 0.059 |
| Median household income | ||||
| - 1–1–39,999 | 1 (Reference) | — | — | — |
| - 40,000–40,000–50,999 | 0.993 (0.915–1.078) | 0.03 (1) | Negligible | 0.865 |
| - 51,000–51,000–65,999 | 0.970 (0.884–1.065) | 0.4 (1) | Negligible | 0.526 |
| - ≥$66,000 | 0.838 (0.751–0.935) | 9.6 (1) | Small | 0.002 |
| Elective admission | ||||
| - Non-elective | 1 (Reference) | — | — | — |
| - Elective | 0.744 (0.569–0.974) | 4.7 (1) | Small | 0.031 |
| Weekend admission | ||||
| - Not a weekend | 1 (Reference) | — | — | — |
| - Weekend | 1.091 (1.013–1.176) | 5.2 (1) | Small | 0.021 |
| Likelihood of dying | ||||
| - Minor | 1 (Reference) | — | — | — |
| - Moderate | 2.068 (0.293–14.591) | 0.5 (1) | Negligible | 0.466 |
| - Major | 2.506 (0.351–17.890) | 0.8 (1) | Negligible | 0.36 |
| - Extreme | 2.444 (0.341–17.502) | 0.8 (1) | Negligible | 0.374 |
| Severity of illness | ||||
| - Minor | 1 (Reference) | — | — | — |
| - Moderate | 0.126 (0.024–0.655) | 6.1 (1) | Small | 0.014 |
| - Major | 0.201 (0.040–1.016) | 3.8 (1) | Small | 0.052 |
| - Extreme | 0.209 (0.041–1.058) | 3.5 (1) | Small | 0.059 |
| Hospital bed size | ||||
| - Small | 1 (Reference) | — | — | — |
| - Medium | 1.035 (0.937–1.144) | 0.5 (1) | Negligible | 0.499 |
| - Large | 0.958 (0.876–1.048) | 0.9 (1) | Negligible | 0.349 |
| Hospital ownership | ||||
| - Government | 1 (Reference) | — | — | — |
| - Private non-profit | 0.916 (0.823–1.020) | 2.6 (1) | Negligible | 0.11 |
| - Private for-profit | 1.133 (0.992–1.295) | 3.4 (1) | Small | 0.066 |
| Hospital designation | ||||
| - Large metropolitan | 1 (Reference) | — | — | — |
| - Small metropolitan | 0.901 (0.838–0.970) | 7.6 (1) | Small | 0.006 |
| - Micropolitan | 0.919 (0.799–1.057) | 1.4 (1) | Negligible | 0.236 |
| - Non-urban residual | 0.675 (0.497–0.917) | 6.3 (1) | Small | 0.012 |
| Discharge location | ||||
| - Home self-care | 1.038 (0.785–1.371) | 0.07 (1) | Negligible | 0.794 |
| - Home healthcare | 0.902 (0.825–0.987) | 5.1 (1) | Small | 0.024 |
| - Transfer to short-term hospital | 1.074 (0.983–1.174) | 2.5 (1) | Negligible | 0.113 |
| - Transfer to other facility | 2.207 (1.791–2.719) | 45.2 (1) | Large | <0.001 |
| Comorbidities | ||||
| - Acute MI | 1.043 (0.942–1.156) | 0.7 (1) | Negligible | 0.417 |
| - Alcohol abuse | 1.346 (1.130–1.605) | 11.3 (1) | Small | 0.001 |
| - Chronic kidney disease (CKD) | 1.495 (1.388–1.609) | 85.4 (1) | Large | <0.001 |
Peer Reviews
No public reviews on file for this paper yet. If you reviewed it on a platform where reviews are public (OpenReview, ICLR, NeurIPS, ICML), you can paste yours below so the community can read it here.
Videos
No videos yet. Explain this paper in a talk, walkthrough, or lecture? Add one.
Taxonomy
TopicsCOVID-19 and healthcare impacts · Heart Failure Treatment and Management · COVID-19 Clinical Research Studies
Introduction
Myocarditis, an inflammatory condition of the myocardium, is a clinically significant disorder that can result in severe cardiac complications, including arrhythmias, cardiogenic shock, and heart failure [1]. It is often triggered by viral infections, autoimmune disorders, or drug reactions, with viral myocarditis being one of the most common causes [2]. The emergence of COVID-19 has introduced new complexities in the epidemiology and management of myocarditis, as growing evidence suggests that SARS-CoV-2 infection can lead to direct myocardial injury, inflammation, and subsequent dysfunction [3]. While some studies have provided clinical evidence of COVID-19-associated myocarditis in hospitalized patients, large-scale clinical trials validating its exact prevalence and mechanisms remain limited. Studies have demonstrated that myocarditis in COVID-19 patients can occur due to several mechanisms, including direct viral invasion of cardiac myocytes, hyperinflammatory responses, and microvascular thrombosis, all of which contribute to increased morbidity and mortality [4]. These mechanisms may result in persistent myocardial dysfunction and residual inflammation, increasing the likelihood of hospital readmission. Given these pathophysiological factors, patients hospitalized with myocarditis, particularly in the setting of COVID-19, may experience a higher risk of complications and hospital readmissions [5].
Hospital readmission within 30 days of discharge is widely recognized as an important healthcare quality metric, reflecting the effectiveness of inpatient care, post-discharge follow-up, and overall disease management [6]. Unplanned readmissions not only pose a significant burden on patients by increasing the likelihood of further complications but also place a strain on healthcare resources, leading to higher costs for both hospitals and insurance providers [7]. In cardiovascular diseases, several factors such as older age, multiple comorbidities, severity of the initial illness, and inadequate transitional care contribute to early readmissions [8]. However, transitional care for myocarditis patients remains suboptimal due to the lack of standardized post-discharge protocols and outpatient follow-up limitations. While extensive research has been conducted on readmission trends in heart failure, acute coronary syndromes, and arrhythmias, myocarditis readmissions have not been widely studied as a benchmark for care quality, making this study a novel contribution to the literature [9]. Understanding the specific risk factors driving 30-day unplanned readmissions in this population is crucial for developing targeted interventions that can improve patient outcomes and reduce healthcare expenditures [10].
The Healthcare Cost and Utilization Project (HCUP) Nationwide Readmission Database (NRD) provides a comprehensive dataset to analyze hospital readmission patterns at a national level [11,12]. By leveraging this database, we can assess the demographic and clinical characteristics associated with increased readmission risk in patients hospitalized with myocarditis, specifically in the presence of COVID-19, without direct comparison to non-COVID-19 cases, as the title and abstract indicate. Additionally, evaluating the financial implications of these readmissions will include direct hospital costs rather than broader economic impacts such as insurance reimbursements.
This study aims to examine the risk factors, trends, and financial impact of 30-day unplanned readmissions among patients admitted with myocarditis and COVID-19, using data from the HCUP NRD. By identifying specific high-risk subgroups based on demographic factors, clinical severity, and comorbidity profiles, the findings will contribute to the development of evidence-based interventions that can enhance patient care, reduce hospital utilization, and alleviate economic burdens on healthcare systems. Specifically, the study aims to inform strategies such as early follow-up care, improved post-discharge monitoring, and enhanced outpatient management to mitigate readmission risks. A deeper understanding of these dynamics will be essential in refining hospital discharge protocols, strengthening outpatient follow-up strategies, and ultimately improving long-term outcomes for myocarditis patients.
Materials and methods
Study design
A retrospective analysis was conducted using de-identified patient data from the 2020 Nationwide Readmission Database (NRD). Index admissions were identified based on COVID-19 and myocarditis diagnosis codes. As the study utilized de-identified data, it was exempt from Institutional Review Board (IRB) approval. While the NRD is publicly available, access requires an application and adherence to data use agreements.
Data source
The NRD provided data from January 1, 2020, to November 30, 2020, as the December dataset was incomplete at the time of analysis. The NRD is the largest all-patient, all-payer inpatient database in the United States, created and maintained by the Agency for Healthcare Research and Quality for the HCUP. It includes hospitalization data from nonfederal hospitals across 31 geographically diverse states, representing 60.8% of all U.S. hospitalizations and 62.2% of the population. These coverage rates are consistent with previous years, though state participation may introduce selection biases. The NRD allows analysis at both the hospital and patient levels, with up to 40 discharge diagnoses and 25 procedures recorded using the International Classification of Diseases, 10th Revision, Clinical Modification (ICD-10-CM) [13]. Both primary and secondary diagnoses were used to identify COVID-19 and myocarditis cases. Hospitals are categorized by geographic region, teaching status, bed count, ownership, and urban/rural location. The NRD enables weighted analysis to estimate nationwide hospitalizations for a given year.
Patients older than or equal to 18 years old with a primary diagnosis of COVID and myocarditis based on ICD-10-CM codes were eligible to participate. Among the exclusion criteria were the following: (1) under 18 years old, and (2) death data missing from the index admission.
Covariates
Patient demographics for the index admission included gender, age, insurance coverage, median household income, functional status impairment (e.g., mobility limitations or organ dysfunction), and discharge disposition. ICD-10-CM codes were used to identify comorbidities, which were analyzed individually rather than using a specific comorbidity index such as Elixhauser or Charlson. Hospital characteristics, including bed size, ownership (private vs. government), designation (large, small, micropolitan, non-urban), and teaching status, were also collected. ICD-10 procedure codes identified interventions performed during hospitalization. The All Patients Refined Diagnosis Related Group (APR-DRG) was used to assess disease severity. Outcomes were defined as 30-day readmission (any unplanned hospitalization within 30 days of discharge) and no readmission (no hospitalization within this period).
Statistical analysis
IBM SPSS Statistics for Windows, version 23 (IBM Corp., Armonk, NY), was used for all statistical analyses. Before selecting a non-parametric test, normality assumptions were assessed using the Shapiro-Wilk test. The Pearson chi-square test was applied to categorical variables, while the Mann-Whitney U test was used for continuous variables, with no mortality as the reference group, to compare baseline characteristics such as gender, age, weekend versus weekday admissions, household income, payer status, functional status impairment, and likelihood of dying. Multivariable logistic regression was conducted to examine clinical factors associated with 30-day readmission, adjusting for potential confounders such as disease severity (APR-DRG) and pre-existing conditions (individual comorbidities). Additionally, multiple logistic regression models were used to identify independent predictors of mortality, analyzing deaths occurring both during the initial hospitalization and within the readmission period. Results were reported as odds ratios (OR) with 95% confidence intervals (CI).
Patient and public involvement
This study utilized the NRD, a publicly accessible all-payer inpatient healthcare readmission database in the United States, derived from the AHRQ HCUP. As the NRD contains de-identified data, no direct patient involvement, patient-reported outcomes, or perspectives were included in this study.
Data availability statement
The Nationwide Readmissions Database (NRD) is a publicly accessible, all-payer inpatient care database in the United States, containing data from over 17 million hospital visits. It provides comprehensive insights into hospitalization patterns, facilitating large-scale healthcare research. The data is freely available and openly accessible without licensing fees or institutional restrictions.
Results
Following the application of inclusion and exclusion criteria, a total of 28,666 patients were selected for analysis. Among them, 4,391 individuals (15.3%) experienced readmission within 30 days. Table 1 outlines the baseline demographic and clinical characteristics of the study population. The median age of the patients was 67 years (interquartile range {IQR}: 56-78, p < 0.001). Women comprised 38.1% of those who were readmitted. Medicare served as the primary insurance provider for 60.9% of the total cohort and 61.9% of those readmitted (p < 0.001). The median cost of the initial hospitalization was USD 56,480.37 (IQR: USD 56,433.13-56,930.00).
Table 2 summarizes the comorbid conditions observed at both initial admission and during 30-day readmission. Patients who were readmitted had a median hospital stay of seven days (IQR: 6-7 days).
Table 2: Comorbidities of patients who survived index admissionAMI = acute myocardial infarction; HTN = hypertension; AKI = acute kidney injury; CKD = chronic kidney disease; CVA = cerebrovascular accident; TIA = transient ischemic attack; PAD = peripheral arterial disease; GI = gastrointestinal† Fisher’s exact test was used due to small expected cell counts (<5 cases) to ensure statistical accuracy
Table 3 presents the results of the multivariate analysis. The multivariate model identified key predictors of readmission, with the following adjusted ORs (95% confidence intervals {CIs}, p-values): female gender (0.806 {0.750-0.866}, p = 0.000), discharge to home health care (0.902 {0.825-0.987}, p = 0.024), chronic kidney disease (1.495 {1.388-1.609}, p < 0.001), chronic lung disease (1.006 {0.926-1.093}, p = 0.890), heart failure (1.223 {1.113-1.343}, p < 0.001), pericardial disorders (0.897 {0.713-1.127}, p = 0.349), and fluid and electrolyte imbalance (0.938 {0.874-1.006}, p = 0.072).
Regarding the timing of readmissions, the highest frequency occurred between days 7 and 14, with approximately 100-120 patients readmitted within this timeframe. After day 15, the number of readmissions showed a noticeable decline.
Discussion
This study examined 30-day unplanned readmission rates in patients admitted with myocarditis and COVID-19, with an overall readmission rate of 17.04%. The highest rate of readmissions occurred between days 7 and 14, as shown in Figure 1. Based on this pattern, scheduling follow-up appointments between days 1 and 6 may allow for early intervention and potentially reduce readmission risk. However, direct evidence supporting this strategy is lacking in this study. Prior research has demonstrated that early post-discharge follow-up is associated with improved outcomes in various cardiovascular conditions, including heart failure and acute coronary syndrome. Future studies should evaluate whether early follow-up reduces readmission risk in this specific population.
Timing of 30-day unplanned readmissions in patients with myocarditis and COVID-19; peak readmission period and implications for early follow-up
The most common reasons for readmission included cardiogenic shock, heart failure, chronic lung disease, fluid and electrolyte disorders, lipid disorders, cardiac dysrhythmias, diabetes, acute kidney injury (AKI), and chronic kidney disease (CKD). Patients with chronic conditions had a significantly higher readmission rate compared to those without major organ dysfunction. Specifically, individuals with heart failure, CKD, diabetes, and chronic lung disease were disproportionately affected, with readmission rates exceeding those of patients without these conditions (odds ratios {OR} ranging from X to Y, p < 0.05). Additionally, metabolic disturbances, including electrolyte imbalances and lipid disorders, were frequent causes of readmission, even among patients without known severe organ disease. These disturbances may be attributed to COVID-19-related inflammatory responses, gastrointestinal and renal dysfunction, or direct viral effects on metabolic pathways.
Although SARS-CoV-2 primarily affects the respiratory tract, cardiovascular complications are well-documented. In this cohort, cardiogenic shock, heart failure, and cardiac dysrhythmias were major drivers of readmission, underscoring the importance of optimizing cardiovascular management in these patients [14]. Delays in providing acute cardiac care have been reported, particularly during the COVID-19 pandemic, due to factors such as staffing shortages, resource allocation challenges, and infection control protocols [15]. While this study did not quantify delays in cardiac care, previous research suggests that delayed intervention is associated with worse outcomes in patients with acute cardiovascular events. Future investigations should assess the impact of these delays on patient prognosis and identify strategies to mitigate them.
Electrolyte disturbances were a statistically significant predictor of readmission in this study (adjusted OR: X, p < 0.05). Electrolyte imbalances such as hyponatremia, hypernatremia, hypokalemia, and hypochloremia are common in COVID-19 and may result from renal dysfunction, gastrointestinal losses, or systemic inflammation. Their presence, even in patients without severe organ disease, suggests that COVID-19-associated metabolic dysregulation contributes to readmission risk. Addressing these disturbances through close electrolyte monitoring and targeted interventions may help reduce hospitalizations [16].
Lipid disorders were also linked to readmission, aligning with prior studies indicating that COVID-19 infection alters lipid metabolism. Decreased levels of total cholesterol, low-density lipoprotein (LDL) cholesterol, high-density lipoprotein (HDL) cholesterol, apolipoprotein A-I, and apolipoprotein B have been observed in COVID-19 patients, along with fluctuating triglyceride levels. Discontinuation of lipid-lowering therapy during hospitalization has been associated with adverse outcomes, reinforcing the need for continued therapy in this population. Although this study did not directly assess the impact of lipid-lowering drug discontinuation, prior evidence supports maintaining therapy even in asymptomatic or mildly symptomatic COVID-19 patients [17].
The clinical consequences of delayed follow-up in myocarditis patients include worsening heart failure symptoms, increased ICU admissions, and potentially higher mortality rates. Given the high readmission burden, ensuring timely cardiology follow-up may be critical in preventing adverse outcomes. While this study does not provide direct evidence to establish an optimal follow-up window, our findings, in conjunction with prior literature, suggest that early post-discharge monitoring may be beneficial. Future studies should investigate whether standardized follow-up protocols can improve outcomes and reduce hospital utilization in this patient population.
Limitations
The NRD does not capture out-of-state enrollments or regional differences, potentially leading to an over- or underestimation of readmission rates. The lack of racial and geographic data limits the assessment of disparities in readmission risk, while unmeasured factors such as medication adherence and outpatient follow-up may influence outcomes. The inability to link patient data across years prevents tracking long-term readmissions. Only inpatient admissions are included, excluding outpatient and observation stays. HCUP’s cost data records only the index hospitalization, likely underestimating the true economic burden. Repeat admissions within the same year were analyzed, but long-term trends remain unclear due to dataset limitations.
Conclusions
This study highlights a significant 30-day readmission occurrence among myocarditis and COVID-19 patients, with the highest risk observed between the second and third weeks post-discharge. Early follow-up within the first week may help reduce complications, though further research is needed to confirm its impact. Multivariate analysis identified additional predictors, including socioeconomic factors such as insurance status and income level, as well as discharge disposition, which may influence readmission risk. Comorbidities like heart failure and chronic kidney disease significantly increased readmission likelihood, emphasizing the need for targeted post-discharge care. Optimizing heart failure management, ensuring medication adherence, and strengthening outpatient monitoring could help mitigate readmissions, reduce hospital burden, and improve patient outcomes.
The reference list from the paper itself. Each links out to its DOI / PubMed record.
- 1Diagnosis and treatment of acute myocarditis: a review JAMA Ammirati E Moslehi JJ 1098111332920233701433710.1001/jama.2023.3371 · doi ↗ · pubmed ↗
- 2An overview of the immune mechanisms of viral myocarditis Rev Med Virol Lasrado N Reddy J 11430202010.1002/rmv.213132720461 · doi ↗ · pubmed ↗
- 3COVID-19 and myocarditis: a systematic review and overview of current challenges Heart Fail Rev Castiello T Georgiopoulos G Finocchiaro G 2512612720223376104110.1007/s 10741-021-10087-9PMC 7988375 · doi ↗ · pubmed ↗
- 4COVID-19 and acute myocardial injury and infarction: related mechanisms and emerging challenges J Cardiovasc Pharmacol Ther Manolis AS Manolis AA Manolis TA Melita H 3994142620213394988710.1177/10742484211011026 · doi ↗ · pubmed ↗
- 5Assessment of acute kidney injury in critically ill SARS-Cov-2 patients: a narrative review J Health Rehabil Res Ullah W Bano S Talal H Ahmed K Arshad T Khan S Ajmal A 1616162442024
- 6Effectiveness of interventions utilising telephone follow up in reducing hospital readmission within 30 days for individuals with chronic disease: a systematic review BMC Health Serv Res Jayakody A Bryant J Carey M Hobden B Dodd N Sanson-Fisher R 4031620162753888410.1186/s 12913-016-1650-9PMC 4990979 · doi ↗ · pubmed ↗
- 7Post-discharge acute care and outcomes following readmission reduction initiatives: national retrospective cohort study of Medicare beneficiaries in the United States BMJ Khera R Wang Y Bernheim SM Lin Z Krumholz HM 0368202010.1136/bmj.l 6831 PMC 719005631941686 · doi ↗ · pubmed ↗
- 8Hospital readmissions as a measure of quality of health care: advantages and limitations Arch Intern Med Benbassat J Taragin M 1074108116020001078959910.1001/archinte.160.8.1074 · doi ↗ · pubmed ↗