One-Tenth of the Top 50 Pediatric Orthopedic Hospitals Provide Compliant Price Transparency Information for 15 Common Pediatric Orthopedic Procedures
Nicholas G Belt, Austin Lee, Andrew Moyal, Robert Burkhart, Victoria Nedder, Raymond Liu

TL;DR
Only 10% of the top 50 U.S. pediatric orthopedic hospitals fully comply with federal price transparency rules, and procedure costs vary widely.
Contribution
This study evaluates compliance with CMS price transparency mandates among top pediatric orthopedic hospitals and quantifies pricing variation.
Findings
Only 10% of the top 50 hospitals fully complied with CMS price transparency guidelines.
Pricing for procedures like arthroscopic Bankart repair varied from $3,012 to $109,320.
Most hospitals failed to provide all required price types (cash, gross, and payer-negotiated charges).
Abstract
Introduction In 2019, Centers for Medicare and Medicaid Services (CMS) mandated hospitals to provide publicly available chargemasters to aid in transparency of pricing for hospital procedures. Despite the mandate, many orthopedic hospitals do not comply with CMS guidelines. The goals of this study are to (1) assess the compliance of the top 50 U.S. children’s orthopedic hospitals with the CMS mandate and (2) analyze variation in pricing for common orthopedic procedures among these hospitals. Methods The top 50 pediatric orthopedic hospitals within the United States were selected based on U.S. News and World Report. Fifteen common pediatric orthopedic procedures were then selected based on literature and internal institutional volume. The website of each hospital was searched for the required downloadable chargemaster and/or a user-friendly online tool to provide pricing for each…
Genes, proteins, chemicals, diseases, species, mutations and cell lines named across the full text — each resolved to its canonical identifier and authoritative record.
Click any figure to enlarge with its caption.
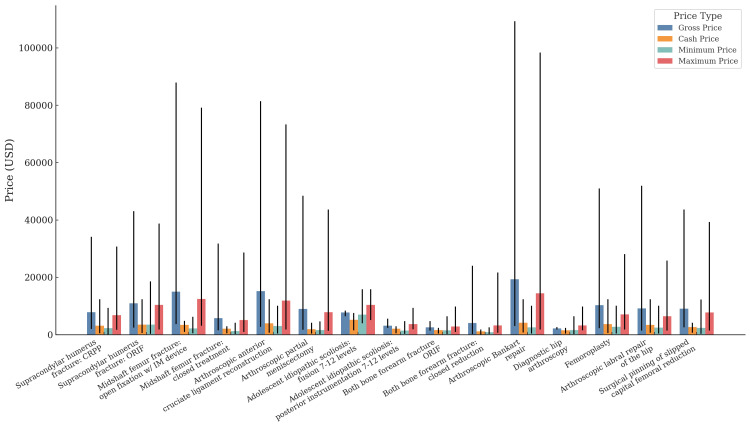 Figure 1
| Characteristic | Number of hospitals |
| Hospital size | |
| <200 beds | 14 |
| 200-400 beds | 25 |
| >400 beds | 11 |
| U.S. census region | |
| Midwest | 11 |
| Northeast | 7 |
| South | 21 |
| West | 11 |
| Hospital ownership | |
| Public | 12 |
| Private | 38 |
| Hospital name | Location | CPT 24538 | CPT 24545 | CPT 27506 | CPT 27502 | CPT 29888 | CPT 29880 | CPT 22802 | CPT 22843 | CPT 25574 | CPT 25565 | CPT 23462 | CPT 29860 | CPT 29914 | CPT 29916 | CPT 27176 |
| Children's Hospital of Philadelphia | Philadelphia, PA | N | N | N | N | N | N | N | N | N | N | N | N | N | N | N |
| Children's Hospital Los Angeles | Los Angeles, CA | N | N | N | N | N | N | N | N | N | N | N | N | N | N | N |
| Children's National Hospital | Washington, DC | C | C | C | C | C | C | C | C | C | C | C | C | C | C | C |
| Texas Children's Hospital | Houston, TX | N | N | N | N | N | N | N | N | N | N | N | N | N | N | N |
| Johns Hopkins Children's Center | Baltimore, MD | N | N | N | N | N | N | N | N | N | N | N | N | N | N | N |
| Children's Healthcare of Atlanta | Atlanta, GA | N | N | N | N | N | N | N | N | N | N | N | N | N | N | N |
| Nationwide Children's Hospital | Columbus, OH | C | C | C | C | C | C | C | C | C | C | C | C | C | C | C |
| UH Rainbow Babies and Children's Hospital | Cleveland, OH | N | N | N | N | N | N | N | N | N | N | N | N | N | N | N |
| St. Louis Children's Hospital-Washington University | St. Louis, MO | N | N | N | N | N | N | N | N | N | N | N | N | N | N | N |
| UPMC Children's Hospital of Pittsburgh-Shriners Hospitals for Children Erie | Pittsburgh, PA | N | N | N | N | N | N | N | N | N | N | N | N | N | N | N |
| Children’s Hospital Colorado | Aurora, CO | N | N | N | N | N | N | N | N | N | N | N | N | N | N | N |
| Mayo Clinic Children's Center | Rochester, MN | P | P | P | P | P | P | P | N | P | P | P | P | P | P | P |
| Lerner Children's Pavilion-Hospital for Special Surgery | New York, NY | N | N | N | N | N | N | N | N | N | N | N | N | N | N | N |
| Children's Mercy Kansas City | Kansas City, MO | N | N | N | N | N | N | N | N | N | N | N | N | N | N | N |
| Levine Children's Hospital | Charlotte, NC | N | N | N | N | N | N | N | N | N | N | N | N | N | N | N |
| UC Davis Children's Hospital-Shriners Children's Northern California | Sacramento, CA | N | N | N | N | N | N | N | N | N | N | N | N | N | N | N |
| North Carolina Children's Hospital at UNC | Chapel Hill, NC | N | N | N | N | N | N | N | N | N | N | N | N | N | N | N |
| Monroe Carell Jr. Children’s Hospital at Vanderbilt | Nashville, TN | P | P | P | P | N | P | P | P | P | P | N | P | P | P | P |
| Duke Children's Hospital and Health Center | Durham, NC | P | N | N | N | N | N | N | N | N | N | N | N | N | N | N |
| Lucile Packard Children's Hospital Stanford | Palo Alto, CA | N | N | N | N | N | N | N | N | N | N | N | N | N | N | N |
| Valley Children's Healthcare and Hospital | Madera, CA | N | N | N | N | N | N | N | N | N | N | N | N | N | N | N |
| Dayton Children's Hospital | Dayton, OH | C | C | C | C | C | C | C | C | C | C | C | C | C | C | C |
| NewYork-Presbyterian Children's Hospital-Columbia and Cornell | New York, NY | N | N | N | N | N | N | N | N | N | N | N | N | N | N | N |
| University of Iowa Stead Family Children's Hospital | Iowa City, IA | N | N | N | N | N | N | N | N | N | N | N | N | N | N | N |
| Cleveland Clinic Children's | Cleveland, OH | P | P | P | P | P | P | P | P | N | P | P | P | P | P | P |
| University of Michigan Health C.S. Mott Children's Hospital | Ann Arbor, MI | N | N | N | N | N | N | N | N | N | N | N | N | N | N | N |
| Nemours Children's Hospital-Delaware | Wilmington, DE | N | N | N | N | N | N | N | N | N | N | N | N | N | N | N |
| Nicklaus Children's Hospital | Miami, FL | N | N | N | N | N | N | N | N | N | N | N | N | N | N | N |
| Riley Hospital for Children at IU Health | Indianapolis, IN | P | P | P | P | P | P | P | P | P | P | P | P | P | P | P |
| The Bristol-Myers Squibb Children's Hospital at Robert Wood Johnson University Hospital | New Brunswick, NJ | N | N | N | N | N | N | N | N | N | N | N | N | N | N | N |
| University of Virginia Children's Hospital | Charlottesville, VA | P | P | N | P | P | P | N | N | P | P | N | N | P | P | N |
| MUSC Shawn Jenkins Children's Hospital | Charleston, SC | N | N | N | N | N | N | N | N | N | N | N | N | N | N | N |
| Seattle Children's | Seattle, WA | P | P | P | P | P | P | P | P | P | P | P | P | P | P | P |
| UCLA Mattel Children's Hospital | Los Angeles, CA | N | N | N | N | N | N | N | N | N | N | N | N | N | N | N |
| CHOC Children's | Orange County, CA | P | P | P | P | P | P | N | N | N | P | P | N | N | N | P |
| Cook Children's Medical Center | Fort Worth, TX | P | P | P | P | P | P | P | P | P | P | P | P | P | P | P |
| UCSF Benioff Children's Hospitals | San Francisco, CA | N | N | N | N | N | N | N | N | N | N | N | N | N | N | N |
| Kentucky Children's Hospital | Lexington, KY | P | P | N | N | P | P | N | N | N | P | P | N | P | P | N |
| OHSU Doernbecher Children's Hospital | Portland, OR | C | C | C | C | C | C | C | C | C | C | C | C | C | C | C |
| Norton Children's Hospital | Louisville, KY | N | N | N | N | N | N | N | N | N | N | N | N | N | N | N |
| Arkansas Children's Hospital | Little Rock, AR | P | P | P | N | P | P | N | N | P | P | N | N | N | N | P |
| Orlando Health Arnold Palmer Hospital for Children | Orlando, FL | N | N | N | N | N | N | N | N | N | N | N | N | N | N | N |
| Johns Hopkins All Children’s Hospital | St. Petersburg, FL | N | N | N | N | N | N | N | N | N | N | N | N | N | N | N |
| Ochsner Hospital for Children | New Orleans, LA | N | N | N | P | N | N | N | N | N | P | N | N | N | N | N |
| Joe DiMaggio Children's Hospital | Hollywood, FL | N | N | N | N | N | N | N | N | N | N | N | N | N | N | N |
| Cincinnati Children's Hospital Medical Center | Cincinnati, OH | P | P | P | P | P | P | P | P | P | P | P | P | P | P | P |
| Children's Medical Center Dallas-Scottish Rite for Children | Dallas, TX | C | C | C | C | C | C | C | C | C | C | C | C | C | C | C |
| Boston Children's Hospital | Boston, MA | P | N | N | P | P | P | N | N | N | N | P | P | N | P | N |
| Rady Children's Hospital-San Diego | San Diego, CA | N | N | N | N | N | N | N | N | N | N | P | N | N | N | N |
| Cohen Children's Medical Center | New Hyde Park, NY | P | P | N | N | P | P | N | N | N | N | P | N | P | P | P |
| CPT code | Gross charge | Discounted cash price | Payer-specific negotiated charges | Minimum negotiated charge | Maximum negotiated charge |
| CPT 24538 | 12 | 8 | 15 | 14 | 15 |
| CPT 24545 | 11 | 8 | 13 | 13 | 13 |
| CPT 27506 | 9 | 7 | 11 | 10 | 10 |
| CPT 27502 | 11 | 6 | 13 | 13 | 13 |
| CPT 29888 | 11 | 7 | 14 | 14 | 14 |
| CPT 29880 | 11 | 8 | 14 | 14 | 14 |
| CPT 22802 | 7 | 7 | 9 | 9 | 9 |
| CPT 22843 | 7 | 5 | 8 | 8 | 8 |
| CPT 25574 | 8 | 7 | 10 | 10 | 10 |
| CPT 25565 | 14 | 8 | 14 | 14 | 14 |
| CPT 23462 | 9 | 7 | 13 | 13 | 13 |
| CPT 29860 | 6 | 7 | 9 | 9 | 9 |
| CPT 29914 | 9 | 8 | 12 | 12 | 12 |
| CPT 29916 | 9 | 8 | 12 | 12 | 12 |
| CPT 27176 | 8 | 7 | 11 | 11 | 11 |
| Variable | Percentage (number of hospitals) |
| Pricing tool | 92(46) |
| CMS document | 80(40) |
| Personal information required | 14(7) |
| Description of procedure | 30(15) |
| Phone number | 100(50) |
| Language | |
| English | 100(50) |
| English and Spanish | 0(0) |
| English and other | 0(0) |
| Time from initial query | |
| <5 min | 60(30) |
| 5-15 min | 24(12) |
| >15 min | 16(8) |
| Procedure search function | |
| Nothing | 32(16) |
| CPT | 4(2) |
| DRG | 0(0) |
| Keywords | 10(5) |
| Combination (keywords, DRG, and CPT) | 54(27) |
Peer Reviews
No public reviews on file for this paper yet. If you reviewed it on a platform where reviews are public (OpenReview, ICLR, NeurIPS, ICML), you can paste yours below so the community can read it here.
Videos
No videos yet. Explain this paper in a talk, walkthrough, or lecture? Add one.
Taxonomy
TopicsHealthcare Policy and Management · Healthcare cost, quality, practices · Primary Care and Health Outcomes
Introduction
Healthcare price transparency requires disclosure of information on the cost of healthcare [1]. Centers for Medicare and Medicaid Services (CMS) mandated in 2019 that hospital chargemasters be publicly available in a machine-readable file [2]. Price transparency can improve patient knowledge about the cost of care and increase patient involvement in making cost-conscious choices [1-4]. There is also significant variation in prices for care, and price transparency can increase competition in the healthcare system, creating an incentive to lower prices and reduce costs [1,3,4]. Price transparency is especially important in the United States because out-of-pocket costs are common for medical services and depend on factors such as the patient’s coverage status, type of insurance, and whether the service is in- or out-of-network [5]. Additionally, many individuals have inadequate health literacy and low confidence in their ability to use insurance to access healthcare [6,7].
Despite the 2019 CMS mandate, few institutions are currently compliant with price transparency regulations [2,4,8-12]. One study found that 51.5% of a sample of 5,288 U.S. hospitals were not compliant with the mandate [2]. Most healthcare price websites only report billed charges (rather than out-of-pocket charges), which a patient is rarely fully responsible for [8,9]. Many websites also tend to report only facility fees and not professional fees, underestimating the total price [8,9]. Despite attempted enforcement by the CMS mandate, estimating the price of care continues to pose a large challenge to both patients and providers alike.
Some pediatric literature has attempted to analyze price transparency for individual services, such as imaging, tonsillectomy, ACL reconstructions, and radius fractures. While data shows CMS compliance rates from 20% to 44% and high variability in pricing, these studies relied on phone-call scripts rather than use of the required online chargemasters [9-12]. Given these limitations, further research is required to better understand pediatric price transparency, especially within pediatric orthopedics. Therefore, we asked the following: (1) What is the compliance rate for a variety of common pediatric procedures among the top 50 U.S. children’s orthopedic hospitals? and (2) How do prices compare among these hospitals?
Materials and methods
Study design, hospital selection, and procedure selection
The top 50 hospitals for pediatric orthopedic surgery were selected for use in this study, as ranked by U.S. News and World Report [13]. Basic data for each hospital was collected, including size by number of beds, U.S. census region, type of ownership, and for-profit vs. not-for-profit. Because our study utilized publicly available data, this study was exempt from institutional review board approval.
Fifteen common pediatric orthopedic procedures were selected, informed by a combination of contemporary literature and internal institutional volume [14,15]. The procedures selected were: 22802 (adolescent idiopathic scoliosis [AIS]: fusion 7-12 levels), 22843 (AIS: instrumentation 7-12 levels), 23462 (arthroscopic Bankart repair), 24538 (supracondylar humerus fracture: closed reduction percutaneous pinning [CRPP]), 24545 (supracondylar humerus fracture: open reduction internal fixation [ORIF]), 25565 (both bone forearm fracture closed reduction), 25574 (both bone forearm fracture ORIF), 27176 (surgical pinning of slipped capital femoral epiphysis), 27502 (midshaft femur fracture, closed treatment of femoral shaft fracture, with manipulation with or without skin or skeletal traction), 27506 (midshaft femur fracture open fixation with intramedullary device), 29860 (diagnostic hip arthroscopy), 29880 (arthroscopic partial meniscectomy), 29888 (arthroscopic anterior crucial ligament reconstruction), 29914 (femoroplasty), and 29916 (arthroscopic labral repair of the hip).
Under the CMS price transparency rule, every hospital is mandated to publish a comprehensive list of standard charges for all the services and items they offer [16]. This list must be accessible online in a downloadable, machine-readable format. The required information for each service or item includes gross charges, payer-specific negotiated charges, de-identified minimum and maximum negotiated charges, and discounted cash prices (CMS required prices). The gross charge is the total amount billed by the hospital for services before any discounts or insurance adjustments are applied [16]. Payer-specific negotiated charge is the charge that a hospital negotiated with a third-party payer for an item or service [16]. The de-identified minimum and maximum negotiated charges are the lowest and highest charges that a hospital negotiated with all third-party payers [16]. The discounted cash price is the charge that applies to an individual who pays cash, or cash equivalent, for an item or service [16]. Importantly, this information must be made available to patients free of charge, and access should not require any personal identifying information.
What is the compliance for a variety of common pediatric procedures among the top 50 U.S. children’s orthopedic hospitals?
Comprehensive search of hospital chargemasters was completed between December 1 and December 15, 2023, by three authors (initials blinded for peer review). All Current Procedural Terminology (CPT) codes were analyzed using machine-downloadable files or user-friendly price-estimator tools. If accessing pricing information necessitated personal insurance status, the reviewers selected options associated with being uninsured. In instances where personal information was required for access, the generic name of “John Doe” with a birthdate of January 1, 1980, was utilized. If use of the above tools did not provide pricing for specific CPT codes, a second search was completed utilizing standardized keywords such as “forearm fracture,” “humerus fracture,” “arthroplasty,” “knee,” “hip,” or “femur.”
The CMS required prices were collected for each procedure. Hospitals providing all five datapoints were deemed compliant, those offering one to four datapoints were considered pseudo-compliant, and those offering no data were deemed noncompliant. In the process of searching for the above charges, the following factors were analyzed to assess consumer usability: (1) possible language options, (2) the time required to locate procedure prices, (3) availability of contact information for inquiries, and (4) the provision of procedure descriptions in common terms.
How do prices compare among the top 50 U.S. children’s orthopedic hospitals?
For all CPT codes listed, data was collected pertaining to the CMS required prices. Charges were organized and compared based on procedure type. A specific note was made of the average, maximum, and minimum charges. No inferential statistical analysis was completed.
Results
Characteristics of included hospitals
All 50 of the hospitals included in the study were non-profit teaching hospitals located in Urban areas (Table 6, Appendix). When stratified by U.S. census regions, 21 (42%) hospitals were in the South, followed by 11 (22%) in the Midwest (11 of 50), 11 (22%) in the West, and seven (14%) in the Northeast. Most hospitals were private (76%). The bed size ranged from 125 to 973, with most hospitals falling between 200 and 400 beds (Table 1).
What is the compliance for a variety of common pediatric procedures among the top 50 U.S. children’s orthopedic hospitals?
Only five (10%) of the hospitals were compliant with all of the requirements stated in the Hospital Price Transparency final rule for all 15 procedures [2]. Additionally, 16 (32%) hospitals were pseudo-compliant with at least one of the procedures included (Table 2). When evaluating compliance per CPT code, 14 (28%) and 13 (26%) of hospitals qualified as pseudo-compliant for CPT codes 24538 (supracondylar humerus fracture: CRPP) and 29880 (arthroscopic partial meniscectomy), respectively, representing the two most compliant codes.
Of the five requirements for the machine-readable CMS document, payer-specific negotiated charges, minimum negotiated charge, and maximum negotiated charge were the three CMS-required datapoints most often available to patients, with an average of 30% of hospitals listing them across all 15 CPT codes (Table 3). Meanwhile, an average of 18% of hospitals had information on discounted cash prices listed on their CMS document.
Patient-friendly pricing tools were available on 46 (92%) hospital websites (Table 4). Additionally, all hospitals only provided price transparency information in English. All hospitals provided a phone number to call for specific pricing information. Forty (80%) hospitals provided a downloadable CMS chargemaster file. Of those downloaded, 16 (40%) were unusable due to issues, such as poor text readability, unlabeled pricing, or file-sizes exceeding 1GB, which led to computer freezes. The 24 (60%) remaining hospitals provided downloadable and usable files. Of the files that were available and usable, six (25%) did not have search capabilities (CPT, Diagnosis-Related Group [DRG], or keywords), and 10 (42%) only had keyword search capabilities.
How do prices compare among the top 50 U.S. children’s orthopedic hospitals?
The payer-negotiated charges were the most available datapoint, with 12 (24%) hospitals listing this data. The highest average maximum negotiated charge among the CPT codes of interest was CPT 23462 (arthroscopic Bankart repair), with a charge of 14,478 (Figure [1](#FIG1)). The lowest average maximum negotiated charge was CPT 25574 (both bone forearm fracture ORIF), with a charge of 2,880 (Table 5, Appendix). There was substantial variability in maximum negotiated charges between the different hospitals. The widest range for the maximum negotiated charge was CPT 23462 (arthroscopic Bankart repair), ranging from 98,388 at another.
Price variability across common pediatric orthopedic procedures by price typeEach bar represents the mean price for the respective category, with the error bars indicating the range from the minimum to the maximum price.Gross price is the total amount billed by the hospital for the procedure before any discounts or adjustments. Cash price is the charge for individuals paying cash without insurance. Minimum price is the lowest payer-negotiated price reported for the procedure across all insurers. Maximum price is the highest payer-negotiated price reported for the procedure across all insurers.Exact data used for this figure can be found in Table 5 in the Appendix.
The highest average minimum negotiated charge among the CPT codes of interest was CPT 22802 (AIS: fusion 7-12 levels), with a charge of 830. The most varied, CPT 24545 (supracondylar humerus fracture: ORIF), ranged from 18,595 between hospitals (Figure 1).
The gross charge was the second most published datapoint, with 10 (20%) hospitals listing this information on their downloadable, machine-readable CMS document. CPT 23462 (arthroscopic Bankart repair) had the highest average gross charge of 2,220. The widest range for gross charge was CPT 23462 (arthroscopic Bankart repair), ranging from 109,320. The narrowest range for the gross charge was CPT 29860 (diagnostic hip arthroscopy), ranging from 2,656 (Figure 1).
Lastly, seven (14%) hospitals listed the cash price for each procedure. CPT 22802 (AIS: fusion 7-12 levels) had the highest average cost of 1,114. CPT 23462 (arthroscopic Bankart repair) had the most variability between cash prices, ranging from 12,403 (Figure 1).
Discussion
Despite the 2019 Hospital Price Transparency legislation, recent literature demonstrates noncompliance with the mandates [2,4,8-12]. This study supports recent literature and shows that only five (10%) of the top 50 pediatric orthopedic hospitals provide adequate information to assess the price of common pediatric orthopedic procedures. While many hospitals had the required downloadable CMS required file, 16/40 of the files were deemed unusable. Of the 24 files providing some usability, 16 were severely limited by inability to search for a procedure, or requirement to search for a generic term that does not apply to the procedure of interest. Of the three mandated types of information, seven (14%) hospitals listed cash prices, 10 (20%) hospitals listed gross charges, and 12 (24%) hospitals listed payer-negotiated charges. Forty-six (92%) hospitals had some form of user-friendly pricing tools, but the ability to obtain a single price for a specific procedure was extremely limited. Furthermore, no hospitals offered pricing tools in any language other than English. Additionally, the cash price was the least commonly reported, further complicating the process of obtaining the price of a common pediatric orthopedic procedure for uninsured patients and/or those attempting to pay out of pocket.
This study seems to agree with other contemporary studies assessing price transparency after implementation of the CMS mandate. Most similarly, Ayoub and Balakrishnan conducted a study to evaluate pediatric hospital compliance with the CMS mandate, reporting 27% of the pediatric hospitals were compliant in pricing information for pediatric tonsillectomy [17]. Although this study reports compliance rates that are lower than those found in other manuscripts, the current study analyzed 15 different procedures, and it required pricing information for all procedures in order for a hospital to be deemed fully compliant. Furthermore, this study conducted individual assessments of the six mandates required by the CMS price transparency legislation, enabling the identification of precise areas where hospitals can enhance their price transparency practices and inform future enforcement strategies.
This study also shows a substantial variation in pricing for the 15 procedures of interest. For example, arthroscopic Bankart repair (23462) had the widest range for maximum negotiated charge, with a range from 98,388. For the same procedure, the cash price listed varied from 12,403. While minimum negotiated charges varied to a smaller extent, the dramatic differences seen among some negotiated rates are concerning, nonetheless. In general, the variability in pricing between hospitals and between cash prices, gross charges, and negotiated charges underscores the complex landscape of healthcare pricing [18]. The same procedure can result in vastly different costs depending on the institution. Not only is there a wide variability in terms of price for the same procedure, but there is also a lack of clear, easily accessible pricing information. This combination may deter patients from seeking necessary care or lead to excessive financial burdens, especially those that are uninsured or on high-deductible plans [19,20].
Limitations
There are some limitations to this study. First, this study only included the top pediatric orthopedic hospitals, which may not be the best representation for all children’s hospitals. Additionally, hospitals provide different quoted prices and charges based on the patient's insurance status or provider. While the CMS mandate requires hospitals to provide payer-specific charges, our study found that these specific price estimates were not available for most of the hospitals. Additionally, the price transparency legislation does not require estimates for professional fees for surgeons and anesthesiologists, so we were not able to evaluate these charges for the procedures. Furthermore, many of the pediatric hospitals evaluated in the study are affiliated with adult hospitals. These hospitals often merged the pediatric pricing data with the adult data, making it difficult to differentiate pediatric pricing from that of adult care.
Conclusions
The current state of price transparency among top pediatric orthopedic hospitals falls significantly short of the expectations set by the CMS mandate. Compliance remains low, and even when hospitals attempt to meet requirements, significant barriers to accessibility limit the utility of the available pricing information. The observed inconsistencies in how hospitals report pricing further hinder patients’ ability to make informed financial decisions about their care. These findings highlight the need for a reassessment of current enforcement strategies and the practicality of existing regulations. Without meaningful improvements in transparency and usability, the intended benefits of price disclosure, such as empowering patients, reducing financial strain, and fostering competition, will remain largely unrealized. Future efforts should prioritize not only compliance but also the development of clear, standardized, and patient-friendly methods for accessing healthcare pricing information.
The reference list from the paper itself. Each links out to its DOI / PubMed record.
- 1Price transparency-promise and peril JAMA Glied S 1496149732520213387728010.1001/jama.2021.4640 · doi ↗ · pubmed ↗
- 2Transparency, accessibility, and variability of US hospital price data JAMA Netw Open Haque W Ahmadzada M Allahrakha H Haque E Hsiehchen D 04202110.1001/jamanetworkopen.2021.10109 PMC 812222833988709 · doi ↗ · pubmed ↗
- 3What is the value of market-wide health care price transparency?JAMA Sinaiko AD 1449145032220193148683010.1001/jama.2019.11578 · doi ↗ · pubmed ↗
- 4Price transparency for MR Is increased use of less costly providers and triggered provider competition Health Aff (Millwood) Wu SJ Sylwestrzak G Shah C De Vries A 139113983320142509284110.1377/hlthaff.2014.0168 · doi ↗ · pubmed ↗
- 5Healthcare price transparency in North America and Europe Br J Radiol Araich H Tran J Jung J HornýM Sadigh G 202302369620233766040110.1259/bjr.20230236 PMC 10607402 · doi ↗ · pubmed ↗
- 6Consumers' misunderstanding of health insurance J Health Econ Loewenstein G Friedman JY Mc Gill B 8508623220132387267610.1016/j.jhealeco.2013.04.004 · doi ↗ · pubmed ↗
- 7Significant disparities exist in consumer health insurance literacy: implications for health care reform Health Lit Res Pract Edward J Wiggins A Young MH Rayens MK 083201910.3928/24748307-20190923-01PMC 683150631768496 · doi ↗ · pubmed ↗
- 8A census of state health care price transparency websites JAMA Kullgren JT Duey KA Werner RM 2437243830920132378045410.1001/jama.2013.6557 · doi ↗ · pubmed ↗