Quorum sensing employs a dual regulatory mechanism to repress T3SS gene expression
Payel Paul, Ram Podicheti, Logan J. Geyman, Elizabeth N. Baker, Kai Papenfort, Douglas B. Rusch, Julia C. van Kessel

TL;DR
This study shows how Vibrio campbellii uses quorum sensing to shut down its T3SS at high cell density through two regulatory mechanisms.
Contribution
The paper reveals a new post-translational role of LuxR in repressing ExsA activity via repression of ExsC.
Findings
LuxR represses exsA transcription by binding to the exsBA promoter.
LuxR also represses exsC transcription, reducing ExsA-dependent T3SS activation.
The dual mechanism allows rapid shutdown of T3SS at high cell density.
Abstract
The type III secretion system (T3SS) is a needle-like complex used by numerous bacterial pathogens in host infection to inject exotoxins into the host cell cytoplasm. The T3SS is a known virulence factor in the shrimp pathogen Vibrio campbellii. The ~40 genes comprising the V. campbellii T3SS are regulated by a network of transcription factors in response to changes in the cell’s environment: cell density (quorum sensing; QS), temperature, calcium, and host cell contact. Under positive environmental stimuli, the master T3SS transcription factor ExsA activates the expression of the four structural T3SS operons required for needle formation. Previous studies identified a key role of the master QS transcription factor LuxR: repression of exsA transcription via DNA binding at the exsBA promoter. Here, we uncovered a new regulatory role of LuxR: post-translational repression of ExsA activity…
Genes, proteins, chemicals, diseases, species, mutations and cell lines named across the full text — each resolved to its canonical identifier and authoritative record.
Click any figure to enlarge with its caption.
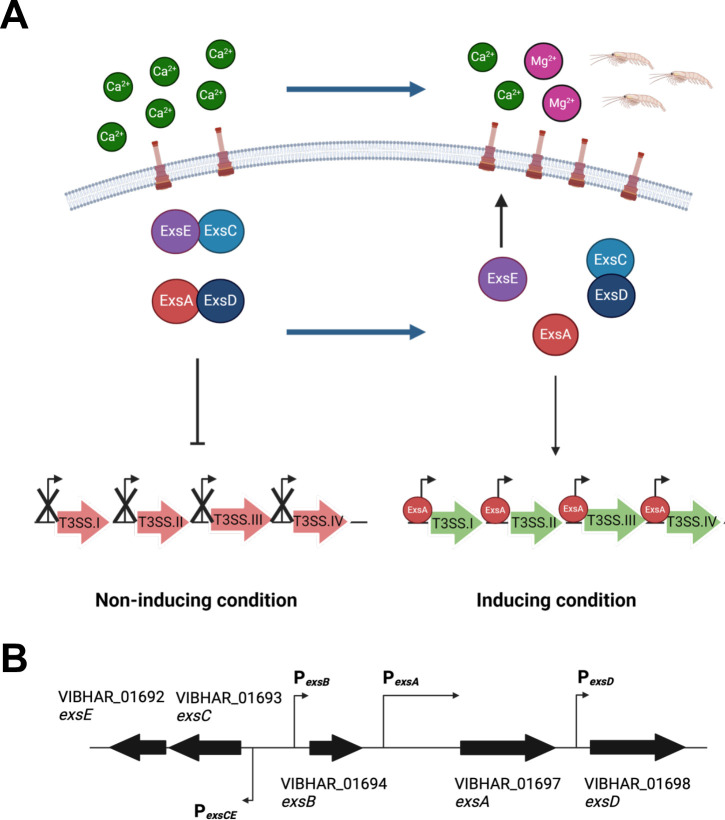 Fig 1
Fig 1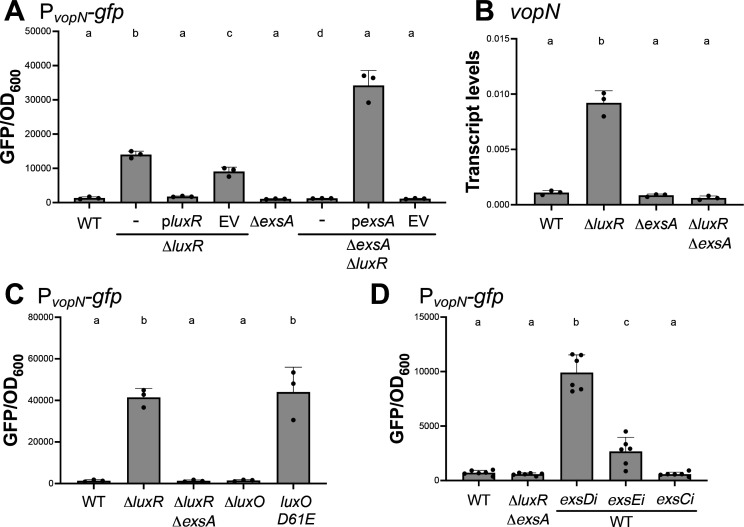 Fig 2
Fig 2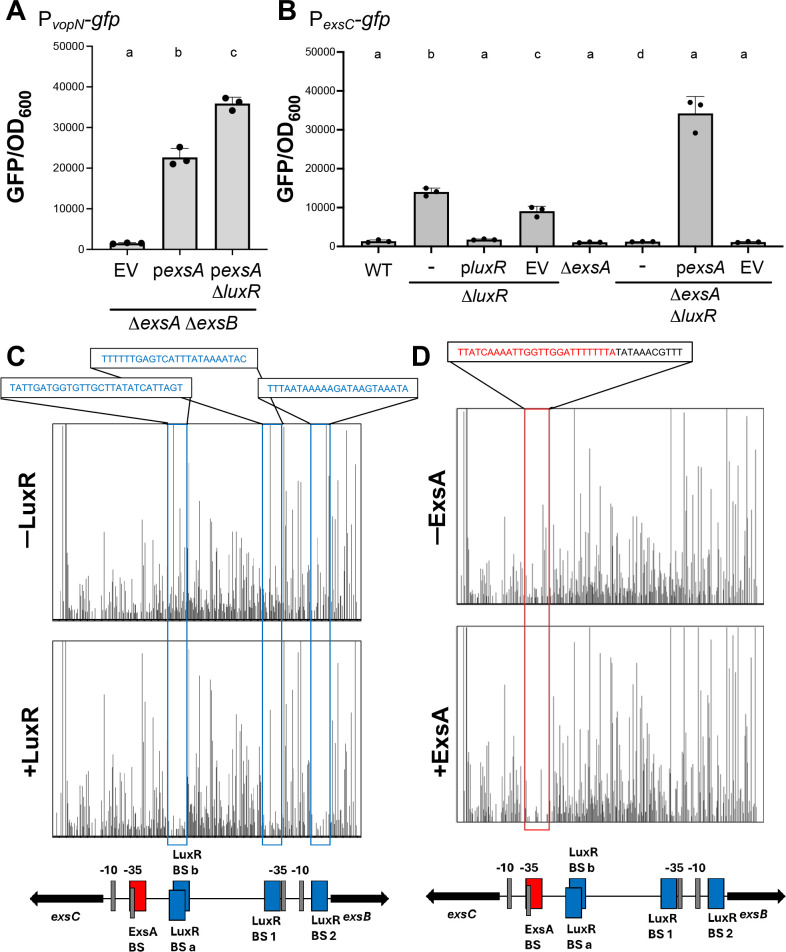 Fig 3
Fig 3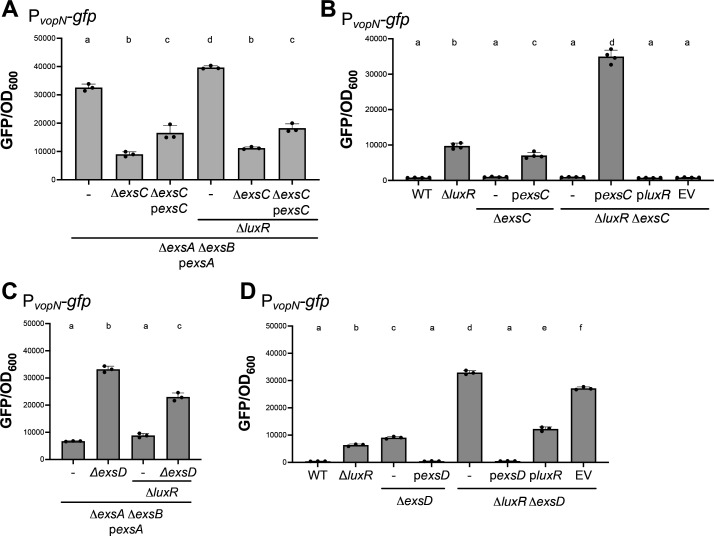 Fig 4
Fig 4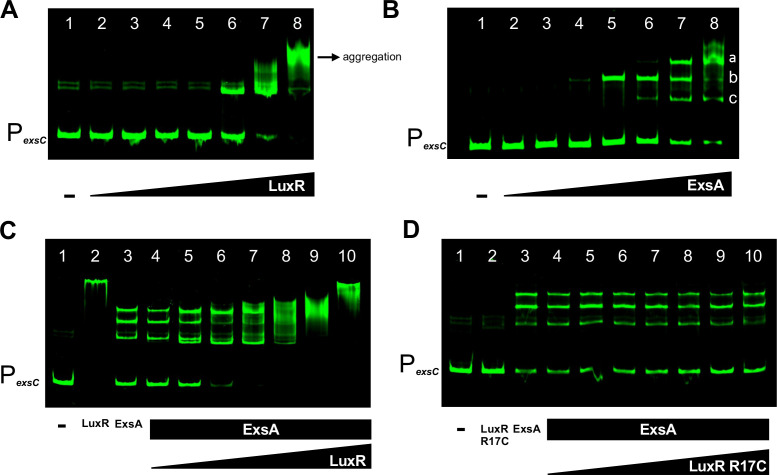 Fig 5
Fig 5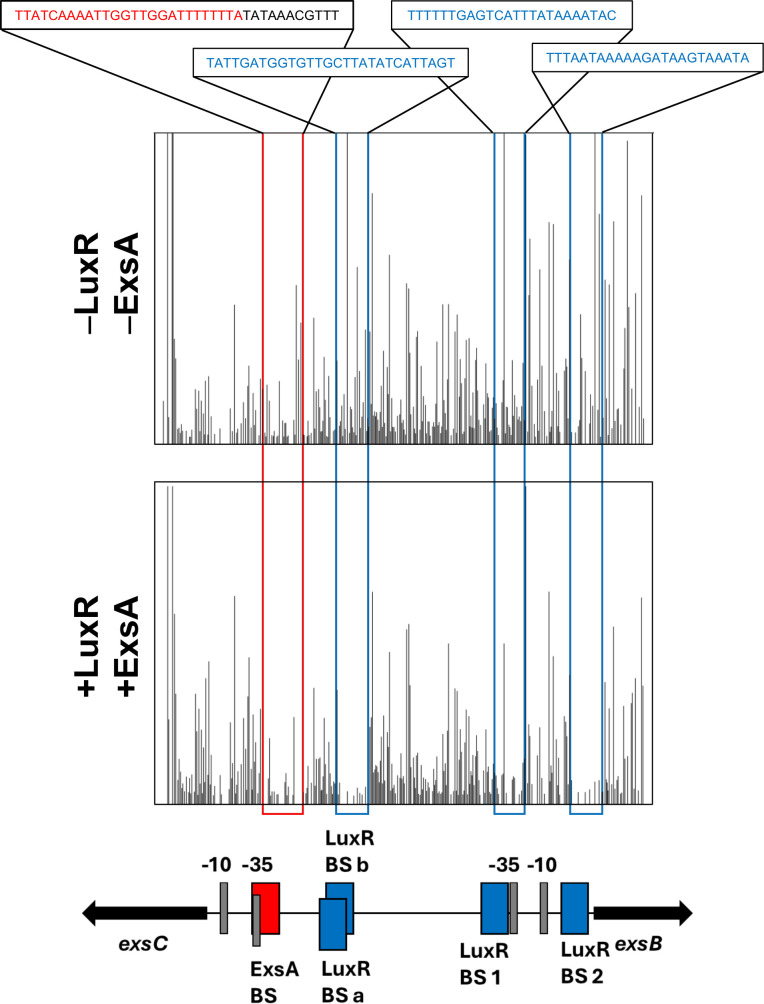 Fig 6
Fig 6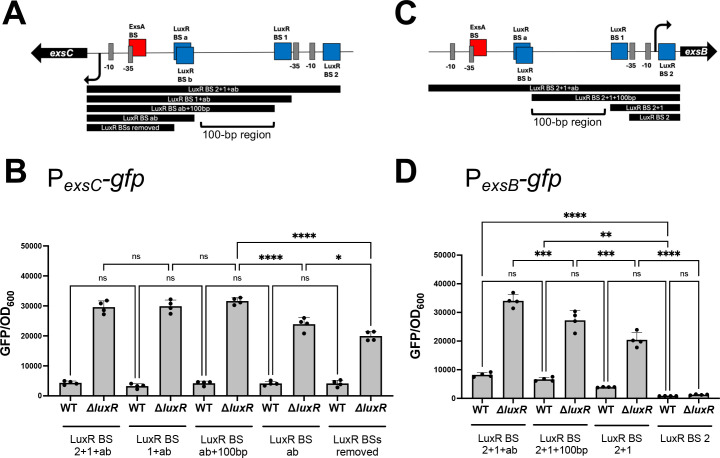 Fig 7
Fig 7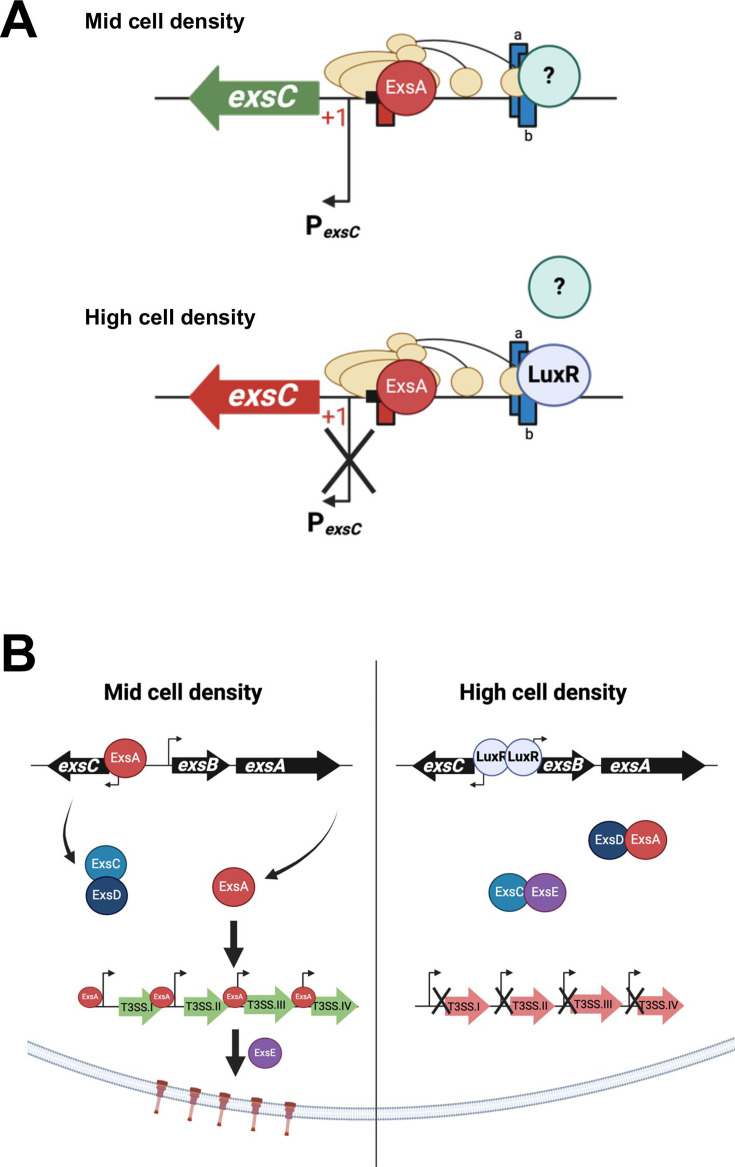 Fig 8
Fig 8- —HHS | National Institutes of Health (NIH)
- —National Science Foundation (NSF)
- —Deutsche Forschungsgemeinschaft (DFG)
- —EC | European Research Council (ERC)
Peer Reviews
No public reviews on file for this paper yet. If you reviewed it on a platform where reviews are public (OpenReview, ICLR, NeurIPS, ICML), you can paste yours below so the community can read it here.
Videos
No videos yet. Explain this paper in a talk, walkthrough, or lecture? Add one.
Taxonomy
TopicsVibrio bacteria research studies · Bacterial biofilms and quorum sensing · Aquaculture disease management and microbiota
INTRODUCTION
Vibrio campbellii is a gram-negative γ-proteobacterium that belongs to the class Vibrionaceae, many of which are recognized as pathogens of aquatic animals, including shrimp, lobster, mollusk, and shellfish. (1–5). Pathogenic strains of V. campbellii are known to cause diseases in shrimp, such as acute hepatopancreatic necrosis disease (AHPND), red spot syndrome, white tail disease, and luminous vibriosis (1, 3, 6–8). In our study, we use V. campbellii BB120 (also known as ATCC BAA-1116, previously classified as V. harveyi) (9) as a model organism to study the mechanisms of virulence in pathogenic strains of V. campbellii.
A major mechanism of virulence in gram-negative pathogens is the type III secretion system (T3SS) machinery, a specialized secretion apparatus which plays an essential role in secretion of extracellular protein toxins. It is a syringe-like membrane-embedded apparatus also called the “injectisome,” which contacts the eukaryotic host cell membrane and injects effector proteins or exotoxins across the membrane and into the host cell (10, 11). Exotoxins compromise the host cell machinery and activate cell lysis through various mechanisms that have been broadly studied in pathogens including Yersinia pestis, Pseudomonas aeruginosa, Salmonella typhimurium, and Vibrio parahaemolyticus (12–17). Certain species of the Vibrionaceae family such as V. parahaemolyticus possess two types of T3SSs encoded by entirely separate sets of structural genes and carrying distinct arsenals of effector proteins (12, 13, 18). The two T3SSs are broadly differentiated based on the target and general mechanism of action of the effector proteins (12, 13, 18).
Previous studies identified a functional T3SS in V. campbellii BB120 and determined that QS negatively regulates T3SS at high population densities (19–21). Furthermore, QS-mediated regulation of T3SS has been shown to be an important virulence factor in V. campbellii infection in shrimp (22). All these published data thus far indicate that the T3SS of V. campbellii BB120 is similar in structure, function, and genetic organization to the T3SS1 of V. parahaemolyticus; V. campbellii BB120 does not encode a T3SS2 (19, 21). Thus, we focus here on T3SS1 function and regulation in V. campbellii and will refer to this system in this manuscript simply as “T3SS.”
Bacterial pathogens regulate the expression of their virulence traits—such as T3SS—in response to external signals to initiate colonization of target tissues, avoid host immune system mechanisms, and persist. In V. parahaemolyticus and P. aeruginosa, the Exs proteins ExsA, ExsD, ExsC, and ExsE establish a regulatory cascade that dictates the activity of the T3SS1 master transcription activator ExsA (23–29) (Fig. 1A). In non-inducing conditions, i.e., the absence of a host cell membrane, or in media containing high levels of calcium and minimal magnesium, ExsA is bound by its anti-activator ExsD, and the T3SS genes are not transcribed by ExsA. Also in this condition, chaperone ExsC binds secretory protein ExsE. ExsE is not secreted while T3SS channels remain closed. Upon sensing inducing conditions, i.e., upon contact with a host cell membrane or the absence/decrease of calcium and addition of magnesium, T3 secretion is induced, allowing ExsE to be secreted by the T3SS (Fig. 1A). Once ExsE is secreted, ExsC is free to bind its other binding partner ExsD, which relieves the repression of ExsA. ExsA is then free to bind the downstream T3SS promoters and activate their transcription (27, 28, 30). In addition to these four factors, the exsB gene clusters with the regulatory exs genes. Gene exsB encodes a pilotin that attaches to the outer membrane and regulates the assembly of the type III secretin on the outer membrane (31). Collectively, the Exs regulatory cascade composes the internal post-translational regulatory system.
Schematic models of the Exs regulatory cascade and the organization of the exs regulatory genes in V. campbellii. (A) Schematic model of the regulatory networks that control T3SS gene expression in other organisms. The diagram shows the current model in the T3SS field in which secretion is induced upon T3SS contact with the host cell membrane during infection or upon chelation of calcium ions from media along with the addition of magnesium. The schematic shows the internal Exs regulatory cascade determined in P. aeruginosa and V. parahaemolyticus, which comprises ExsA, ExsD, ExsC, and ExsE. In the absence of induction, transcriptional regulator ExsA is bound to anti-activator ExsD, and anti-anti-activator ExsC is bound to ExsE. Upon induction of the system, ExsE is exported, freeing up ExsC to bind to ExsD, and ExsA protein is free to bind to T3SS promoters I–IV to activate transcription. (B) The schematic shows gene organization of T3SS regulatory genes exsA, exsB, exsC, exsE, and exsD in V. campbellii BB120 and their corresponding VIBHAR_XXXXX locus tags.
Previous studies of QS regulation showed that LuxR inhibits T3SS gene expression at high cell density through the direct binding of LuxR to the exsB and exsA promoters that drive the expression of exsA, resulting in no production of the T3SS activator ExsA (Fig. 1B) (20, 21). Further, LuxR primarily regulates exsA transcription through the exsB promoter; exsA and exsB are expressed as co-transcripts in V. campbellii (Fig. 1B) (21). In this study, we show evidence that LuxR binds and regulates transcription from both the exsB and exsC promoters in V. campbellii BB120, resulting in a dual mechanism of regulation: i) LuxR represses exsA transcription via the exsB promoter (21), and ii) LuxR regulates ExsA activity post-translationally through repression of exsC transcription. We hypothesize that the dual regulation allows the QS system to shut down the T3SS quickly and efficiently at high cell density.
RESULTS
A reporter assay for measuring T3SS regulation
To formally assess the predicted role of the T3SS regulatory network in our hands, we designed a reporter system to enable rapid quantification of T3SS gene expression. We constructed a reporter with a promoter-less gfp cassette fused to the promoter of vopN, which is also the promoter of the T3SS.II structural operon (Fig. S3A). The reporter operon was integrated into the chromosome of the V. campbellii strain using Tn7 transposition (32). We chose vopN because it is a structural gene regulated by ExsA but with no known role in regulating exsA expression, ExsA activity, or expression of other T3SS genes. As expected from previous studies, LuxR repressed vopN expression, and ExsA was required for activation of expression (Fig. 2A). These differences in vopN-gfp expression were not due to differences in growth rates (Fig. S2). Complementation of luxR under control of an autonomous promoter (Ptactheo-luxR) restored the reporter phenotype to wild-type. Complementation of exsA under Ptactheo in a ΔexsA ΔluxR background activated expression of PvopN to higher levels than the ΔluxR strain (Fig. 2A). The PvopN reporter results were corroborated with RT-qPCR (Fig. 2B). Of note, all assays measuring T3SS expression were induced in liquid media with 15 mM MgSO_4_ to obtain more robust expression of T3SS genes, as described in a previous study (33).
T3SS gene expression can be measured using a PvopN-gfp reporter. (A) GFP reporter assay results are shown for isogenic V. campbellii BB120 strains wild-type (WT), ΔexsA, ΔluxR, and ΔexsA ΔluxR containing the PvopN-gfp reporter (pPP26) and either no additional plasmid (–), the Ptactheo-exsA expression plasmid (pexsA, pPP25) induced with 10 µM IPTG and 1 mM theophylline, the Ptactheo-luxR expression plasmid (pluxR, pPP60) induced with 1 mM IPTG and 1 mM theophylline, or an empty vector control plasmid (EV). (B) RT-qPCR measurements of vopN transcripts from cells collected at HCD (OD600 = 1.0) compared to the internal control hfq gene. The strains assayed were wild-type (WT), ΔexsA, ΔluxR, and ΔexsA ΔluxR. (C) GFP reporter assay results are shown for isogenic V. campbellii BB120 strains wild-type (WT), ΔluxR, ΔexsA ΔluxR, ΔluxO, and luxO D61E containing the PvopN-gfp reporter. (D) GFP reporter assay results are shown for isogenic V. campbellii BB120 strains wild-type (WT) or ΔluxRΔexsA containing the PvopN-gfp reporter. CRISPRi was used to knockdown gene expression in wild-type strains containing plasmids with guide RNAs targeting exsD (exsDi), exsE (exsEi), and exsC (exsCi) via induction with 100 µM IPTG. For panels A–C, the error bars represent the standard deviation of the mean. A one-way analysis of variance (ANOVA) test was performed on normally distributed data (Shapiro–Wilk test), followed by Tukey’s multiple comparisons test. Different letters indicate significant differences between strains in pairwise comparisons (P < 0.05; n = 3). For panel D, the error bars represent the standard deviation of the mean. A one-way ANOVA test was performed on normally distributed data (Shapiro–Wilk test), followed by Tukey’s multiple comparisons test. Different letters indicate significant differences between strains in pairwise comparisons (P < 0.05; n = 6).
We next tested the expression of the vopN reporter in V. campbellii BB120 with genetically locked mutant strains that mimic the low cell density (LCD) and high cell density (HCD) conditions of QS. In Vibrios, the QS cascade involves multiple membrane-bound, histidine-kinase receptor proteins (Fig. S1) (34). In the absence of autoinducers at LCD, phosphorylation of the phospho-transfer protein LuxU by these receptor kinases (unbound by autoinducers) then phosphorylates the response regulator LuxO, which drives transcription of the Qrr regulatory RNAs and leads to LCD gene expression by AphA (35). Conversely, at HCD, autoinducer binding to the membrane-bound receptors reverses the phosphorylation cascade, resulting in unphosphorylated LuxO protein, no Qrr expression, and HCD gene expression by LuxR (34, 35). Thus, we used genetically locked mutant strains to mimic the LCD and HCD states: luxO D61E and ΔluxO strains, respectively (36–40). Of note, it was discovered that previous annotations of luxO in V. cholerae and other Vibrio species were incorrect, and thus previous descriptions of the phosphomimic luxO D47E should have been labeled luxO D61E (37). We also found this to be true for V. campbellii DS40M4 and thus refer to this allele as luxO D61E throughout this manuscript. The luxO D61E strain showed high levels of PvopN-gfp transcription, similar to the ΔluxR strain (Fig. 2C). Conversely, the ΔluxO strain showed diminished levels of PvopN-gfp transcription, similar to the wild-type strain at HCD (Fig. 2C). These patterns aligned with those of all previous studies of the QS regulatory epistasis (19–21).
We next used the reporter assay to test the role of the Exs regulatory cascade comprising ExsA, ExsD, ExsC, and ExsE proteins in the regulation of T3SS in V. campbellii. We designed transcriptional knockdowns of the exs genes using CRISPRi technology (41). In the exsD and exsE knockdown strains, GFP fluorescence from the vopN promoter was significantly increased compared to wild-type (Fig. 2D). This result was expected because, if similar to the V. parahaemolyticus model, a decrease in ExsD protein would free up ExsA protein to enable transcription activation, and a decrease in ExsE would free ExsC to interact with ExsD and thus release ExsA. In the exsC knockdown strain, GFP fluorescence was similar to that of wild-type (Fig. 2D). This result was expected because if the epistasis determined for V. parahaemolyticus is conserved in V. campbellii, a decrease in ExsC would result in more unbound ExsD to bind with ExsA and block transcription activation. We conclude that the effects of ExsC, ExsD, and ExsE knockdowns in V. campbellii follow a pattern that is predicted by the V. parahaemolyticus system.
LuxR regulates the exsC promoter
In V. campbellii BB120, the ~40 genes comprising the T3SS are on a pathogenicity island and are subdivided into four structural operons called T3SS I, II, III, and IV with promoters in front of the vcrG, vopN, vscN, and exsD genes, respectively (Fig. S3A) (19–21). ExsA is required for activation of T3SS gene expression of all four structural operons (21). Given the role of LuxR as a negative regulator of T3SS activation, we wanted to test if LuxR regulates the T3SS exclusively through repression of exsA transcription from the exsBA operon or if there are additional T3SS loci regulated by LuxR. We hypothesized that LuxR represses transcription from the four T3SS structural operons in addition to shutting down exsA transcription from the exsBA operon at HCD. To test our hypothesis, we designed an assay in which exsA transcription and translation were uncoupled from its native promoter, and T3SS gene expression was measured: i) the strain background is ΔexsA ΔexsB, and exsA was expressed ectopically from a plasmid, wherein transcription was under the control of an autonomous IPTG-inducible promoter (Ptac-exsA), ii) translation of ExsA was also regulated through the placement of a theophylline-dependent riboswitch next to the promoter to regulate ribosome binding and translation (Ptactheo-exsA) (42, 43), and iii) the PvopN-gfp reporter described above was used to monitor T3SS gene expression. Using this assay, ExsA expression was induced with 10 µM IPTG and 1 mM theophylline, which resulted in increased GFP production in the Ptactheo-exsA strain compared to the vector control, as expected (Fig. 3A). The observed differences in vopN-gfp expression were not due to differences in growth rates (Fig. S2). To test our hypothesis that LuxR regulates T3SS via another mechanism beyond regulation of exsA, we compared the ΔexsA ΔexsB strain to the ΔexsA ΔexsBΔluxR strain, both in the presence of induced ExsA expression. We observed higher transcription from the vopN promoter in the absence of LuxR compared to the presence of LuxR when ExsA was expressed via an autonomous promoter (Fig. 3A).
LuxR and ExsA bind and regulate exsC. (A) GFP reporter assay results are shown for strains ΔexsAΔexsB and ΔexsAΔexsB ΔluxR containing PvopN-gfp reporter (pPP26) and either the Ptactheo-exsA expression plasmid (pexsA, pPP25) induced with 10 µM IPTG and 1 mM theophylline or an empty vector control plasmid (EV). (B) GFP reporter assay results are shown for strain ΔexsAΔexsB containing the PexsC-gfp reporter (pPP51) and either no additional plasmid (–), Ptactheo-exsA expression plasmid (pexsA, pPP25) induced with 10 µM IPTG and 1 mM theophylline, the Ptactheo-luxR expression plasmid (pluxR, pPP60) induced with 1 mM IPTG and 1 mM theophylline, or an empty vector control plasmid (EV). For both panels, the error bars represent the standard deviation of the mean. A one-way ANOVA test was performed on normally distributed data (Shapiro–Wilk test), followed by Tukey’s multiple comparisons test. Different letters indicate significant differences between strains in pairwise comparisons (P < 0.05; n = 3). (C, D) DNaseI footprinting assays were performed with a 425 bp DNA probe corresponding to the sequence spanning the exsC and exsB promoters. The final concentration of the DNA probe used in the reaction mix was 20 nM. (C) A DNaseI-only treated control reaction (top; -LuxR) was compared with a reaction containing 0.25 µM LuxR (bottom, +LuxR). (D) A DNaseI-only treated control reaction (top, -ExsA) was compared with a reaction containing 1 µM ExsA (bottom, +ExsA). The red boxes indicate the ExsA-binding site (BS), and the blue boxes indicate LuxR BSs a, b, 1, and 2. The gray boxes indicate the −10 and −35 sites.
To test our hypothesis that LuxR binds to the T3SS structural promoters I–IV to regulate transcription, we performed bioinformatic analysis of LuxR binding sites on the BB120 genome (43). However, no binding sites were predicted at the I, II, III, or IV promoters. On the other hand, our bioinformatic analysis identified multiple LuxR sites at the exsB and exsC promoters (Fig. S3B). To further test these results, we performed in vitro DNaseI footprinting assay on the intergenic region between exsC and exsB with LuxR. We also performed differential RNA sequencing (dRNA-seq) to determine the precise position of transcription start sites (TSSs) of the T3SS promoters in V. campbellii (Fig. S3A). We observed DNaseI protection at the two LuxR predicted sites close to the exsB gene and at the two overlapping sites close to the exsC gene, as predicted in our bioinformatic analysis (Fig. 3C). We next constructed an exsC promoter fusion with a promoterless gfp cassette (integrated into the V. campbellii genome via Tn7 transposition) and assayed expression in the presence and absence of luxR. We observed that transcription from the exsC promoter was repressed by LuxR (Fig. 3B); complementation of luxR restored expression to levels similar to the parent strain background. The pattern of regulation of the exsC gene was further corroborated by RT-qPCR (Fig. S3D). From these data, we conclude that LuxR represses exsC.
ExsA activates exsC but not exsBA
The ExsA-binding site is highly conserved across gram-negative species including Pseudomonas aeruginosa, Yersinia pestis, Yersinia enterocolitica, Photorhabdus luminescens, and Aeromonas hydrophila (44, 45). Using the ExsA consensus binding motifs determined in earlier studies by DNaseI footprinting assays in P. aeruginosa, we performed an in silico search for ExsA-binding sites across the T3SS pathogenicity island (Fig. S4A and B) (44, 45). We identified predicted ExsA-binding sites at the promoters of the four T3SS structural operons starting with exsD, vopN, vscN, and vcrG genes (Fig. S4B). Additionally, we found a predicted ExsA-binding site at the exsC promoter; however, no predicted ExsA-binding site was observed at the exsB promoter (Fig. S4B). To test our in silico results, we performed a DNaseI footprinting assay using the same exsC–exsB intergenic region, as tested with LuxR. The assay results showed that ExsA indeed only binds at the exsC promoter at the consensus binding site spanning the −35 site and an A-rich region upstream of it (Fig. 3D). No DNaseI protection by ExsA was observed near the exsB promoter. In addition, we assayed the role of ExsA in the activation of transcription from the exsB promoter via a PexsB-gfp fusion reporter (ectopic reporter on a plasmid backbone) in ΔluxR and ΔexsA ΔluxR strains. As a control, deletion of luxR led to significantly increased GFP expression compared to the wild-type strain, as shown previously (Fig. S4C). However, no significant difference was observed comparing the ΔexsA ΔluxR strain to the ΔluxR strain (Fig. S4C), indicating that ExsA does not impact transcription from the exsB promoter.
We proceeded to test the impact of ExsA binding to its site in the exsC promoter on exsC transcription. We used the PexsC-gfp reporter in the chromosome of a ΔluxR strain (to derepress the promoter) and assessed the effect of deletion of exsA. We observed that the ΔexsA ΔluxR strain had a significantly lower GFP expression compared to ΔluxR (Fig. 3B). Complementation of exsA under an autonomous promoter restored GFP expression to a level higher than that of the ΔluxR parent strain (Fig. 3B). Deletion of the ExsA-binding site in the ΔluxR strain significantly reduced transcription of PexsC-gfp to background levels (Fig. S4D). From these data, we conclude that ExsA binding to its predicted site at the exsC promoter activates transcription of exsC. We also conclude that ExsA does not bind nor activate the exsB promoter.
LuxR post-translationally represses ExsA activity through ExsC
In P. aeruginosa and V. parahaemolyticus, ExsC is a chaperone protein that binds the secretory protein ExsE during noninducing conditions (Fig. 1A). During inducing conditions, ExsE is secreted through the T3SS machinery, which drives the formation of the ExsC–ExsD complex (26, 28). This event releases ExsA, which binds T3SS gene promoters and activates their transcription (26, 28). The activation of exsC expression by ExsA is a regulatory mechanism by which ExsA keeps its anti-activator ExsD bound and sequestered away from itself (26, 28). Thus, we hypothesized that LuxR repression of exsC would promote the ExsA–ExsD interaction, decrease free ExsA protein, and thus decrease transcription of the T3SS structural genes. To test our hypothesis, we first tested the effect of exsC deletion on PvopN-gfp expression. In this experiment, we sought to separate LuxR regulation of exsA transcription and again utilized a background strain in which both exsA and exsB were deleted and exsA was induced from the autonomous Ptactheo promoter (ΔexsA ΔexsB pexsA) using 10 µM IPTG and 1 mM theophylline. We observed that transcription from the vopN promoter was decreased in the absence of ExsC (Fig. 4A), which aligned with the predicted role of ExsC as an anti-anti-activator of ExsA. There was no significant difference comparing GFP expression in the presence or absence of LuxR in the ΔexsA ΔexsB ΔexsC Ptactheo-exsA strain (Fig. 4A), indicating that the effects of LuxR regulation on vopN promoter expression were abrogated in the ΔexsA ΔexsB ΔexsC strain background. Induction of ectopic expression of both ExsA and ExsC using 10 µM IPTG and 1 mM theophylline was able to partially complement the activation of transcription from the vopN promoter, and we observed no significant difference in vopN transcription in the presence and absence of LuxR in the complementation strains (Fig. 4A). Thus, uncoupling LuxR regulation of exsC through ectopic expression of both the exsA and exsC genes completely abrogated LuxR regulation of T3SS.
Deletion of exsC and exsD is epistatic to luxR. (A, B) GFP reporter assay results are shown for isogenic V. campbellii strains all with a ΔexsAΔexsB background and containing either the Ptactheo-exsA expression plasmid (pexsA, pPP25), or the Ptactheo-exsA Ptactheo-exsC double-expression plasmid (pexsA, pexsC, and pPP62), and the PvopN-gfp chromosomal reporter (pPP26). Other isogenic strain mutations include ΔexsC, ΔluxR, and complementation with the Ptactheo-exsC expression plasmid (pexsC, pPP59), Ptactheo-luxR expression plasmid (pluxR, pPP60), or the empty vector control plasmid (EV). ExsA alone/ExsA-ExsC were induced with 10 µM IPTG and 1 mM theophylline, ExsC alone was induced with 100 µM IPTG and 1 mM theophylline, and LuxR was induced with 1 mM IPTG and 1 mM theophylline. (A, B) Error bars represent the standard deviation of the mean. A one-way ANOVA test was performed on normally distributed data (Shapiro–Wilk test), followed by Tukey’s multiple comparisons test. Different letters indicate significant differences between strains in pairwise comparisons (P < 0.05; n = 3 (A) or n = 4 (B)). (C, D) GFP reporter assay results are shown for isogenic V. campbellii strains all with a ΔexsAΔexsB background and containing the Ptactheo-exsA expression plasmid (pexsA, pPP25) and the PvopN-gfp chromosomal reporter. Other isogenic strain mutations include ΔexsD, ΔluxR, and complementation with either the Ptactheo-exsD expression plasmid (pexsD, pPP80), Ptactheo-luxR expression plasmid (pluxR, pPP60), or the empty vector control plasmid (EV). ExsA was induced with 10 µM IPTG and 1 mM theophylline, ExsD was induced with 100 µM IPTG and 1 mM theophylline, and LuxR was induced with 1 mM IPTG and 1 mM theophylline. Error bars represent the standard deviation of the mean. A one-way ANOVA test was performed on normally distributed data (Shapiro–Wilk test), followed by Tukey’s multiple comparisons test. Different letters indicate significant differences between strains in pairwise comparisons (P < 0.05; n = 3).
We believe the partial complementation attained for exsA and exsC double expression via Ptactheo was due to low expression of exsC at the induction used*,* even though exsA was optimally expressed at the same induction (Fig. 4A). To test our hypothesis, we also deleted and complemented exsC in a strain with exsA intact. We induced exsC using higher levels of inducers (100 µM IPTG and 1 mM theophylline). First, we observed that deletion and autonomous expression of exsC in a wild-type background increased GFP expression to a level similar to that of ΔluxR (Fig. 4B). Further, deletion of exsC in the ΔluxR background had low GFP levels, suggesting that even though exsA was derepressed, the absence of ExsC resulted in low vopN transcription. We hypothesize that this is due to excess ExsD protein (free of ExsC) binding up all of the ExsA protein. Also, in a ΔluxR background, deletion and autonomous expression of exsC produced levels of GFP that were maximal (Fig. 4B). These two results suggest that the highest levels of vopN occur in the absence of LuxR and autonomous expression of ExsC. We also assessed the role of ExsD, the putative anti-activator of ExsA. Deletion of exsD in the ΔexsA ΔexsB pexsA strain significantly increased vopN transcription that was independent of luxR (Fig. 4C). Complementation of exsD (induced using 100 µM IPTG and 1 mM theophylline) restored expression to wild-type levels (Fig. 4D). Of note, the expression of luxR in a ΔluxR ΔexsD background decreased vopN transcription to a level similar to that of ΔexsD (although significantly different). From these collective results and those above, we conclude that i) LuxR represses the transcription of exsA and exsC, ii) ExsC activates T3SS gene expression post-translationally, and iii) ExsD represses T3SS gene expression post-translationally. Also, our data show that there are three ways that expression of T3SS structural genes (like vopN) is maximized: i) when exsA is autonomously overexpressed, ii) when exsD is deleted and luxR is deleted, or iii) when exsC is overexpressed and luxR is deleted. Thus, there are two levels of ExsA regulation by LuxR: transcriptional and post-translational.
LuxR and ExsA non-competitively bind to the exsC promoter
We sought to investigate the molecular mechanism by which LuxR represses the exsC promoter. We hypothesized that LuxR blocks or alters ExsA binding to the exsC promoter. To assay this, we first tested binding patterns of LuxR and ExsA using in vitro electrophoretic mobility assays (EMSAs) with a probe corresponding to the exsC promoter (Fig. S3B). LuxR bound the exsC promoter substrate with shifts observed starting at 20 nM LuxR (Fig. 5A). We also observed possible LuxR aggregation at a high concentration of 500 nM (Fig. 5A); this is commonly observed in other published studies of LuxR at >500 nM concentrations on any substrate, including nonspecific DNA sequences (46–48). ExsA bound the exsC promoter with a higher affinity, with a shift in DNA migration observed starting at 7.81 nM protein concentration (Fig. 5B). The binding of ExsA at the exsC promoter shows multiple shifts observed at higher concentrations of the protein (Fig. 5B), possibly indicating DNA binding activity by ExsA. DNA binding by AraC family proteins as a dimer, and subsequent binding of the DNA has been shown in previous studies of ExsA homologs in P. aeruginosa and Y. pestis (44). The DNA-binding pattern of ExsA on the exsC promoter substrate suggests that ExsA binds the exsC promoter strongly. As negative controls, we performed EMSAs with a probe corresponding to the mutS locus to test for LuxR and ExsA specificity. We observed no shift for either ExsA or LuxR at the control locus even at high concentrations of 3 µM and 500 nM, respectively (Fig. S5A and B). To further test for specificity of ExsA binding at the exsC promoter, we performed competitive EMSAs wherein the fluorescently labeled exsC probe was competed with increasing concentrations of either unlabeled mutS probe or unlabeled exsC probe. We observed that ExsA binding at the labeled exsC probe (2 nM concentration) was not disrupted by the unlabeled mutS probe even at a high concentration of 100 nM (Fig. S5C). On the other hand, competing the labeled exsC probe (2 nM concentration) with an increasing concentration of unlabeled exsC probe disrupted ExsA interaction at 20 nM and 100 nM concentrations (Fig. S5D). These results together show that binding of both ExsA and LuxR at the exsC promoter is highly specific.
LuxR and ExsA bind the exsC promoter in vitro. (A–D) Electrophoretic mobility shift assays (EMSAs) were performed with a 200 bp DNA probe corresponding to the exsC promoter. The final concentration of DNA used was 2 nM. Lane 1, DNA probe only control. (A) Lanes 2–8, fivefold dilution series of LuxR from 500 nM to 0.032 nM. (B) Lanes 2–8, fourfold dilution series of ExsA from 2 µM to 0.488 nM. Letters a, b, and c indicate different shifted band patterns. (C, D) Lane 2, LuxR or LuxR R17C alone at 700 nM and 1 µM concentrations, respectively. Lane 3, ExsA alone at 500 nM concentration. Lanes 4–10, ExsA was first added at a concentration of 500 nM, followed by addition of either LuxR in a twofold dilution series from 700 nM to 10.94 nM, or LuxR R17C in a twofold dilution series from 1 µM to 15.625 nM. The original images for each gel have been included in the Fig. S8A through D.
Because we observed that LuxR and ExsA both bound at the exsC promoter, we hypothesized that LuxR represses the exsC promoter by disrupting ExsA binding, which we previously observed to be required for exsC activation. To test our hypothesis, we performed competitive gel shift assays with LuxR and ExsA on the exsC promoter substate (Fig. 5C and D). We performed the competitive gel shift assays in two ways: i) by pre-incubating DNA probe with ExsA and then titrating in LuxR (Fig. 5C, S6B) or ii) by pre-incubating the DNA probe with LuxR and then titrating in ExsA (Fig. S6A). In both cases, we observed shift patterns that suggested co-binding of the probe by ExsA and LuxR instead of competition between the proteins (Fig. 5C; Fig. S6A and B). Conversely, there was no observable change in the ExsA shift pattern when we titrated in increasing concentrations of DNA-binding mutant protein LuxR R17C (Fig. 5D). These results suggest that the binding pattern observed is due to LuxR-specific DNA interactions at the exsC promoter and not due to LuxR interacting solely with ExsA. We next performed competitive DNase I footprinting assays wherein we incubated a DNA probe spanning the exsB and exsC promoters with ExsA, followed by addition of LuxR (Fig. 6). We observed that ExsA remained bound at the exsC promoter even after addition of LuxR (Fig. 6), once again suggesting that LuxR does not disrupt ExsA binding at the exsC promoter. These results disproved our hypothesis that LuxR binding alters ExsA binding at the exsC promoter.
LuxR and ExsA co-bind at the exsC promoter. DNaseI footprinting assays were performed with a 425 bp DNA probe corresponding to the sequence spanning the exsC and exsB promoters. The final concentration of the DNA probe used in reaction mix was 20 nM. DNase I-only treated probe (top) was compared with the probe treated with 1 µM ExsA and 0.25 µM LuxR, followed by DNaseI treatment (bottom). Protection by ExsA was observed along the predicted ExsA-binding site at the exsC promoter proximal to the −35 site. Protection by LuxR was observed along the predicted LuxR-binding site at the exsC and exsB promoters.
Transcription of exsC requires an element upstream of the ExsA binding site
Based on our above results, we next hypothesized that LuxR binding disrupted a different aspect of exsC transcription. This was supported because the LuxR “a/b” sites were 61 bp upstream from the ExsA-binding site. To determine the roles of the multiple LuxR-binding sites in the exsC promoter, we constructed gfp reporter fusions with different lengths of the promoters by sequentially deleting each LuxR-binding site and comparing expression in wild-type and ΔluxR strains (Fig. 7A). Different lengths of the exsC promoter tested showed that there was a decrease in exsC transcription when the intergenic region is missing. Specifically, there is a 100 bp region between the overlapping LuxR binding sites “a/b” and site “1.” When this region was removed from the promoter, a significant reduction in transcription of exsC was observed (Fig. 7B). Deletion of sites “a/b” alone at PexsC also showed a similar phenotype (Fig. S4D). Therefore, we hypothesize that LuxR represses exsC transcription by occluding site(s) important for its maximal activation. However, we can conclude that LuxR binding sites “1” and “2” did not have a role in exsC transcription (Fig. 7B).
LuxR represses exsC and exsB transcription through the promoter-proximal LuxR-binding sites. (A, C) Schematic of different lengths of exsC or exsB promoters fused to the gfp cassette. (B, D) GFP reporter assays with the gfp cassette fused to various lengths of the exsC or exsB promoters shown in (A) and (C). The PexsC-gfp reporters (pPP51, pPP77, pPP83, pPP84, and pPP85) are fused to the chromosome, whereas the PexsB-gfp reporters (pPP07, pPP82, pPP86, and pPP87) are on ectopic plasmids. Error bars represent the standard deviation of the mean. A one-way ANOVA test was performed on normally distributed data (Shapiro–Wilk test), followed by Tukey’s multiple comparisons test. Different letters indicate significant differences between strains in pairwise comparisons (P < 0.05; n = 4).
We also performed a similar experiment testing different lengths of the exsB promoter using a gfp reporter (Fig. 7C). We observed that LuxR-binding sites “a/b” and the 100 bp region between sites “a/b” and site “1” play a role in maximal activation of exsB transcription (Fig. 7D). We also observed that deletion of site “1” completely abrogated exsB transcription (Fig. 7D). Deletion of LuxR-binding sites “1” and “2” individually at PexsB also showed similar phenotypes (Fig. S4C), indicating that these sites are essential for transcription. We hypothesize that this is due to their proximity to the −35 and −10 promoter elements (Fig. 7C). From these results, we conclude that maximal transcription of exsC and exsB requires the presence of the intergenic region between the genes and the absence of luxR. Further, our data collectively indicate that LuxR does not competitively bind with ExsA, but rather that the LuxR “a/b” sites overlap another DNA element required for exsC transcription activation.
DISCUSSION
Our genetic epistasis and biochemical assays have uncovered a new regulatory role of the master QS transcriptional regulator LuxR in controlling T3SS expression: LuxR represses transcription of the gene encoding the anti-anti activator ExsC (Fig. 8B). Our model proposes a dual mechanism of regulation controlling the expression of the T3SS structural genes in response to changes in the cell density, at HCD: i) LuxR represses transcription of exsBA, and thus the master transcription factor ExsA is not produced; ii) LuxR represses transcription of exsC, and the decrease in ExsC protein promotes formation of the ExsD–ExsA complex and thus inactive ExsA protein (Fig. 8B). While LuxR-mediated repression of exsA is the major regulatory mechanism, inactivation of ExsA activity post-translationally does play a quantifiable role in shutting down T3SS at HCD. Our data suggest that this mechanism of regulation is a coherent type II feedforward loop wherein LuxR inhibits ExsA and ExsC separately, both of which act as activators of the T3SS structural genes (49).
Models of the dual mechanism of T3SS regulation by LuxR. (A) Proposed model for activation of exsC transcription by class II activator ExsA and an unidentified class I activator (“?”) at mid-cell density. LuxR binds and displaces the unidentified class I activator by binding to LuxR sites “a/b” at high cell density. B) At mid-cell density, the absence of LuxR (and likely other regulators) enables transcription of the exsC promoter by ExsA, which releases existing ExsA bound by ExsD. ExsA activates transcription of the four T3SS structural operons, enabling synthesis of the T3SS needles. At high cell density, LuxR represses transcription of exsA from the exsBA promoter and represses transcription of exsC. Lower levels of ExsC enable ExsD to bind to ExsA and prevent its activity as a transcriptional activator of T3SS genes.
Our promoter–reporter truncation experiments also strongly indicate the presence of at least one additional activator required for the maximal transcription of exsC. Based on the locations of the ExsA-binding site and the undefined upstream element, we hypothesize that the exsC promoter is activated through two activators at the promoter (illustrated in our model in Fig. 8A): i) ExsA, the promoter-proximal activator that functions as a class II activator as its binding site overlaps the −35 element and ii) an unknown promoter-distal class I activator that contacts the CTD of the α−subunit of RNA polymerase (Fig. 8A) (50). We hypothesize that LuxR repression of the exsC promoter occurs through the disruption of binding of the unidentified class I activator. Further, our results indicate a regulatory role for an unidentified activator at the exsB promoter (Fig. 8A) as well. There are numerous prior studies detailing additional regulators of exsA in Vibrio species. These include the following: i) H-NS, a histone-like nucleotide-binding protein and global regulator of gene expression that represses T3SS transcription by binding along the length of the promoter regions of T3SS1 genes exsE, exsC, exsB, and exsD (27, 47); ii) HlyU, a global activator of virulence genes that relieves repression of DNA transcription by removing H-NS, thereby acting as an activator of T3SS (51); iii) LuxT, a global low cell density (LCD) regulator that activates ExsA expression indirectly by repressing swrZ expression (52); and iv) SwrZ, a regulator of swarming motility repressing ExsA expression (52). It is unclear which of these activators and repressors may be playing roles in exsC expression, although this would be a target for future studies of this intergenic region.
There is apparent homology in the sequence and function of exs genes in Vibrio and Pseudomonas, yet the synteny and regulatory patterns differ in numerous ways (Fig. S6) (26, 27, 33, 44). In both V. parahaemolyticus and V. campbellii, the expressions of exsB and exsA are coupled and distinct from exsCE, whereas in Pseudomonas, exsECB are co-transcribed and distinct from exsA (19–21, 26, 33). In V. parahaemolyticus, ExsA activates its own expression from both the exsB and exsA promoters (33), yet in V. campbellii, ExsA does not activate its own expression based on the data we present in this study. This regulatory mechanism is more similar to that of P. aeruginosa in which transcription from PexsA is activated by global regulators Vfr, Fis, and VqsM, but not ExsA (26). There are also similarities in regulatory patterns among the three organisms. ExsA activates the expression of its own anti-activator ExsD, thereby regulating its own activity through a feedback loop (26, 33). ExsC and ExsE are also activated by ExsA in P. aeruginosa; thus, it would be relevant to test whether V. parahaemolyticus ExsA also activates exsCE.
During our examination of the divergent exsBA and exsCE promoters, we noted that the T3SS promoters differ from other σ70 promoters, in that the spacer sequence between the −10 and −35 sites is longer than the canonical 17 +/– 1 bp length and tends to be closer to 20–22 bp in length instead (Fig. S4A and B). The vopN promoter has the exact −10 and −35 consensus sites for σ70 promoters, TATAAT and TTGACA, respectively (Fig. S4B). The other T3SS promoters have approximately 50% homology to the consensus sites (Fig. S4B). The longer than canonical spacer region in the case of ExsA-regulated promoters is reminiscent of MerR promoters. The MerR promoters have a 19 bp spacer sequence between −10 and −35 sites (53). The binding of MerR to DNA under activating conditions causes a distortion in the DNA backbone so as to reorient the −35 and −10 sites, which allows them to interact positively with the RNA polymerase σ70 subunit (53). We hypothesize that ExsA binding is important to compensate for the weak −35 and −10 sites and the longer than usual spacer sequence. ExsA could be playing a similar role in which it brings the −35 site closer to the −10 site to match the consensus 17 bp spacer region and helps recruit RNA polymerase σ70 subunit to the ExsA-dependent promoters. The exsB promoter with no predicted ExsA-binding site differs from the other T3SS promoters, in that it has the canonical 17 +/– 1 bp spacer sequence between its −35 and −10 sites; also there is a conspicuous lack of the A-rich region upstream of the −35 site, as is present in the other T3SS promoters with predicted ExsA-binding sites.
The ExsA-binding site has two important features, an A-rich region and the −35 site downstream of it with a 13 bp gap in between (Fig. S4A and B). In P. aeruginosa, ExsA binds DNA as a monomer at a half site and recruits a second monomer to bind the other half site, thereby dimerizing post-DNA binding (44). Separate binding events by ExsA monomers followed by dimerization leads to multiple shifts observed in gel shift assays with P. aeruginosa T3SS promoters including PexsC, PexsD, and PexoT (44). Thus, the multiple shifts we observed of ExsA binding at PexsC could be indicative of dimerization or polymerization of ExsA post-DNA binding, leading to DNA twisting or bending for transcription activation (Fig. 5B). The ExsA consensus binding site has been observed at all four structural promoters of the T3SS, indicating the expected necessary role of ExsA in activating transcription from these promoters (Fig. S4B).
The results of our studies here and combined with those of previous studies show that the QS system in V. campbellii shuts down the T3SS at HCD via two separate mechanisms to block ExsA activity: transcriptionally and post-translationally (Fig. 8B). However, the evolutionary advantage for the repression of T3SS synthesis and activity at HCD is unclear. We speculate that the expression of T3SS at low- to mid-cell density is advantageous at some stage during host infection. There is precedence for this: V. cholerae temporally controls virulence during infection (54). At late-stage infection, the V. cholerae QS system shuts down virulence genes and turns on genes that favor cell dispersal either to form new foci of infection in the intestine or to exit the host and re-enter the aquatic environment (54). We postulate that the V. campbellii QS system shuts down virulence in late-stage infection for similar reasons: dispersal of cells to exit the host and re-enter the aquatic environment in search of new hosts to colonize or to continue the planktonic lifestyle. Experimental assessment of these hypotheses may lead to a better understanding of the V. campbellii shrimp infection mechanisms and adaptation to different niche conditions.
MATERIALS AND METHODS
Bacterial strains and media
The E. coli S17-1λpir strain was used for cloning purposes, and the E. coli BL21 (DE3) strain was used for overexpression and purification of all proteins. Escherichia coli strains were cultured at 37°C with shaking (250–275 RPM) in lysogeny broth (LB) medium with 100 mg*/mL kanamycin, 100 mg/mL gentamycin, and/or 10 mg/mL chloramphenicol when selection was required. V. harveyi BB120 was recently reclassified as Vibrio campbellii BB120 (also known as, ATCC BAA-1116) (9). BB120 and derivatives were cultured at 30°C with shaking (250–275 RPM) in Luria Marine (LM) medium with 100 mg/mL kanamycin, 10 mg/mL chloramphenicol, and/or 50 mg/mL polymyxin B when selection was required. Plasmids were transformed into electrocompetent E. coli S17-1λpir* cells and subsequently conjugated into V. campbellii strains. V. campbellii exconjugants were selected using polymyxin B (50 U*/*mL). In case of strains transformed with inducible plasmid pPP25 and pPP62, 10 µM IPTG, and theophylline at concentrations of 10 µM, 100 µM, and 100 µM was used to induce the cells.
GFP reporter assays
Endpoint GFP reporter assays were performed. Bacterial cultures were inoculated in 3 mL LM and 15 mM MgSO4, and grown shaking at 30°C and 275 RPM overnight. About 1 mL of each culture was centrifuged for 3 minutes at 13,000 rpm to pellet down cells. The cell pellets were resuspended in 1 mL 1X saline PBS. The optical density was measured at 600 nm wavelength using either the Biotek Cytation3 plate reader or the Synergy H1 plate reader. The GFP signal was read at 485 nm excitation wavelength and 528 nm emission wavelength. Autogain function was performed for automatic adjustment of the GFP signal per strain per plate assay. The GFP signal obtained was normalized to growth by dividing GFP reads by OD_600_ reads.
Growth curve assays
Bacterial cultures were inoculated in 3 mL LM and grown shaking at 30°C and 275 RPM overnight. Each culture was diluted 1:1,000 in 1 mL LM and 15 mM MgSO_4_. For strains requiring induction, an appropriate concentration of IPTG and theophylline was added. About 200 µL of each culture was pipetted into a clear 96-well plate and grown shaking at 30°C in the Synergy H1 plate reader for 18 hours of overnight growth. The optical density was recorded every 30 minutes measured at a wavelength of 600 nm.
Molecular and chemical methods
PCR was performed using Phusion HF polymerase (New England Biolabs) and Iproof HF polymerase (BioRad). All oligonucleotides were ordered from Integrated DNA Technologies (IDT). PCR products and plasmids were sequenced using Eurofins Genomics. Cloning procedures are available upon request. DNA samples were resolved using 1% agarose (1 × TBE). Unless otherwise noted, data are plotted for triplicate independent experiments. Symbols on graphs represent the mean values, and error bars are standard deviations. Statistical analyses were performed with GraphPad Prism version 10.2.0. Additional information about statistical analyses is included in the figure legends. CRISPRi knockdown constructs were generated as described (41) with targeting small guide RNAs against exsC, exsD, and exsE.
Construction of deletion/epitope-tagged strains
All V. campbellii BB120 and KM669 derivative strains in this study were constructed following a previously published technique (46). Briefly, the pRE112 suicide vector was used to construct unmarked deletions or insertions of epitopes in which 1,000 bp of the upstream and downstream flanking sequence was cloned into pRE112. The pRE112 derivatives were conjugated into V. campbellii and selected on chloramphenicol to induce chromosomal recombination of the plasmid. Subsequently, the plasmid was excised via counterselection on 15% sucrose. Cells in which the plasmid excision yielded a non-WT locus were detected via colony PCR. All gene deletions were confirmed by DNA sequencing through Eurofins.
Expression and purification of LuxR protein
LuxR, His-LuxR, and FLAG-LuxR were purified as previously described (43, 46–48, 55) in BL21(DE3) cells containing either pJV079 (wild-type luxR) or pJV206 (luxR R17C).
Expression and purification of ExsA protein
ExsA was purified by overexpressing N terminal 6X His-tagged ExsA (pPP43 vector ordered from BioTwist) in E. coli BL21(DE3) cells. The purification protocol is a modified version of a previously described protocol (29). The cells were initially grown at 37°C to an OD_600_ = 0.6–0.8, and ExsA overexpression was induced by using 1 mM IPTG for 4 hours. Induced cell pellets were resuspended in lysis buffer (20 mM Tris–HCl pH 8.0, 500 mM NaCl, 20 mM imidazole, 1 × protease inhibitors, 1 mM PMSF, 0.2 mg/mL DNaseI (GoldBio), 1 × FastBreak (Millipore)) and incubated at room temperature for 35 minutes. Tween 20 was added to a final concentration of 0.5% following lysis. The protease inhibitor mix included the following: 0.07 mg/mL phosphoramidon (Santa Cruz), 1.67 mg/mL AEBSF (DOT Scientific), 0.07 mg/mL pepstatin A (DOT Scientific), 0.07 mg/mL E-64 (Gold Bio), and 0.06 mg/mL bestatin (MPbiomedicals/Fisher). The clarified lysate was loaded onto a 5 mL His-Trap Ni-NTA column (GE Healthcare Life Sciences) using an Akta Pure (GE Healthcare Life Sciences). The protein was eluted from the column using a linear gradient of elution buffer (25 mM Tris–HCl pH 8.0, 500 mM NaCl, 500 mM imidazole). Fractions were analyzed by SDS-PAGE to confirm the presence of 6xHis-ExsA and pooled together. Pooled fractions were concentrated using 10 kDa cutoff centrifugal filters (Sartorius) and dialyzed overnight in storage buffer (20 mM Tris–HCl pH 8.0, 500 mM NaCl, 1 mM DTT, 0.5% Tween 20). Dialyzed protein was aliquoted, snap-frozen in liquid N2, and stored at −80◦C.
Electrophoretic mobility shift assays
Primers to amplify over 200 bp of the promoter regions of exsB and exsC were ordered from IDT, where the 5’ end of one primer among the pair was labeled with IRD800CWN. PCR amplification was used to produce promoter substrates. The labeled and amplified DNA probe was incubated for 30 minutes in a 15 mL reaction mixture containing either 20X stock ExsA binding buffer (20 mM Tris [pH 7.5], 100 mM KCl, 2 mM dithiothreitol [DTT], 2 mM EDTA, 5% glycerol), or 10X stock LuxR binding buffer (10 mM HEPES [pH 7.5], 100 mM KCl, 2 mM dithiothreitol (DTT), 200 mM EDTA), 10 ng/mL poly(dI-dC), 0.1 mg/mL bovine serum albumin (BSA), and the desired protein diluted in either ExsA dilution buffer (1X stock ExsA binding buffer), or LuxR dilution buffer (20 mM imidazole [pH 7.5], 3000 mM NaCl, 0.5 mM EDTA, 1 mM DTT, and 5% glycerol). The reaction mixtures were separated on 6% TGE (25 mM Tris, 0.25 M glycine, 1 mM EDTA)-polyacrylamide native gels. Binding reactions were performed using either 20 nM labeled DNA or 20 nM unlabeled, bringing the final concentration of the DNA probe to 2 nM in the reaction. Poly(dI-dC) (10 ng/mL, Sigma) was used as nonspecific competitor DNA in all cases. For competitive binding experiments, reactions were supplemented with the secondary protein in binding buffer and incubated at room temperature for an additional 30 minutes.
qRT-PCR, RNA extraction, and differential RNA-seq
Strains were inoculated in 5 mL LM and grown overnight shaking at 30°C at 275 RPM. Each strain was back-diluted 1:1,000 in LM and 15 mM MgSO_4_ and grown shaking at 30°C at 275 RPM until they reached an OD_600_ = 1.0. Two milliliter cells were collected by centrifugation at 3,700 RPM at 4°C for 10 minutes, the supernatant was removed, and the cell pellets were flash-frozen in liquid N_2_ and stored at −80°C. RNA was isolated from pellets using a TRIzol/chloroform extraction protocol and treated with DNase via the DNA-free DNA Removal Kit (Invitrogen), as previously described. Quantitative reverse transcriptase real-time PCR (RT-qPCR) was used to quantify transcript levels of T3SS genes in different regulatory conditions and was performed using the SensiFast SYBR Hi-ROX One-Step Kit (Bioline) according to the manufacturer’s guidelines. Primers were designed to have the following parameters: amplicon size of 100 bp, primer size of 20–28 bases, and melting temperature of 55°C–60°C. All reactions were performed using a Step-One Real PCR system with 0.4 µM of each primer and 200 ng of template RNA (20 µL total volume). All RT-qPCR experiments were normalized to the internal standard hfq gene. The ΔΔC_T_ or standard curve methods were used to analyze data from at least three independent biological replicates with two technical replicates each.
For dRNA-seq, cells were collected as described above but without MgSO_4_. The cDNA libraries were constructed as described previously (54) by Vertis Biotechnology AG (Freising, Germany) and sequenced using an Illumina NextSeq 500 machine in the single-read mode (75 bp read length). Reads were mapped and transcription start sites determined, as described previously (56). The raw, demultiplexed reads and coverage files have been deposited in the National Center for Biotechnology Information Gene Expression Omnibus with accession code GSE182898.
DNase I footprinting assay
The promoter region for transcription activation of the exsC and exsB genes with LuxR- and ExsA-binding sites in V. campbellii BB120 (425 bp) PCR-amplified using a forward primer with a 5′-FAM fluorescent tag (IDT) and a reverse primer with a 5′-HEX fluorescent tag (IDT). DNase I (NEB) concentration was optimized by assessing the activity of DNase I across a range of concentrations (1 x-1024x, diluted with water), and the optimal concentration for the DNase I enzyme and buffer conditions was determined to be 128-fold dilution. Footprinting reactions were set up in the following conditions: 50 mM Tris-HCl pH 7.5, 10 mM MgCl_2_, 50 mM KCl, 0.1 mg/mL BSA, 1 mM DTT, 5% glycerol, 20 nM DNA probe, and either no protein or 1 µM ExsA or 0.25 µM LuxR or both. Reactions were incubated at room temperature for 15 minutes. Subsequently, 5 µL of DNase I (diluted 128-fold) was added to each reaction and incubated for 15 minutes at room temperature. To stop the digestion reaction, 25 µL 0.5 M EDTA pH 8.0 was added. DNA fragments were recovered using Qiagen MinElute PCR clean-up columns and eluted into black Eppendorf tubes. DNA fragments were analyzed with Genewiz Azenta Life Sciences using their Fragment analysis service and LIZ 500 DNA standard ladder. Peak Scanner software v1.0 was used for data analysis.
Generation of the ExsA consensus binding site
Multiple sequence alignment data for the ExsA-binding site sequences were extracted from the previously published ExsA-dependent promoter sequences and putative T3SS promoter sequences from Pseudomonas aeruginosa, Photorhabdus luminescens, and Aeromonas hydrophila (44) using which a position weight matrix (PWM) was constructed. The PWM was searched against the Vibrio campbellii strain BB120 genome sequence using the FIMO (FInd MOtif) tool (57) from MEME suite version 5.1.0. Using the search hits with qval ≤0.01, the process of PWM construction followed by FIMO search was repeated iteratively until no more additional hits could be found. The sequence conservation among the significant matches to the ExsA motif was visualized as a sequence logo generated using Seqlogo version 2.8 (58).
The reference list from the paper itself. Each links out to its DOI / PubMed record.
- 1Zhang XH, He X, Austin B. 2020. Vibrio harveyi: a serious pathogen of fish and invertebrates in mariculture. Mar Life Sci Technol 2:231–245. doi:10.1007/s 42995-020-00037-z 32419972 PMC 7223180 · doi ↗ · pubmed ↗
- 2Lin LC, Tsai YC. 2022. Isolation and characterization of a Vibrio owensii phage phi 50-12. Sci Rep 12:16390. doi:10.1038/s 41598-022-20831-236180722 PMC 9525291 · doi ↗ · pubmed ↗
- 3Kumar S, Kumar CB, Rajendran V, Abishaw N, Anand PSS, Kannapan S, Nagaleekar VK, Vijayan KK, Alavandi SV. 2021. Delineating virulence of Vibrio campbellii: a predominant luminescent bacterial pathogen in Indian shrimp hatcheries. Sci Rep 11:15831. doi:10.1038/s 41598-021-94961-434349168 PMC 8339124 · doi ↗ · pubmed ↗
- 4Ke H-M, Prachumwat A, Yu C-P, Yang Y-T, Promsri S, Liu K-F, Lo C-F, Lu M-YJ, Lai M-C, Tsai IJ, Li W-H. 2017. Comparative genomics of Vibrio campbellii strains and core species of the Vibrio Harveyi clade. Sci Rep 7:41394. doi:10.1038/srep 4139428145490 PMC 5286417 · doi ↗ · pubmed ↗
- 5Harrison J, Nelson K, Morcrette H, Morcrette C, Preston J, Helmer L, Titball RW, Butler CS, Wagley S. 2022. The increased prevalence of Vibrio species and the first reporting of Vibrio jasicida and Vibrio rotiferianus at UK shellfish sites. Water Res 211:117942. doi:10.1016/j.watres.2021.11794235042073 PMC 8841665 · doi ↗ · pubmed ↗
- 6Srisangthong I, Sangseedum C, Chaichanit N, Surachat K, Suanyuk N, Mittraparp-Arthorn P. 2023. Characterization and genome analysis of Vibrio campbellii lytic bacteriophage OPA 17. Microbiol Spectr 11:e 0162322. doi:10.1128/spectrum.01623-2236719217 PMC 10101143 · doi ↗ · pubmed ↗
- 7Soto-Rodriguez SA, Gomez-Gil B, Lozano R. 2010. “Bright-red” syndrome in Pacific white shrimp Litopenaeus vannamei is caused by Vibrio harveyi. Dis Aquat Organ 92:11–19. doi:10.3354/dao 0227421166310 · doi ↗ · pubmed ↗
- 8Liu J, Zhao Z, Deng Y, Shi Y, Liu Y, Wu C, Luo P, Hu C. 2017. Complete genome sequence of Vibrio campbellii LMB 29 isolated from red drum with four native megaplasmids. Front Microbiol 8:2035. doi:10.3389/fmicb.2017.0203529109705 PMC 5660062 · doi ↗ · pubmed ↗