Contrasting gene expression patterns during floral induction in two Chenopodium ficifolium genotypes reveal putative flowering regulators
David Gutiérrez-Larruscain, Manuela Krüger, Oushadee A. J. Abeyawardana, Claudia Belz, Petre I. Dobrev, Radomíra Vaňková, Kateřina Eliášová, Zuzana Vondráková, Miloslav Juříček, Helena Štorchová

TL;DR
This study compares gene activity during flowering in two Chenopodium ficifolium plants with different light needs, revealing genes that control when they bloom.
Contribution
The study identifies putative flowering regulators through contrasting gene expression patterns in two genotypes with opposing photoperiodic requirements.
Findings
Phytohormone concentrations and most gene expression profiles were similar between the two genotypes during floral induction.
A subset of genes, including homologs of Arabidopsis flowering genes, showed contrasting expression patterns aligned with photoperiodic requirements.
The FLOWERING LOCUS T-LIKE 2–1 gene was activated under long days in one genotype and short days in the other, confirming its role as a floral activator.
Abstract
Chenopodium ficifolium is a close diploid relative of the tetraploid crop Chenopodium quinoa. Owing to its reproducible germination and seedling development, it becomes a promising model for studying floral induction, providing a basis for the comparison with C. quinoa. Two C. ficifolium genotypes differ in photoperiodic requirement: C. ficifolium 283 accelerates flowering under long days, whereas C. ficifolium 459 flowers earlier under short days. This study conducted a comprehensive transcriptomic and hormonomic analysis of floral induction in the long-day C. ficifolium 283 and compared the findings to previous experiments with the short-day C. ficifolium. Phytohormone concentrations and gene expression profiles during floral induction were largely similar between the two genotypes. However, a subset of genes exhibited contrasting expression patterns, aligning with the genotypes’…
Genes, proteins, chemicals, diseases, species, mutations and cell lines named across the full text — each resolved to its canonical identifier and authoritative record.
Click any figure to enlarge with its caption.
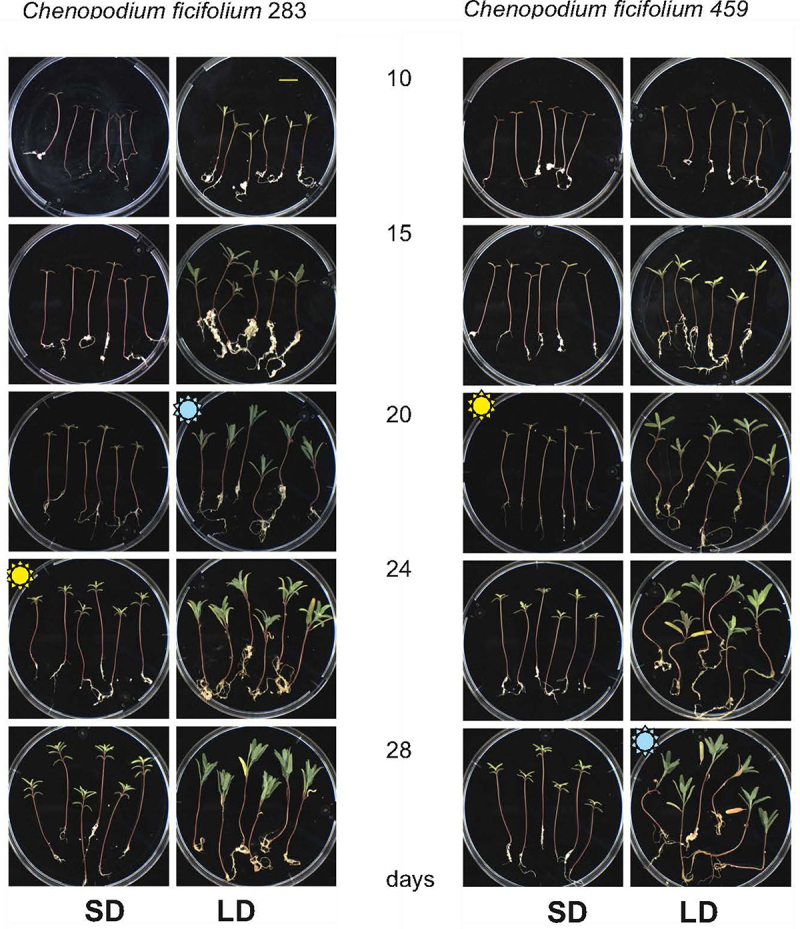 Figure 1
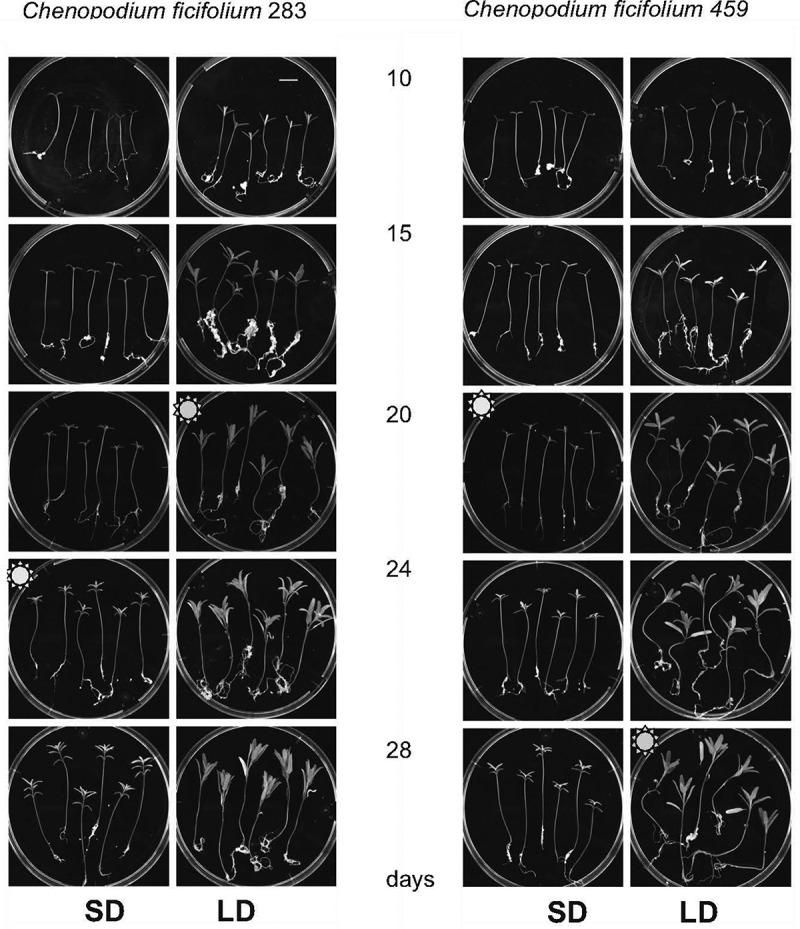 Figure 2
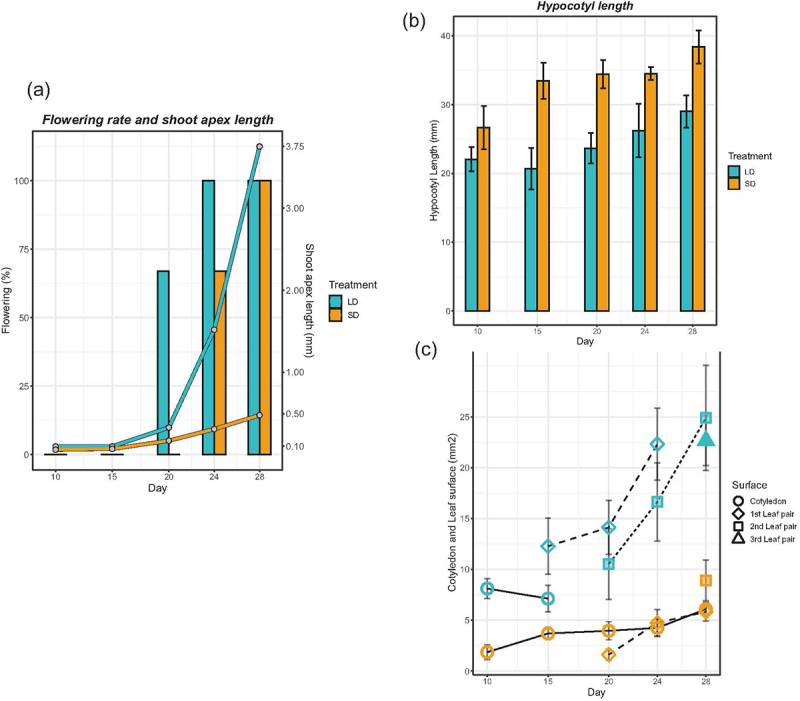 Figure 3
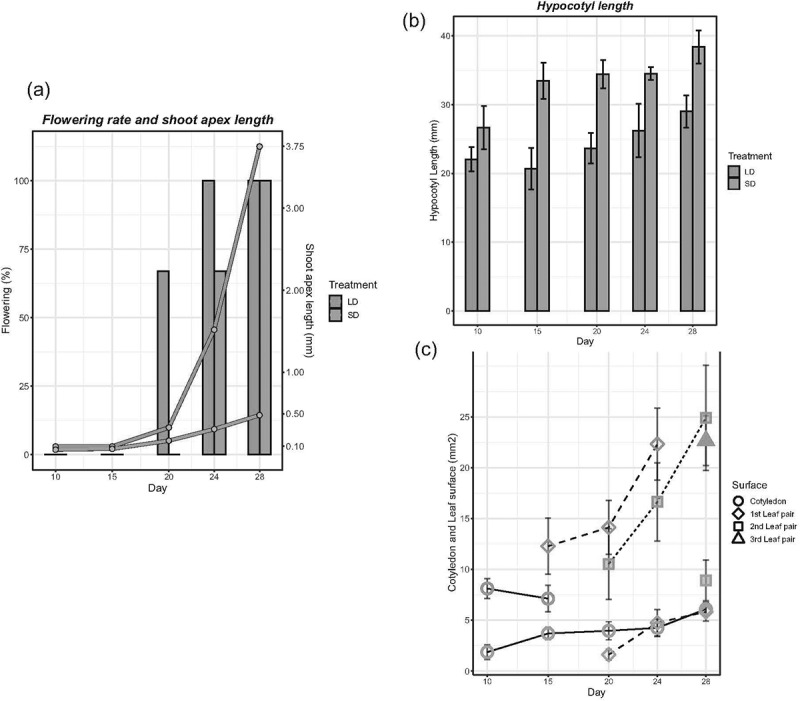 Figure 4
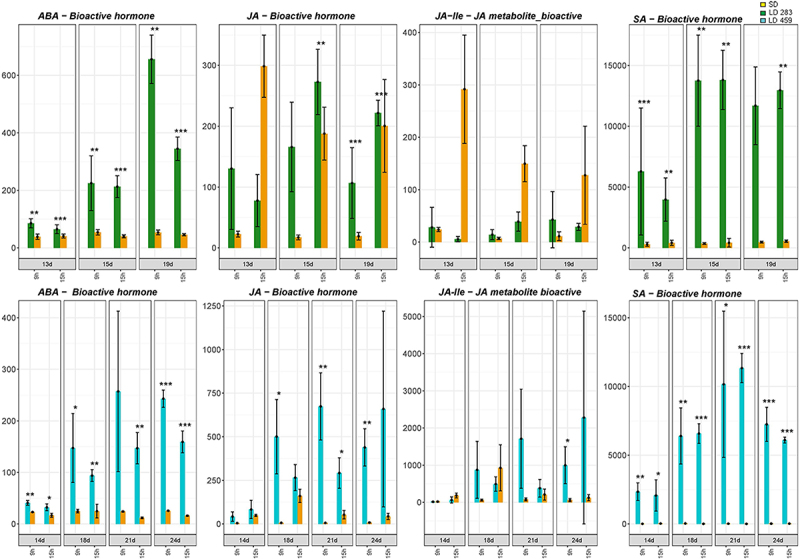 Figure 5
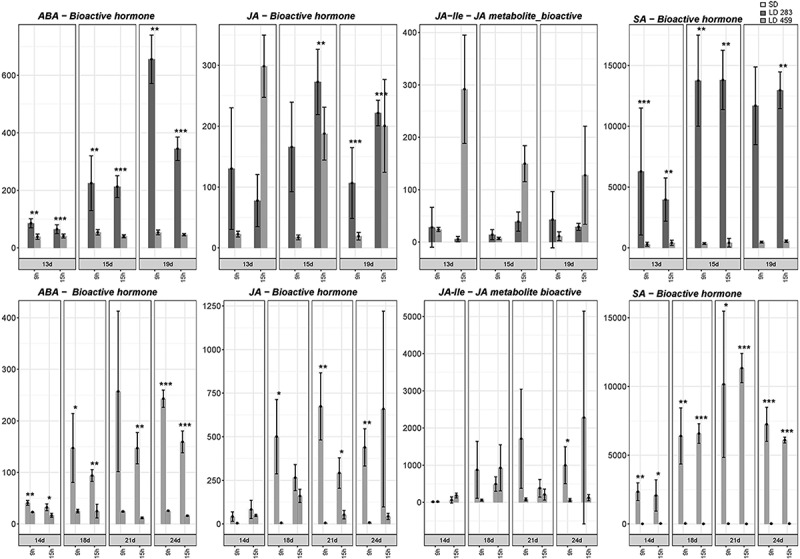 Figure 6
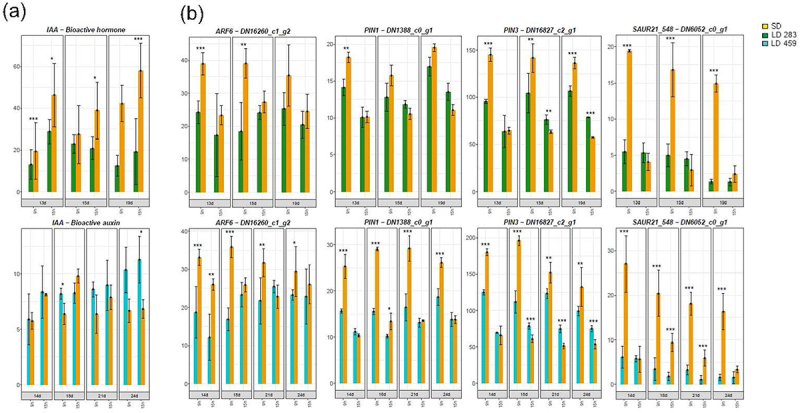 Figure 7
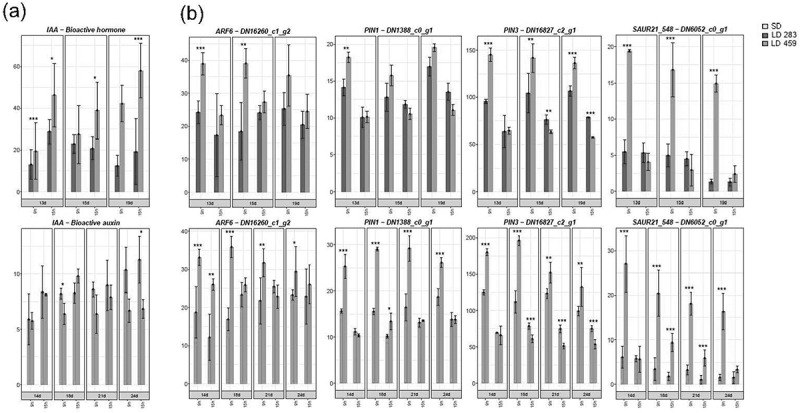 Figure 8
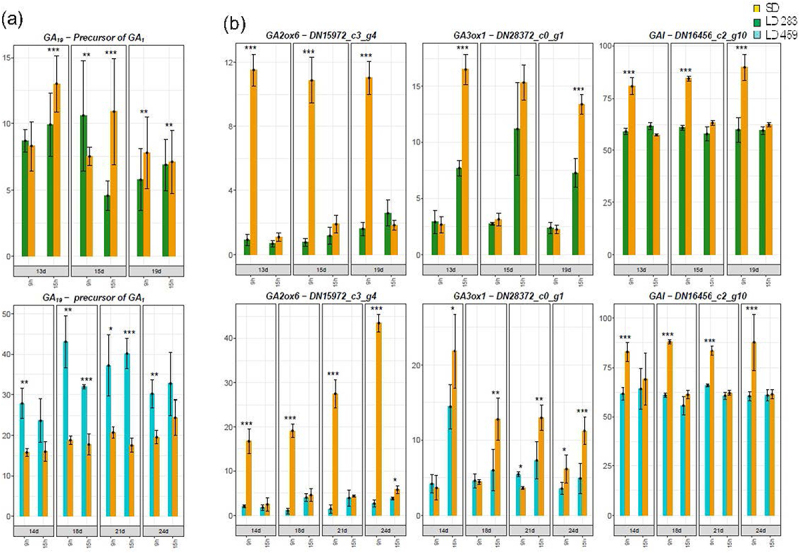 Figure 9
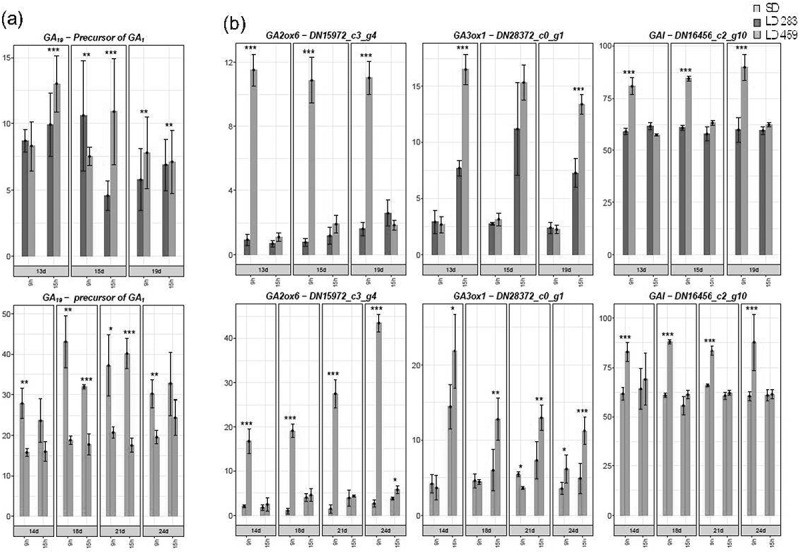 Figure 10
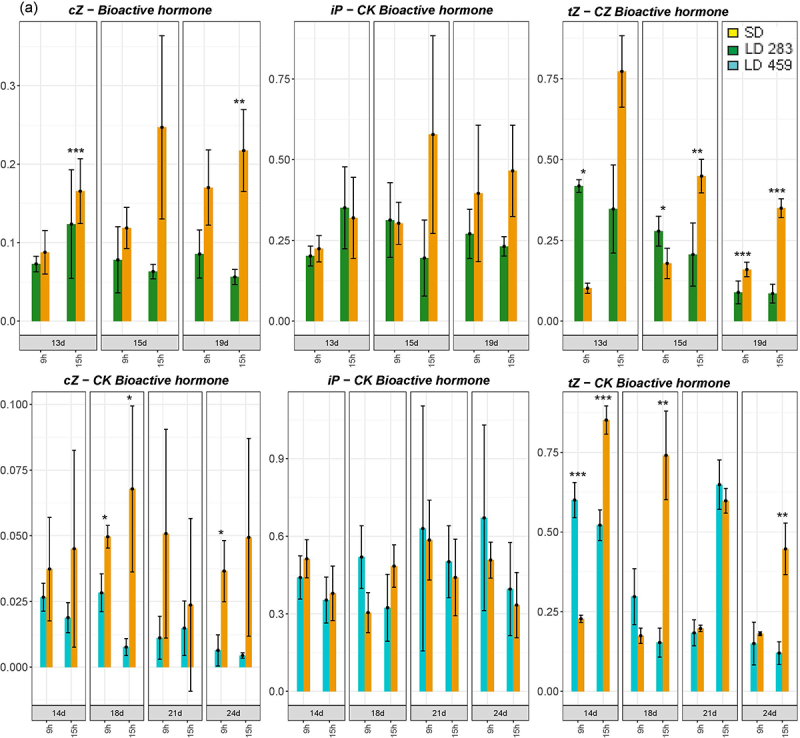 Figure 11
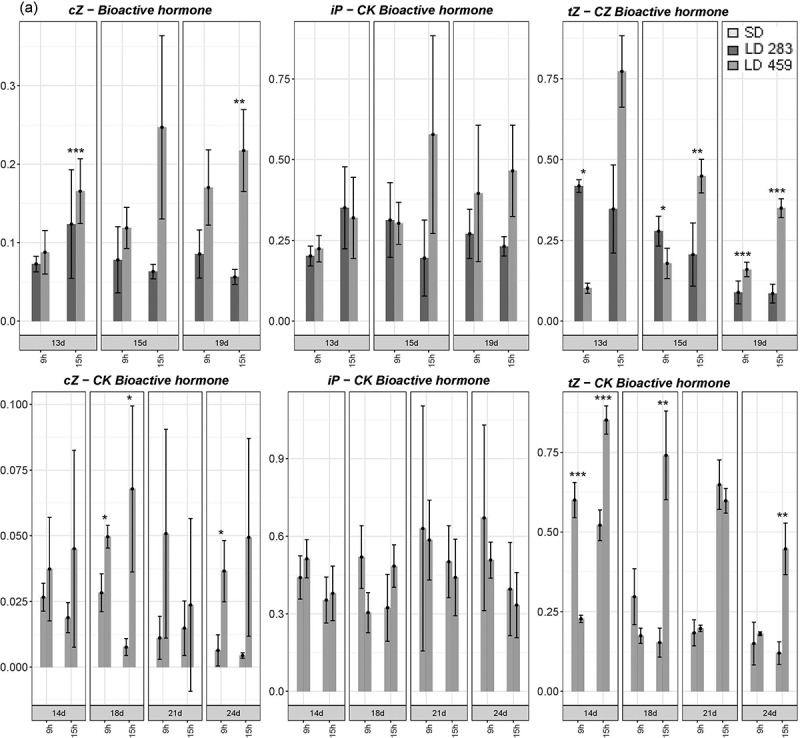 Figure 12
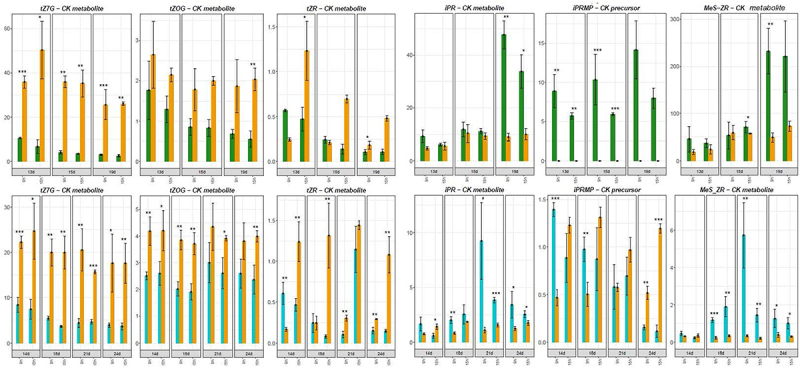 Figure 13
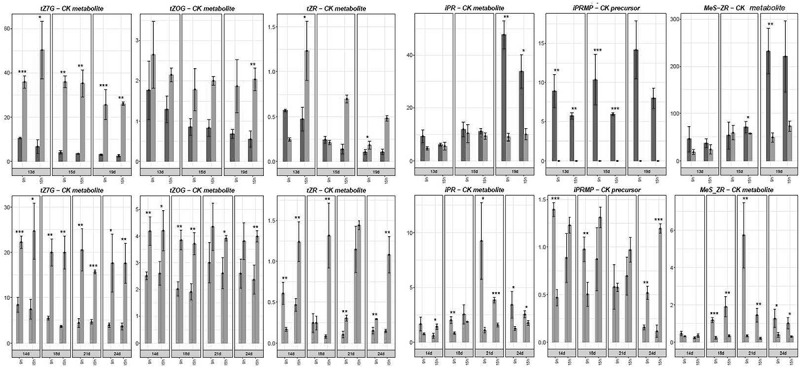 Figure 14
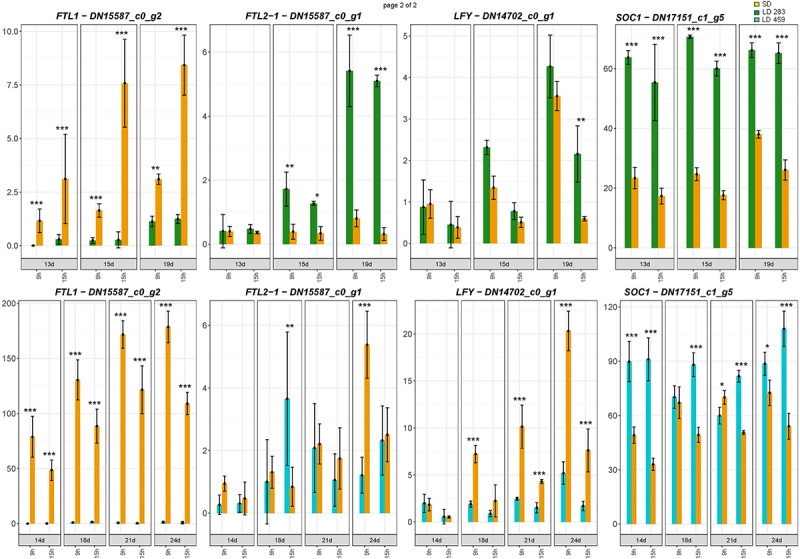 Figure 15
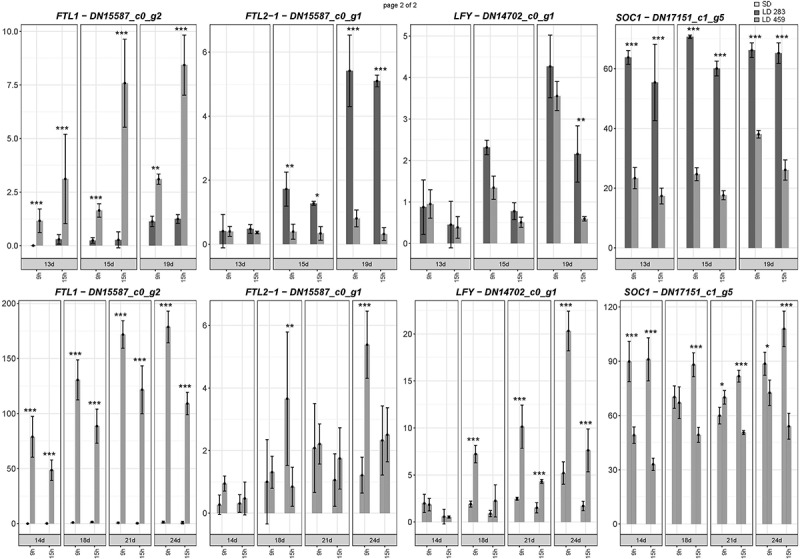 Figure 16
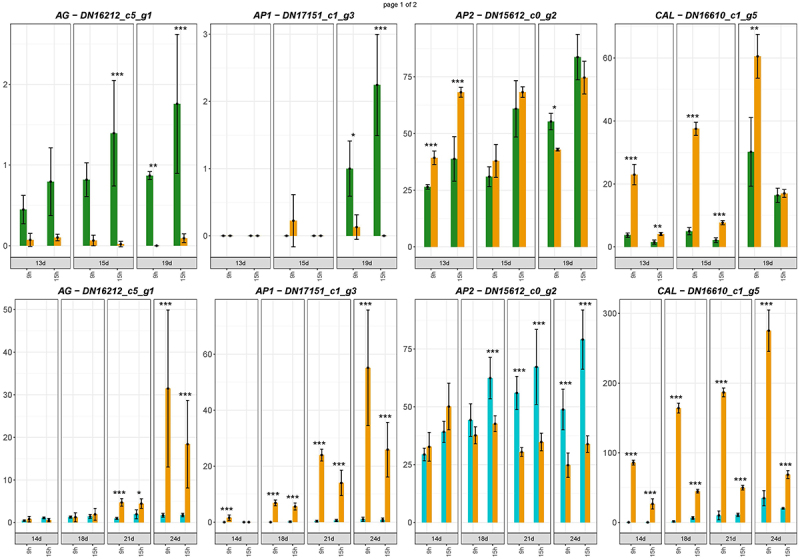 Figure 17
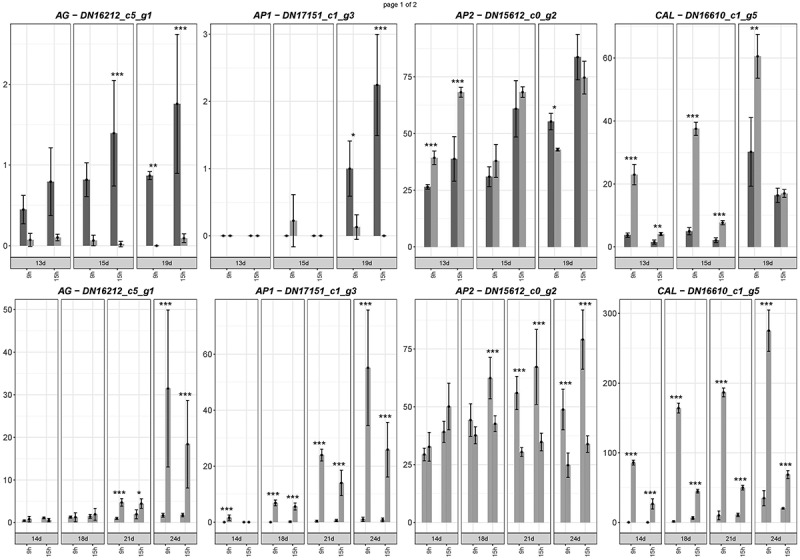 Figure 18
- —Ministerstvo Školství, Mládeže a Tělovýchovy
Peer Reviews
No public reviews on file for this paper yet. If you reviewed it on a platform where reviews are public (OpenReview, ICLR, NeurIPS, ICML), you can paste yours below so the community can read it here.
Videos
No videos yet. Explain this paper in a talk, walkthrough, or lecture? Add one.
Taxonomy
TopicsSeed and Plant Biochemistry · Plant tissue culture and regeneration · Leaf Properties and Growth Measurement
Introduction
The transition from the vegetative to the reproductive phase represents a pivotal commitment in the life cycle of all plant species, holding particular significance for weeds. Weeds must grow and reproduce quickly in freshly disturbed areas, where competition with other plants is temporarily limited.^1^ It is advantageous for them to flower as early as possible because it ensures the production of at least some seeds by the end of summer or within small openings among robust grass tussocks. In contrast, postponing flowering until early summer while accumulating resources allows for the production of a greater number of seeds.
The induction of flowering is regulated by complex genetic signaling pathways that are integrated by essential floral regulators, such as the FLOWERING LOCUS T (FT) genes.^2,3^ Through repeated duplications in the course of evolution, these genes have undergone subfunctionalizations or neofunctionalizations, enabling fine-tuning of regulatory circuits to ensure the optimal timing of flowering. An excellent example is the pair of floral activators, FT and TWIN SISTER OF FT (TSF), in Arabidopsis thaliana. FT promotes flowering under long-day conditions (hereafter LD),^4^ while TSF functions under non-inductive short-day conditions (hereafter SD).^5^ FT paralogs may even acquire the opposite function of floral inhibition, as seen in sugar beet, where the BvFT2 gene activates flowering while BvFT1 suppresses it.^6^ While genetic pathways regulating flowering have been extensively studied in several model plants and crops,^7,8^ pertinent information remains scarce for a vast majority of wild species, including weeds.
The Chenopodiaceae family includes both crops and numerous weedy species. Floral induction has been investigated in sugar beet,^6^ Chenopodium quinoa Willd,^9^ and the weeds Oxybasis rubra (L.) S. Fuentes, Uotila & Borsch [≡C. rubrum L.]^10^ and Chenopodium ficifolium Sm.^11–14^ FT homologs were activated during flowering in all these plant models, with one exception - C. ficifolium 283. This particular accession, collected in Central Europe, exhibited accelerated flowering under LD, despite the notably low expression of all three FT paralogs.^14^ In contrast, another accession, C. ficifolium 459, collected in Central Asia, flowered earlier under SD, concomitant with the activation of CfFTL1.^12,14^ The existence of two conspecific genotypes with distinct photoperiodic responses and apparently different flowering regulation system makes C. ficifolium an ideal model for a comprehensive comparative study of floral induction. As a close diploid relative of tetraploid C. quinoa, C. ficifolium contributes to our understanding of flowering regulation in this crop.
The comprehensive transcriptomic and hormonic study of C. ficifolium 459 confirmed the activation of the floral inducer CfFTL1 at SD and found high concentrations of stress-related phytohormones under LD, when flowering was delayed.^12^ The similar comprehensive analysis of the genotype C. ficifolium 283 with accelerated flowering at LD was still missing. Here, we investigated transcriptomic and hormonal dynamics in the course of floral induction in this genotype. The comparison between C. ficifolium 283 and C. ficifolium 459 revealed the genes activated during floral induction and exhibiting the opposite trends at SD and LD. The most noteworthy was that the CfFTL2–1 gene was only slightly expressed, but its transcription clearly correlated with flowering in a respective genotype. This gene acted as a very strong activator of flowering when expressed in A. thaliana.^11^ Therefore, it should be considered the floral activator in C. ficifolium 283.
Material and methods
Plant material and experimental conditions
2.1.
The accession C. ficifolium 283 collected in the Czech Republic^14^ was used to follow floral induction. The same cultivation conditions as for C. ficifolium 459^12^ were applied to make the comparison possible. The plants were cultivated in the IEB greenhouse and propagated by self-pollination. Floral induction experiments were performed with seedlings grown in 96-well flat-bottom ELISA plates, single plantlet per well; soaked in half-strength Hoagland solution; and placed in Percival E-36L2 (22°C, 70% humidity, cool-white fluorescent light 130 μmol m^−2^ s^−1^, or dark). Two photoperiodic regimes were utilized: SD (6 h light and 18 h dark) and LD (18 h light and 6 h dark), following exactly the same experimental design as it was used with C. ficifolium 459.^12^
To estimate morphological parameters, the images of the whole seedlings, isolated cotyledons, and leaves were examined under Navitar Machine Vision (Navitar Inc., Rochester, NY, USA). The length of the shoot apex and flowering rate were assessed under the stereomicroscope Zeiss Stemi 305. The rate of flowering (in %) was determined as the proportion of plants with terminal flower bud in the whole set of tested plants). The images were recorded using a DFK 33UX250 camera (the Imaging Source, Bremen, Germany) and processed using NIS-Elements 5.0 (Laboratory Imaging, Prague, Czech Republic). About six plants from the specific photoperiodic regime (LD or SD) were measured.
RNA extraction and RT qPCR
2.2.
The seedlings were sampled twice a day (in the morning at 9.00 and in the afternoon at 15.00) and in the days 13, 15, and 19 after sowing (DAS) under both SD and LD. Above-ground parts of the plantlets from each photoperiodic regime were taken and flash-frozen in liquid nitrogen. Three biological replicates consisted of three to five seedlings from LD conditions and eight to ten seedlings from SD conditions and were collected at each time point. Total RNA was isolated using a Plant RNeasy Mini kit (Qiagen, Valencia, CA, USA) exactly as described by Gutiérrez-Larruscain et al.^12^ RNA concentration and quality were checked on 0.9% agarose gel and using the NanoDrop (Thermo Fisher Scientific, Vantaa, Finland).
To prepare cDNA, 1 µg of RNA and oligo dT primers (500 ng) were heated for 5 min at 65°C; put on ice; and mixed with Transcriptor buffer (Roche), 0.5 μl of Protector RNase Inhibitor (Roche, Diagnostics, Mannheim, Germany), 2 μl of 10 mM dNTPs, and 10 units of Transcriptor Reverse Transcriptase (Roche). The first strand of cDNA was produced at 55°C for 30 min. Quantitative PCR was performed using the LightCycler 480 SYBR Green I Master (Roche) in a final volume of 10 μl with 500 nM of each of the primers. The ACTIN11 (ACT11) gene was employed as the reference. The primers for the reference and target genes were described by Štorchová et al.^14^
Phytohormone measurements
2.3.
Aerial parts of the seedlings for phytohormone concentration measurements were sampled simultaneously with the samples for RNA extraction flash-frozen in liquid nitrogen. Three biological replicates (about 20 mg of fresh weight) were taken at each sampling point. The samples were stored at −80°C until the start of phytohormone analyses. The endogenous phytohormone concentrations were determined following the protocols described by Gutiérrez-Larruscain et al.^12^ from about 20 mg of fresh weight (FW) (5–7 seedlings) per sample. Briefly, samples were extracted with 50% acetonitrile/water (1/1, v/v) and a mixture of internal standards was added. After purification using the SPE Oasis HLB plate, phytohormones were quantified by the LC/MS system consisting of UHPLC coupled to a Triple Quadrupole mass spectrometer.
Transcriptome assembly and evaluation
2.4.
Total RNA was extracted from the seedlings collected at six time points under SD and LD and from the leaves, flowers, and roots of adult plants (39 RNA samples in total). The RNA specimens were sent to Macrogen (Seoul, Korea), where strand-specific cDNA libraries were constructed after polyA enrichment. The sequencing on the Illumina NovaSeq6000 produced 712 million raw paired-end (PE) reads (150 nt) altogether, about 18.7 million reads per specimen. Error correction, ribosomal RNA filtering, and quality trimming (cutoff 145 nt) were performed as described previously,^12^ and left 547 million trimmed pair-end reads. The raw and resulting trimmed data were stored under the BioProject number PRJNA891916 with SRA accessions SRR21998980–SRR21999010 for the raw reads and accessions SRR22032070–SRR22032100 for the trimmed reads.
Eleven transcriptomic sets (about 550 milions of trimmed reads) were de novo–assembled with Trinity v.2.9.0.^15^ The redundancy of the assembly was decreased by CD-Hit (similarity cutoff 99.9%) and then with the script EvidentialGene tr2aacds.pl (MINCDS = 50). The BUSCO^16^ search found 92% complete groups and the decrease of duplicated groups from 45% in the original Trinity assembly to 4% after the EvidentialGene application. The number of Trinity ‘genes’ dropped down to 35,565 in the EvidentialGene assembly. This set was used for a Blastx (BLAST +2.9.0) search against the nr database The cutoff E-value was set to *<*10^−4,^ and the maximum number of allowed hits was 10. The results were imported into the MEGAN pipeline^17^ and only plant hits were maintained. This Transcriptome Shotgun Assembly project has been deposited in DDBJ/EMBL/GenBank under the accession GKDG00000000. The version described in this paper is the first version, GKDG01000000.
2.5. Transcriptome annotation, read mapping and DEG identification
The de novo assembled transcriptome constructed from C. ficifolium 283 (GKDG01000000) contained 21,670 predicted Trinity ’genes’ and 25,671 predicted Trinity ‘transcripts’. The OmicsBox program v. 1.3.3 (BioBam Bioinformatics S.L., Valencia, Spain) was then used to annotate the Trinity ‘genes’ based on gene ontology (GO) terms, InterProScan, and nr database annotation. As C. ficifolium is closely related to C. quinoa, all the predicted Trinity ‘genes’ often gave blastx hits with the C. quinoa annotated genome.^18^ 75% of the ‘genes’ were GO (Gene Ontology) annotated, while 5% of the ‘genes’ were GO mapped.
The clean Illumina reads produced in the current floral induction experiment with C. ficifolium 283 were mapped against the de novo transcriptome. The transcript coverage was analyzed with the Trinity pipeline using the alignment-free method Salmon,^19^ as described in Krüger et al.^20^ The differential gene expression analysis was performed with the Bioconductor package DESeq2,^21^ three biological replicates for each sampling time point. Detection of differentially expressed genes (DEGs) was done for each sampling point, comparing the LD with the SD conditions with 0.05 cutoff for the false-discovery rate (FDR). The resulting DEGs and the log2fold change (logFC) values were used further.
The same reference transcriptome was also used to map the trimmed Illumina reads obtained during the previous floral induction experiment with C. ficifolium 459.^12^ About 85% of the reads from C. ficifolium 283 and a similar proportion of the reads of C. ficifolium 459 were mapped against this reference.
The search for the genes with the contrasting expression pattern between C. ficifolium 283 and C. ficifolium 459
2.6.
In C. ficifolium 283, the genes involved in floral induction should be upregulated under LD conditions. In contrast, in C. ficifolium 459, we expect these genes to be upregulated under SD conditions, according to each photoperiod requirements. Therefore, we were interested in the genes with contrasting responses to different photoperiods.
To reveal these expression tendencies, the trimmed Illumina reads generated in the floral induction experiment with C. ficifolium 459^12^ were mapped against the new C. ficifolium 283 reference transcriptome to compare the gene expression patterns during floral induction between the two accessions.
To account for diurnal gene expression variations, we separately analyzed morning and afternoon expression data, resulting in “morning” and “afternoon” datasets.
We compared the second and third sampling points in C. ficifolium 283 (day 15 and day 19) and the third and fourth sampling points in C. ficifolium 459 (day 21 and day 24). These time points corresponded to the time window when the plantlets were either induced to flower under permissive conditions or not induced under non-permissive conditions.
To identify the genes with contrasting response to the photoperiod between the two C. ficifolium accessions, we extracted logFC values for differentially expressed genes (DEGs) from the pairwise comparisons between LD and SD regimes at the specific time points. We ranked these DEGs based on their logFC values, from highest (more highly expressed in LD) to lowest (more highly expressed in SD) in C. ficifolium 283 and vice versa in C. ficifolium 459. We assigned rank numbers to these genes, starting with 1 for the most highly differentially expressed gene.
Finally, we summed the rank numbers from the two sampling points (second and third in C. ficifolium 283, and third and fourth in C. ficifolium 459). Genes were then reordered based on this sum, from lowest to highest. Genes with the lowest rank numbers exhibited the most contrasting response to photoperiod between the two accessions. They were activated by LD in C. ficifolium 283 and, conversely, by SD in C. ficifolium 459, in line with each accession’s photoperiod requirement for flowering.
Results
The comparison of the growth and floral transition between C. ficifolium 283 and C. ficifolium 459
3.1.
The morphological and anatomical changes in seedlings were closely monitored during floral induction for both C. ficifolium 283 and C. ficifolium 459. These two accessions were cultivated and induced to flowering under identical conditions.^12^ Notably, the growth patterns of both C. ficifolium genotypes were highly similar (Figure 1). Under SD conditions, the plantlets of C. ficifolium 283 exhibited a slender and elongated hypocotyl (Figure 2b). However, they became more robust and developed larger leaves under LD (Figure 2c), similar to the growth of C. ficifolium 459 conditions.^12^ Figure 1.The comparison of C. ficifolium 283 and C. ficifolium 459. Seedlings were cultivated under short (SD) and long days (LD) at the ages 10 to 28 days after sowing (DAS). The yellow flower sign marks the onset of flowering at SD, and the blue flower signs marks the onset of flowering at LD. Figure 2.(a) The shoot apex length and proportion of the plants of C. ficifolium 283 with visible flower buds at the age 10 to 28 DAS at LD and SD. (b) The hypocotyl length in C. ficifolium at the ages of 10 to 28 DAS at LD and SD. (c) The cotyledon and leaf surface of C. ficifolium at the ages of 10 to 28 DAS. The third leaf pair (triangle) appeared under LD only. The cotyledons were lost before the age 20 DAS under LD, but persisted under SD.
Nevertheless, the two genotypes diverged in terms of the onset of flowering, as noted in previously.^14^ Specifically, C. ficifolium 283 initiated flowering at about 20 days after sowing (DAS) under LD conditions but delayed by approximately four days under SD (Figure 1). This consistent delay in flowering under SD, as compared to LD, was confirmed through three independent experiments (Figure 2a). In contrast, the flowering of C. ficifolium 459 was accelerated at SD.^12^
3.2. Phytohormone contents and phytohormone related gene expression in C. ficifolium 283 compared to C. ficifolium 459
The content of phytohormones and the expression of genes related to phytohormone metabolism and signaling were examined in both C. ficifolium 283 and C. ficifolium 459. Remarkably, the dynamics was either similar or identical between the two genotypes. There was a significant increase in the stress-related phytohormones abscisic acid (ABA), jasmonic acid (JA), and salicylic acid (SA) under LD conditions (Figure 3). Correspondingly, the expression levels of the genes responsible for the biosynthesis of ABA, JA, and SA also increased under LD in both genotypes (Supplementary Figures S1–S3). Figure 3.The concentrations of abscisic acid (ABA), jasmonic acid (JA), ja-isoleucine (JA-Ile), and salicylic acid (SA) in C. ficifolium 283 at the ages of 13 to 19 DAS and in C. ficifolium 459 at the ages of 14 to 24 DAS. Green or blue columns correspond to long LD treated samples, and golden ones represent SD treated samples. Transverse lines at each dot (median value of three biological replicates) represent standard deviation. Statistical significance (p-values * < 0.05, ** < 0.01, and ***< 0.001; t-test; three biological replicates, each consisting of 5 to 7 seedlings) between pairs of differentially treated samples is represented by asterisks. The x-axis represents sampling points (two sampling points per day: morning − 9.00 and afternoon − 15.00). The y-axis represents phytohomone concentration measured as pmol per gram of fresh weight.
The bioactive auxin indol-3-acetic acid (IAA) concentration slightly increased at LD in C. ficifolium 283, while a similar slight elevation was observed at SD in C. ficifolium 459 (Figure 4a). Importantly, the expression profiles of auxin-related genes were highly similar in both genotypes (Figure 4b). Figure 4.The auxin (AUX) concentrations and aux-related gene expression in C. ficifolium 283 at the age 13 to 19 DAS and in C. ficifolium 459 at the age 14 to 24 DAS. Green or blue columns correspond to long LD-treated samples, golden ones represent SD-treated samples. Transverse lines at each dot (median value of three biological replicates) represent standard deviation. Statistical significance (p-values * < 0.05, ** < 0.01 and ***< 0.001; t-test; three biological replicates, each consisting of 5 to 7 seedlings) between pairs of differentially treated samples is represented by asterisks. The x-axis represents sampling points (two sampling points per day: morning − 9.00 and afternoon − 15.00). (a) Bioactive auxin (IAA) concentrations. The y-axis represents phytohomone concentration measured as pmol per gram of fresh weight. (b) The expression of AUXIN RESPONSE FACTOR 6 (ARF6), PIN-FORMED 1 (PIN1), PIN-FORMED 3 (PIN3), and SMALL AUXIN UPREGULATED RNA 21–548 (SAUR21–548). The y-axis represents relative expression in transcript coverage (TMM).
Because the concentrations of bioactive gibberellins in C. ficifolium 283 were below the detection limit, we only compared the levels of the precursor GA_19_ between the genotypes. We observed a slight elevation at LD in C. ficifolium 459, while no such increase was seen in C. ficifolium 283. The expression profiles of the gibberellin-related genes were closely aligned between the two genotypes (Figure 5). Figure 5.The gibberellic acid (GA) concentrations and GA-related gene expression in C. ficifolium 283 at the age 13 to 19 DAS and in C. ficifolium 459 at the age 14 to 24 DAS. Green or blue columns correspond to long LD-treated samples, and golden ones represent SD-treated samples. Transverse lines at each dot (median value of three biological replicates) represent standard deviation. Statistical significance (p-values * < 0.05, ** < 0.01, and ***< 0.001; t-test; three biological replicates, each consisting of 5 to 7 seedlings) between pairs of differentially treated samples is represented by asterisks. The x-axis represents sampling points (two sampling points per day: morning − 9.00 and afternoon − 15.00). (a) GA_19_ concentrations. The y-axis represents phytohomone concentration measured as pmol per gram of fresh weight. (b) The expression of GA2ox6 (involved in GA degradation), GA3ox1 (involved in GA biosynthesis), and GIBBERELLIC ACID INSENSITIVE (GAI). The y-axis represents relative expression in transcript coverage (TMM).
Bioactive cytokinins (CKs) exhibited a slight increase under SD conditions in both genotypes (Figure 6a). The genes involved in CK metabolism also displayed increased expression (Supplementary Figure S4, S5). Interestingly, the concentration profiles of some CK derivatives differed between the genotypes. The concentration of the isopentenyl adenosine (iP) precursor isopentenyl adenosine monophosphate (iPRMP) was 10 times higher under LD in C. ficifolium 283 than in the 459 genotype, which correlated well with floral induction accompanied by promotion of cell division. Similarly, the levels of CK precursors were much higher under LD in C. ficifolium 283 (Figure 6b). Figure 6.The cytokinin (CK) concentrations in C. ficifolium 283 at the age 13 to 19 DAS and in C. ficifolium 459 at the age 14 to 24 DAS. Green or blue columns correspond to long LD-treated samples, and golden ones represent SD-treated samples. Transverse lines at each dot (median value of three biological replicates) represent standard deviation. Statistical significance (p-values * < 0.05, ** < 0.01, and ***< 0.001; t-test; three biological replicates, each consisting of 5 to 7 seedlings) between pairs of differentially treated samples is represented by asterisks. The x-axis represents sampling points (two sampling points per day: morning − 9.00 and afternoon − 15.00). The y-axis represents phytohomone concentration measured as pmol per gram of fresh weight. (a) The concentrations of bioactive CKs: cis-zeatin (cZ), isopentenyladenine (iP), and trans-zeatin (tZ). (b) The concentrations of CK derivatives: trans-zeatin N7-glucoside (tZ7G), trans-zeatin *O-*glucoside (tZOG), trans-zeatin riboside (tZR), isopentenyladenosine riboside (iPR), isopentenyl adenosine monophosphate (iPRMP), and 2-methylthiozeatin riboside (MeS-ZR). Figure 6. (Continued).
The overall concordance of gene expression profiles between the two C. ficifolium genotypes extended to other genes, for example, stress-related ones (Supplementary Figure S6). It greatly facilitated the identification of rare exceptions – the genes with opposite expression profiles, which could potentially play a role in the control of flowering.
The identification of genes with contrasting expression pattern between C. ficifolium 283 and C. ficifolium 459
3.3.
The genes promoting floral induction in two genotypes with distinct photoperiodic requirements are expected to respond to the SD and LD in the opposite way. They should be activated by SD in C. ficifolium 459, but by LD in C. ficifolium 283. The profiles of the genes differentially expressed between the LD and SD in C. ficifolium 283 and C. ficifolium 459 were compared separately in the “morning” and “afternoon” datasets, and the genes with too low or fluctuating expression were excluded. 26 “morning” and 24 “afternoon” genes with contrasting expression profiles between the two genotypes were identified. As 15 genes exhibited opposite expression in both “morning” and “afternoon” datasets, we have finally identified 35 candidate genes (26 plus 24 minus 15), which might have been associated with floral induction (Table 1). Nine of them were the homologs of the flower development controlling genes – e.g. LEAFY (LFY) APETALA 1 (AP1), AGAMOUS LIKE 9 (AGL9), or AGAMOUS (AG). Likewise, the CfFTL2–1 gene was slightly upregulated at LD in C. ficifolium 283 and at SD C. ficifolium 459 (Figure 7). However, this activation was very weak compared with a hundredfold increase of FTL1 at SD, which triggered flowering in C. ficifolium 459. The expression of the homolog of the floral integrator SUPPRESSOR OF OVEREXPRESSION OF CO 1 (SOC1) was higher at LD in both genotypes, regardless of photoperiodic requirements. Not all homologs of flowering-related genes exhibited contrasting expression profiles. For example, CAULIFLOWER (CAL) was elevated at SD, and APETALA 2 (AP2) was slightly activated at LD in both C. ficifolium genotypes (Figure 7). Figure 7. The flowering-related genes expressed in C. ficifolium 283 at the age 13 to 19 DAS and in C. ficifolium 459 at the ages of 14 to 24 DAS. Green or blue columns correspond to long LD-treated samples, and golden ones represent SD-treated samples. Transverse lines at each dot (median value of three biological replicates) represent standard deviation. Statistical significance (p-values * < 0.05, ** < 0.01, and **< 0.001; t-test; three biological replicates, each consisting of 5 to 7 seedlings) between pairs of differentially treated samples is represented by asterisks. The x-axis represents sampling points (two sampling points per day: morning − 9.00 and afternoon − 15.00). The y-axis represents relative expression in transcript coverage (TMM). Figure 7.(Continued).Table 1.The genes with contrasting expression pattern between C. ficifolium 283 and C. ficifolium 459.Trinity gene IDBlastx hitProteinGene nameAGI code floral induction and floral meristem specificityDN15587_c0_g1MK212027.1FLOWERING LOCUS T-like 2–1FTL2–1AT1G65480DN14702_c0_g1XP_021715316.1LEAFYLFYAT5G61850DN16212_c5_g1XP_021723464.1AGAMOUSAGAT4G18960DN15826_c1_g8XP_021723077.1AGAMOUS LIKE 9AGL9AT1G24260DN15826_c1_g2XP_021756511.1MADS box CMB1 likeCMB1AT5G15800DN17151_c1_g3XP_021756492.1APETALA1AP1AT1G69120DN17151_c1_g7XP_021739401.1APETALA1AP1AT1G69120DN12941_c0_g1XP_021759869.1DEFICIENS-likeAP3AT3G54340DN6382_c0_g1XP_021716384.1CENTRORADIALIS-LIKEATCAT2G27550 transcription factors DN16786_c0_g1XP_021726586.1REM 16 LIKEREM16AT4G33280DN5874_c0_g1XP_021719303SQUAMOSA PROMOTER BINDING-like 3SPL3AT2G33810DN4836_c0_g1XP_021721780.1ALBA2ALBA2AT2G34160DN6206_c0_g1XP_021738539PHD likePHDn.a. receptors DN16864_c2_g1XP_021761979.1STRUBBELIG-RECEPTOR FAMILY 5-likeSRF5AT1G78980DN17110_c1_g3XP_021862911.1G-type lectin S-receptor-like serine/threonine-protein kinaseEGM1AT1G11300DN17858_c1_g1XP_021854253.1TOO MANY MOUTHS-likeTMMAT1G80080 transporters, enzymes, regulatory proteinsDN6472_c0_g1XP_021766950.1PPDK REGULATORY PROTEINRP1AT4G21210DN9403_c0_g1XP_021774770.1LYS/HIS Transportern.a.AT1G47670DN15894_c2_g2XP_021730829.1FORMIN LIKE 3FH5AT5G54650DN16268_c2_g1XP_021738705.1SQUALENE SYNTHASESQS1AT4G34640DN17223_c2_g3XP_021753867.1SUBTILISIN-like proteaseSBT2.6AT2G19170 stress response DN10374_c0_g1XP_021725567.1ALTERNATIVE OXIDASE 1AOX1AT3G22370DN12254_c0_g1XP_021769091.1UDP-GLYCOSYLTRANFERASE 76B1 likeUGT76B1AT3G11340DN12047_c0_g1XP_021723062.1GAP JUNCTION BETA-4GJB4AT5G13100DN16205_c2_g2XP_021763941.1HXXXD-type acyl-transferasen.a.AT3G50280DN44685_c0_g1XP_021744804.1gamma-interferon-inducible lysosomal thiol reductase-likeGILTAT4G12960DN10404_c0_g1XP_021749788.1CYTOCHROME P450 71ACYP71A*AT3G48310DN16228_c2_g9XP_021848616.1putative 57 kDa heat shock proteinn.a.AT4G16545DN10919_c0_g1XP_021748941.1F-box kelch/repeat proteinn.a.AT3G23880DN13237_c0_g1XP_021766921.1F-box kelch/repeat proteinn.a.AT3G23880DN7988_c0_g1XP_021758808.1F-box kelch/repeat proteinn.a.AT1G15680DN14014_c0_g1XP_021732566.1ring canal kelch homologn.a.no hit hypothetical proteins DN17090_c1_g1KNA05366.1hypothetical protein SOVF_191020n.a.no hitDN34381_c0_g1KMT14149.1hypothetical protein BVRB_4g079700n.a.no hitDN6395_c0_g1XP_021714746.1uncharacterized proteinn.a.no hitDN34018_c0_g1XP_021736107.1uncharacterized proteinn.a.no hit
The rest of oppositely expressed genes coded for transcription factors, regulatory proteins, stress response-related proteins (e.g. coding for the homolog of ALTERNATVE OXIDASE 1 (AOX1), or for uncharacterized proteins (Supplementary Figure S7).
The validation of gene expression by RT qPCR
3.4.
The transcript levels of the CfFTL1, CfFTL2–1, and CfFTL2–2 genes in the course of floral induction in C. ficifolium 283 were measured by RT qPCR (Supplementary Figure S8). The results agreed with the expression profiles estimated from the transcriptomic data. The FTL2–2 gene is absent in C. ficifolium 459 and contains a large deletion in C. ficifolium 283. Its expression was analyzed only in the latter accession.
Discussion
Reproducibility of floral induction experiments in the C. ficifolium genotypes
4.1.
The plantlets of C. ficifolium 283 grew in a similar way and pace as it was documented with C. ficifolium 459.^12^ The primary difference lay in the timing of flowering, which occurred more rapidly under LD in C. ficifolium 283, unlike opposite SD conditions in C. ficifolium 459. The general similarity between the genotypes existed also at the level of gene expression and phytohormone concentrations, where hundreds of identical or highly similar gene expression and phytohormone profiles were observed in both genotypes during floral induction.
The high reproducibility of the floral induction experiments conducted in young plantlets of C. ficifolium 283 and C. ficifolium 459 enabled the identification of the putative genes associated with the accleration of flowering in C. ficifolium 283 at LD. We expected that in such cases, gene expression or phytohormone concentrations would increase over time specifically in C. ficifolium 283, but not in C. ficifolium 459. To investigate this, we employed a newly developed algorithm, which identified 35 candidate genes with clearly opposite expression profiles between the two genotypes.
The genes upregulated during floral induction in C. ficifolium 283, but not in C. ficifolium 459
4.2.
Among the essential integrators of flowering analyzed, only CfFTL2–1 exhibited increased expression in line with floral induction under LD in C. ficifolium 283, while it increased under contrasting SD conditions in C. ficifolium 459. However, its maximum expression was approximately one hundredfold lower than the transcript level of CfFTL1, which activated flowering in C. ficifolium459.^12^ This leads us to question of whether such low transcription can induce flowering. Since Chenopodium is recalcitrant to transformation, direct evidence of the function of CfFTL genes is difficult to achieve. Instead, in the heterologous transformation of A. thaliana, the CfFTL2–1 gene was adopted previously. CfFTL2–1 overexpression was lethal and even slight activation of its expression controlled by an inducible promoter led to the early flowering in seedlings at cotyledon stage in A. thaliana.^11^ This suggests that the promoting effect of CfFTL2–1 might be sufficient to induce flowering at low expression levels despite being not considered a floral activator previously due to its weak expression.^14^
The CfFTL2–1 gene is the homolog of the sugar beet floral repressor BvFT1. The inhibitory function of BvFT1 is associated with unique amino acid substitutions: Asn (position 138), Gln (position 141), and Gln (position 142) in place of Tyr, Gly, and Trp in the respective positions of other FT floral activators.^6^ Unlike BvFT1, the CfFTL2–1 protein shares the aforementioned amino acids with other floral promoters. However, it possesses two unique substitutions that may be important for its function. It carries Pro in the position 145 and Ile in the position 148 instead of Gln and Asn in the corresponding positions in other floral inducers, including A. thaliana FT. Therefore, it is possible that these two amino acids highly activate the floral-inducing effect of CfFTL2–1.
The overexpression of the CfFTL1 paralog in A. thaliana led to early flowering,^11^ but it could not induce flowering under LD as it was consistently upregulated under SD – strongly in C. ficifolium 459 and only slightly in C. ficifolium 283.
Another paralog, CfFTL2–2, which is present only in C. ficifolium 283, exhibited slight upregulation under LD conditions. However, its overexpression in A. thaliana^11^ had no effect, presumably due to a large deletion in the coding region.^14^ Consequently, it is unlikely that CfFTL2–2 plays a role in floral promotion in C. ficifolium 283.
Several other transcription factors or regulatory genes were increasingly expressed during floral induction in both C. ficifolium genotypes, being potentially involved in the regulation of flowering and development. In addition to floral identity genes (i.e. LFY, AP1, AG), the SQUAMOSA PROMOTER BINDING LIKE PROTEIN 3/4 (SPL3/4) homolog was noted. This gene has been reported to integrate photoperiodic and age-dependent signals in A. thaliana,^22^ and it may serve a similar role in C. ficifolium. In contrast, the expression of SOC1, the floral integrator in A. thaliana, was consistently higher at LD in both genotypes. Thus, it might have contributed to floral induction under LD in C. ficifolium 283, but not in C. ficifolium 459.
Phytohormone concentrations in the two C. ficifolium genotypes responded to the photoperiods in a similar way
4.3.
LD conditions induced stress-related phytohormones ABA, JA, and SA in both C. ficifolium genotypes, regardless of whether flowering was accelerated or not. The occcurence of oxidative stress at LD was confirmed by the activation of many stress-response genes, such as those encoding peroxidases.^23^ There were some exceptions, e.g. the upregulation of the ALTERNATIVE OXIDASE 1 (AOX1) homolog at LD in C. ficifolium 283, but at SD in C. ficifolium 283, which may be related to increased oxidative stress during floral development.^20^
The concentration profiles of bioactive CKs in both genotypes were slightly elevated at SD in both genotypes. Nevertheless, the high concentrations of some CK precursors and metabolites under LD conditions suggested a faster turnover in C. ficifolium 283. The increase of the biosynthesis of shoot-born CK iP, as indicated by high content of iPRMP, may be associated with the acceleration of flowering. Similarly, a slight increase in GA_19_ (a precursor of bioactive GA) or in auxin concentration at LD only in C. ficifolium 283 may suggest their involvement in floral development. As entire aerial parts of the plantlets were sampled for phytohormone concentration estimations, the obtained values represent the averages across plants. Detailed measurements of phytohormone concentration in individual organs or tissues should be performed in future to investigate the role of phytohormones in the flowering in C. ficifolium.
Conclusions
The expression profiles of the CfFTL2–1 gene were found to correlate with floral induction in two C. ficifolium genotypes with contrasting response to photoperiod, but its transcript levels were low. However, this gene caused extraordinary strong induction of flowering, when expressed in A. thaliana.^11^ This suggests that CfFTL2–1 may promote flowering in C. ficifolium 283 under LD when the floral activator CfFTL1 is inhibited. The comprehensive transcriptomic and hormonomic study of floral induction was made possible by synchronous and reproducible seed germination and growth of this species. These features are exceptional in light of the reports on physiological and morphological variation in seed germination and growth in other Chenopodium species.^24^ C. ficifolium therefore emerges as a promising diploid model to study flowering in Chenopodium owing to its close relatedness to C. quinoa and also to its reproducible germination and growth.
Supplementary Material
Suppl_Figures_Storchova_jpeg.zip
The reference list from the paper itself. Each links out to its DOI / PubMed record.
- 1Mandák B, Krak K, Vít P, Pavlíková Z, Lomonosova MN, Habibi F, Wang L, Jellen EN, Douda J. How genome size variation is linked with evolution within Chenopodium sensu lato. Perspectives Plant Ecol, Evol & Syst. 2016;23:18–12. doi: 10.1016/j.ppees.2016.09.004. · doi ↗
- 2Pin PA, Nilsson O. The multifaceted roles of FLOWERING LOCUS T in plant development. Plant Cell & Environ. 2012;35(10):1742–1755. doi: 10.1111/j.1365-3040.2012.02558.x.22697796 · doi ↗ · pubmed ↗
- 3Qin Z, Bai Y, Wu L. Flowering on time: multilayered restrictions on FT in plants. Mol Plant. 2017;10(11):1365–1367. doi: 10.1016/j.molp.2017.09.014.28965831 · doi ↗ · pubmed ↗
- 4Kardailsky I, Shukla V, Ahn JH, Dagenais N, Christensen SK, Nguyen JT, Chory J, Harrison MJ, Weigel D. Activation tagging of the floral inducer FT. Science. 1999;286(5446):1962–1965. doi: 10.1126/science.286.5446.1962.10583961 · doi ↗ · pubmed ↗
- 5D’Aloia M, Bonhomme D, Bouche F, Tamseddak K, Ormenese S, Torti S, Coupland G, Périlleux C. Cytokinin promotes flowering of Arabidopsis via transcriptional activation of the FT paralogue TSF. Plant J. 2011;65(6):972–979. doi: 10.1111/j.1365-313x.2011.04482.x.21205031 · doi ↗ · pubmed ↗
- 6Pin PA, Benlloch R, Bonnet D, Wremerth-Weich E, Kraft T, Gielen JJL, Nilsson O. An antagonistic pair of FT homologs mediates the control of flowering time in sugar beet. Science. 2010;330(6009):1397–1400. doi: 10.1126/science.1197004.21127254 · doi ↗ · pubmed ↗
- 7Gendron JM, Staiger D. New horizons in plant photoperiodism. Annu Rev Plant Biol. 2023;74(1):481–509. doi: 10.1146/annurev-arplant-070522-055628.36854481 PMC 11114106 · doi ↗ · pubmed ↗
- 8Kinoshita A, Richter R, Wellmer F. Genetic and molecular basis of floral induction in arabidopsis thaliana. J Exp Botany. 2020;71(9):2490–2504. doi: 10.1093/jxb/eraa 057.32067033 PMC 7210760 · doi ↗ · pubmed ↗