An analysis of the value-added of antibiogram subgroup stratification
Connie T. Y. Xie, Samantha Martinez, Ceylon V. Simon, Susan M. Poutanen

TL;DR
This study shows that using hospital-wide antibiograms can lead to inaccurate antibiotic choices, while unit- and specimen-specific antibiograms provide more accurate guidance for treating specific patient groups.
Contribution
The study quantifies the added value of stratified antibiograms over hospital-wide ones for more accurate antibiotic susceptibility reporting.
Findings
The ED antibiogram showed higher susceptibility compared to the hospital-wide antibiogram.
ICU and transplant unit antibiograms showed reduced susceptibility compared to the hospital-wide antibiogram.
Specimen-specific antibiograms revealed additional susceptibility differences within units.
Abstract
Stratified antibiograms are recommended to guide empiric clinical treatment. However, which strata to focus on, the limited number of isolates in identified strata, and the heavy associated workload all pose challenges. This study compares differences in antibiotic susceptibility between a hospital-wide, all-specimens antibiogram and stratified antibiograms in order to identify the value-added of antibiogram stratification. Antibiotic susceptibility of bacterial isolates from 2021 at a quaternary-care academic hospital was obtained from published hospital-wide and unit- and specimen-specific stratified antibiograms. Differences in percent susceptibility by organism and drug between the hospital-wide and stratified antibiograms were calculated. Weighted averages of the difference in percent susceptibility were calculated for each stratified antibiogram compared to the hospital-wide…
Genes, proteins, chemicals, diseases, species, mutations and cell lines named across the full text — each resolved to its canonical identifier and authoritative record.
Click any figure to enlarge with its caption.
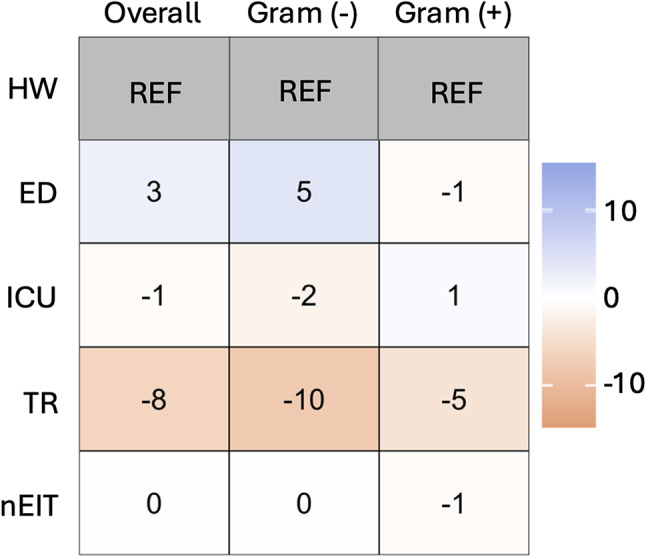 Figure 1
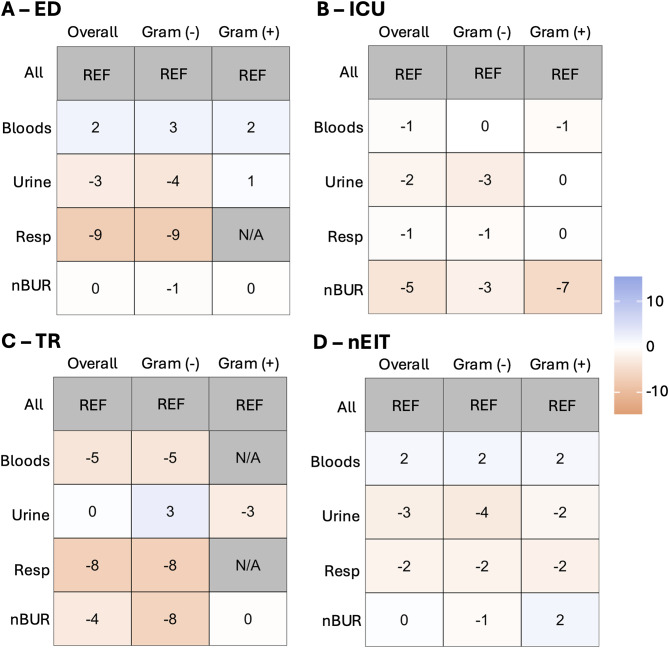 Figure 2
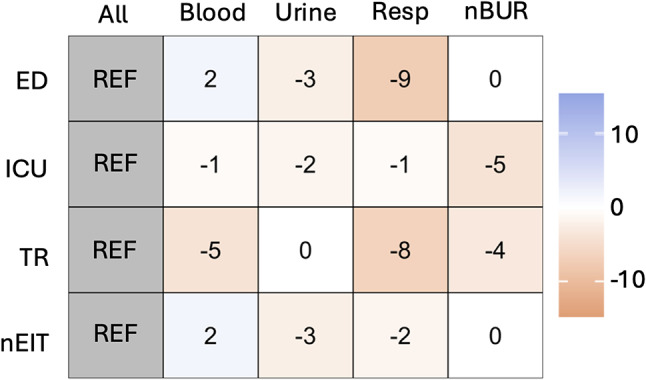 Figure 3
Peer Reviews
No public reviews on file for this paper yet. If you reviewed it on a platform where reviews are public (OpenReview, ICLR, NeurIPS, ICML), you can paste yours below so the community can read it here.
Videos
No videos yet. Explain this paper in a talk, walkthrough, or lecture? Add one.
Taxonomy
TopicsBacterial Identification and Susceptibility Testing · Antibiotic Use and Resistance · Antibiotics Pharmacokinetics and Efficacy
Introduction
Rising antimicrobial resistance poses an ongoing challenge for both empiric and definitive treatment of infections [1]. The Infectious Diseases Society of America (IDSA) recommends compilation of antibiograms as a way to allow for institutional surveillance of antimicrobial susceptibility and to serve as an empirical guide to antimicrobial treatment [2]. From clinical susceptibility tests, average susceptibility percentage of specific organisms-antimicrobial pairings are calculated to track changes in antimicrobial susceptibility. The Clinical and Laboratory Standards Institute (CLSI) publishes consensus guidelines (M39) on the methods of developing antibiograms to ensure their accuracy and comparability. The M39 document outlines methods regarding the collection, analysis and presentation of data [3]. Basic recommendations include that: antibiogram reports should be presented at least annually; only diagnostic isolates should be included; only the first isolate of a species per patient per analysis period should be included; and reported species should have ≥ 30 isolates [3]. The CLSI M39 document and IDSA guidelines suggests the use of stratified antibiograms over non-stratified to improve empiric antibiotic therapy in specific populations [2] suggesting that a hospital-wide antibiogram may conceal differences in susceptibility across different healthcare parameters within a single institution, such as the hospital unit, the infection site, and patient population. The concern is that this can ultimately affect optimal empiric patient treatment as well as impede tracking emerging antimicrobial resistance patterns that are relevant to certain settings.
Indeed, the aggregation of susceptibility data in hospital-wide antibiograms has been shown to be potentially misleading due to the masking of trends in specific patient settings. To date, comparison of hospital-wide to stratified antibiograms are largely focused on categories specific to hospital unit [4–12] with an emphasis on ICU differences, while some have also looked at impact of stratification by infection location [11], and patient characteristics [4, 8, 10, 11, 13]. Most studies have focused on investigating an a priori identified specific strata as opposed to looking at hospital wide differences across many strata.
Our laboratory serves a number of academic acute care and non-acute care health care facilities in the Greater Toronto Area. Our laboratory publishes hospital-wide antibiograms annually along with specimen-specific antibiograms stratified by unit for all acute care hospital clients [14]. The challenges of creating these stratified antibiograms include knowing which strata to focus on, the limited number of isolates in stratified antibiograms, and the heavy workload associated with data clean-out and manipulation associated with the additional analyses required. Given the amount of data and its presentation as distinct antibiograms, it is difficult to determine the value-added of each stratified antibiogram. Using one of our larger acute care hospital’s data, the purpose of this study is to compare differences in antibiotic susceptibility between hospital-wide, all-specimens antibiogram and stratified antibiograms in order to identify the value added of subgroup stratification across all strata.
Methods
Antibiotic susceptibility of bacterial isolates from 2021 of a quaternary-care academic hospital served by our laboratory was obtained from published hospital-wide and unit- and specimen-specific stratified antibiograms [14]. Susceptibility testing and antibiogram generation was performed in accordance with CLSI with the exception of including data for species with less than 30 organisms per strata but greater than 10 in order to be able to include all subgroup analyses. Differences in percent susceptibility by organism and antimicrobial between the reference antibiogram and stratified antibiograms were calculated (Appendices 1–5). Weighted averages (WA) of the change in percent susceptibility, excluding coagulase-negative staphylococci, was calculated for each stratified antibiogram using the number of organisms on the stratified antibiogram as the weight. Heat maps representing these values were created. Excel and R Statistical Software (4.2.1., R Core Team 2022) were used for graph generation.
Results
Comparing unit-specific antibiograms to the hospital-wide antibiogram
Figure 1 presents the weighted average differences in specific units (emergency department [ED], intensive care unit [ICU], transplant [TR] and units that are not ED, ICU, nor TR [nEIT]) when compared to a hospital-wide all-specimens antibiogram divided by gram-negative and gram-positive organisms.
Fig. 1. Comparison of unit-specific stratified antibiograms to the non-stratified hospital-wide antibiogram. Heat map displaying differences in susceptibility by weighted averages without CNST for specific units (emergency department [ED], intensive care unit [ICU], transplant [TR] and units that are not ED, ICU nor TR [nIET]) compared to hospital-wide (HW). Overall weighted average as well as gram-negative and gram-positive weighted averages are shown
Comparing specimen-stratified (syndromic) antibiograms within units to unit-level antibiograms
Figure 2 provides heat maps showing the weighted average for specific specimens (blood, urine, respiratory and non-blood/urine/resp [nBUR]) among units: ED (Fig. 2a), ICU (Fig. 2b), TR (Fig. 2c), and nEIT (Fig. 2d).
Fig. 2. Comparison of specimen-stratified (syndromic) antibiograms within units to the unit-level antibiogram. Heat map displaying the weighted average for specific specimen types (blood, urine, resp [resp] and non-blood/urine/resp [nBUR]) compared to all specimens (ALL) amongst different units: ED (a), ICU (b), TR (c), and units that are not ED, ICU nor TR (nIET; d) are shown. For (a-d), overall weighted average as well as gram-negative and gram-positive weighted average are shown
Summary of weighted average of the change in percent susceptibility between antibiograms
Figure 3 summaries the overall weighted averages of the change in percent susceptibility comparing different unit/specimen combinations when using unit-specific antibiograms as reference.
Fig. 3. Summary of weighted averages of the change in percent susceptibility between antibiogram. Heat maps showing weighted average of the change in percent susceptibility between antibiograms for unit (emergency department [ED], intensive care unit [ICU], transplant [TR] and units that are not ED, ICU nor TR [nIET])/specimen (blood, urine, respiratory [resp], and specimens that are not blood, urine nor resp [nBUR]) combinations using unit-specific antibiograms as reference
Discussion
This study evaluated the weighted average of the change in percent susceptibility by organism in stratified antibiograms compared to non-stratified antibiograms. Differences reflect both differences in percent susceptibility of the organisms and differences in the abundance of the organism for that stratification’s demographic. In this study, only the organism abundance of the stratified antibiogram is taken into account, not the reference antibiogram.
Comparing unit-specific antibiograms through weighted average in Fig. 1 showed that there is value-added to having unit-specific antibiograms particularly for TR units. Overall, the ED antibiogram showed increased susceptibility for all types of bacteria, especially gram-negative bacteria. The opposite trend was revealed for TR where the TR antibiogram had reduced susceptibility compared to the non-stratified hospital-wide all-specimen antibiogram. When looking at the most prevalent organisms in Appendix 1, these trends were seen in most organism-antimicrobial combinations. Some notable findings are that Escherichia coli ciprofloxacin susceptibility in TR exhibited a large decrease in susceptibility at 31% and Enterococcus faecium vancomycin showed reduced susceptibility in TR of 13%.
Comparing the specimen-specific (syndromic) antibiograms stratified by unit by weighted average to unit-specific antibiograms in Fig. 2 highlights the value of this additional layer of stratification. Compared to the all-specimen ED stratified antibiogram (Fig. 2a), respiratory isolates, though limited to Pseudomonas aeruginosa, show a substantial decrease in susceptibility. Urine isolates also display an overall trend of reduced susceptibility, while blood isolates show an increase in susceptibility. At the organism-drug level in Appendix 2, notable changes in susceptibility for blood isolates include increases for E. coli to ampicillin (23%), Proteus mirabilis to ampicillin (13%) and ciprofloxacin (17%), and for methicillin-susceptible Staphylococcus aureus (9%). In urine isolates, there are significant reductions in susceptibility for Klebsiella pneumoniae to tobramycin (58%), P. mirabilis to ampicillin (42%) and tobramycin (27%), Klebsiella oxytoca to tobramycin (42%), E. coli to tobramycin (30%) and ampicillin (24%). Respiratory samples show a 10% reduction in susceptibility for P. aeruginosa to piperacillin/tazobactam and meropenem. Additionally, E. coli in nBUR specimens demonstrates reduced susceptibility to ampicillin (24%), piperacillin/tazobactam (20%), and amoxicillin/clavulanic acid (12%).
The same analysis was performed for ICU, as shown in Fig. 2b, revealing slight reductions in susceptibility across all specimen types, with nBUR demonstrating the most significant relative reduction. On an individual organism basis in Appendix 3, notable changes include reduced susceptibility of blood isolates of E. coli to ciprofloxacin (10%), ceftriaxone (8%), and ceftazidime (8%), while ampicillin (16%) and tobramycin (9%) showed increased susceptibility. In urine isolates of E. coli, susceptibility decreased for tobramycin (59%), ertapenem (30%), and ampicillin (22%), but increased for ceftriaxone (5%) and meropenem in P. aeruginosa (17%). Respiratory isolates exhibited reduced susceptibility of E. coli to tobramycin (26%), ampicillin (22%), amoxicillin/clavulanic acid (14%), piperacillin/tazobactam (12%), and ceftriaxone (8%) as well as reduced susceptibility of K. pneumoniae to amikacin (12%) and ceftriaxone (8%). For nBUR samples, susceptibility was reduced for meropenem in P. aeruginosa (19%) and vancomycin in E. faecium (11%), while susceptibility increased for tobramycin (8%) and ciprofloxacin (7%) in E. coli.
For TR samples, as shown in Fig. 2c, isolate numbers became more restricted. The urine subgroup antibiograms did not reveal any significant overall trends compared to the all-specimen TR antibiogram based on weighted average. However, there were observable trends of decreased susceptibility in blood, respiratory, and nBUR isolates compared to the hospital-wide respiratory antibiogram. On an individual organism basis (Appendix 4), blood E. coli exhibited reduced susceptibility to ciprofloxacin (12%), amikacin (11%), ceftriaxone (8%), and ceftazidime (8%). In urine isolates, E. coli and K. pneumoniae showed a significant reduction in susceptibility to tobramycin (31% and 23%, respectively), with a mild decrease observed in E. faecium for vancomycin (8%). Conversely, susceptibility increased in urine isolates for P. aeruginosa to gentamicin (21%), amikacin (19%), piperacillin/tazobactam (18%), ceftazidime (18%), and tobramycin (14%), as well as for E. coli to ceftriaxone (8%) Respiratory samples showed reduced susceptibility for P. aeruginosa to gentamicin (14%), ceftazidime (11%), and amikacin (10%). In nBUR samples, P. aeruginosa exhibited reduced susceptibility to amikacin (17%), gentamicin (15%), and tobramycin (15%).
Differences were also noted in units other than those described (nEIT, Fig. d). Increased susceptibility in bloods were noted, while the urine and respiratory subgroup antibiograms showed decreased susceptibility compared to the all-specimens nEIT antibiogram. At the organism-drug level in Appendix 5, blood isolates show reduced susceptibility in P. aeruginosa for piperacillin/tazobactam (13%) and K. pneumoniae for ceftriaxone (9%), ceftazidime (9%), amoxicillin/clavulanic acid (7%) and piperacillin/tazobactam (7%), whereas increases in susceptibility were seen for E. coli-ampicillin (25%), *K. pneumoniae-*tobramycin (13%), *E. faecium-*vancomycin (12%), *E. coli-*tobramycin (9%), and increases in methicillin-susceptible S. aureus (5%). Urine isolates saw major reductions in susceptibility in *K. oxytoca-*tobramycin (88%), *K. pneumoniae-*tobramycin (49%), *P. mirabilis-*ampicillin (42%), *P. mirabilis-*amikacin (33%), and *E. coli-*tobramycin (29%). For respiratory isolates, notable susceptibility reductions were seen in K. pneumoniae for piperacillin/tazobactam (12%), ciprofloxacin (11%), tobramycin (11%), trimethoprim-sulfamethoxazole (10%) and amoxicillin/clavulanic acid (7%). A similar pattern was noted for E. coli with reductions in susceptibility seen in amoxicillin/clavulanic acid (17%), ampicillin (13%), piperacillin/tazobactam (9%), ceftriaxone (6%) and ceftazidime (6%) with increases seen for tobramycin (22%), ciprofloxacin (10%) and gentamicin (10%). Lastly, in nBUR samples, susceptibility reductions are seen for E. coli in ceftriaxone (11%), amoxicillin/clavulanic acid (10%) and piperacillin/tazobactam (9%), as well as K. pneumoniae in ciprofloxacin (9%), ertapenem (6%), gentamicin (5%) and amikacin (5%). Additionally, increased susceptibility was seen for P. mirabilis in amikacin (17%) and in methicillin-susceptible Staphylococcus lugdunensis at 7%.
These results shown both visually through heat maps and numerically through weighted average differences in susceptibility suggest there is value-added in continuing to provide specimen-specific (syndromic) antibiograms stratified by unit to help best inform empiric therapy for specific populations. It is clear from our data that using a hospital-wide all-specimens antibiogram may both overcall and under call susceptibility leading to poor empiric antimicrobial choices. While others have recommended ICU-specific antibiograms [4, 9] and ED-specific antibiograms [8], our data suggest value-added in further extending unit-specific data to include other units of interest such as TR units, and to further stratify unit-specific data by specimen type (syndrome) in order to identify nuanced changes in susceptibility that would otherwise go unnoticed in non-stratified antibiograms. The small numbers that may result from such sub-stratification should be recognized as a limitation with a caution that precision around those subgroup estimates of susceptibility may not be high. Collecting data from a larger time duration for those substrata may be helpful to obtain more precise estimates of susceptibility. It is recognized that this study was performed using data collected from a large urban area quaternary-care academic center and the results may not be generalizable to all. Laboratories and antimicrobial stewardship programs are encouraged to examine the specific needs of their own populations and to recognize the limitations of non-stratified antibiograms.
Electronic Supplementary Material
Below is the link to the electronic supplementary material.
Supplementary Material 1: Appendix 1 Heat map displaying differences in susceptibility percentages by individual organism/antimicrobial combinations for unit-specific (emergency department [ED], intensive care unit [ICU], transplant [TR] and units that are not ED, ICU nor TR [nIET]) all-specimens stratified antibiograms compared to the non-stratified hospital-wide all-specimens antibiogram.
Supplementary Material 2: Appendix 2 Heat map displaying differences in susceptibility percentages by individual organism/antimicrobial combinations for specimen-specific (blood, urine, respiratory [resp], and specimens that are not blood, urine nor resp [nBUR]) ED-only stratified antibiograms compared to the hospital-wide ED-only antibiogram.
Supplementary Material 3: Appendix 3 Heat map displaying differences in susceptibility percentages by individual organism/antimicrobial combinations for specimen-specific (blood, urine, respiratory [resp], and specimens that are not blood, urine nor resp [nBUR]) ICU-only stratified antibiograms compared to the hospital-wide ICU-only antibiogram.
Supplementary Material 4: Appendix 4 Heat map displaying differences in susceptibility percentages by individual organism/antimicrobial combinations for specimen-specific (blood, urine, respiratory [resp], and specimens that are not blood, urine nor resp [nBUR]) TR-only stratified antibiograms compared to the hospital-wide TR-only antibiogram.
Supplementary Material 5: Appendix 5 Heat map displaying differences in susceptibility percentages by individual organism/antimicrobial combinations for specimen-specific (blood, urine, respiratory [resp], and specimens that are not blood, urine nor resp [nBUR]) nEIT-only stratified antibiograms compared to the hospital-wide nEIT-only antibiogram.
The reference list from the paper itself. Each links out to its DOI / PubMed record.
- 1M 39Ed 5| Analysis and Presentation of Cumulative Antimicrobial Susceptibility Test Data. 5th Edition. Available at: https://clsi.org/standards/products/microbiology/documents/m 39/. Accessed 2 October 2023.
- 2Campigotto A, Muller MP, Taggart LR, et al. Cumulative antimicrobial susceptibility data from intensive care units at one institution: should data be combined?J Clin Microbiol. 2016;54:956-9.10.1128/JCM.02992-15PMC 480991126791365 · doi ↗ · pubmed ↗
- 3Klinker KP, Hidayat LK, De Ryke CA, De Pestel DD, Motyl M, Bauer KA. Antimicrobial stewardship and antibiograms: importance of moving beyond traditional antibiograms. Ther Adv Infect Dis 2021; 8.10.1177/20499361211011373 PMC 811153433996074 · doi ↗ · pubmed ↗
- 4Randhawa V, Sarwar S, Walker S, Elligsen M, Palmay L, Daneman N. Weighted-incidence syndromic combination antibiograms to guide empiric treatment of critical care infections: a retrospective cohort study. Crit Care 2014; 18.10.1186/cc 13901 PMC 407524224887215 · doi ↗ · pubmed ↗
- 5University Health Network/Sinai Health Department of Microbiology Antibiograms. Accessed 9 March 2025. https://www.sinaihealth.ca/areas-of-care/microbiology/antibiograms