Does a waiting room increase same-day treatment for sexually transmitted infections among pregnant women? A quality improvement study at South African primary healthcare facilities
Ranjana M. S. Gigi, Mandisa M. Mdingi, Lukas Bütikofer, Chibuzor M. Babalola, Jeffrey D. Klausner, Andrew Medina-Marino, Christina A. Muzny, Christopher M. Taylor, Janneke H. H. M. van de Wijgert, Remco P. H. Peters, Nicola Low

TL;DR
This study examined if adding waiting rooms in clinics increased pregnant women waiting for same-day STI test results in South Africa, finding no significant increase.
Contribution
The study is the first to evaluate the impact of clinic waiting rooms on same-day STI testing behavior among pregnant women in South African primary healthcare settings.
Findings
Only 36% of pregnant women waited for their STI test results across all clinics.
Installation of waiting rooms did not significantly increase the proportion of women waiting for results.
Women who had access to dedicated waiting rooms had higher waiting rates than those without.
Abstract
Same-day testing and treatment of curable sexually transmitted infections (STI) is a strategy to reduce infection duration and onward transmission. South African primary healthcare facilities often lack sufficient waiting spaces. This study aimed to assess the proportion of, and factors influencing, pregnant women waiting for on-site STI test results before and after the installation of clinic-based waiting rooms. We conducted an observational quality improvement study at 5 public primary healthcare facilities in South Africa from March 2021 to May 2023. The intervention was the installation of a waiting room in two clinics. Three clinics were used as comparators: two already had a waiting room in an existing building and one had access to a shared waiting area. The outcome was the percentage of women who waited for their STI test results. We conducted univariable and multivariable…
Genes, proteins, chemicals, diseases, species, mutations and cell lines named across the full text — each resolved to its canonical identifier and authoritative record.
Click any figure to enlarge with its caption.
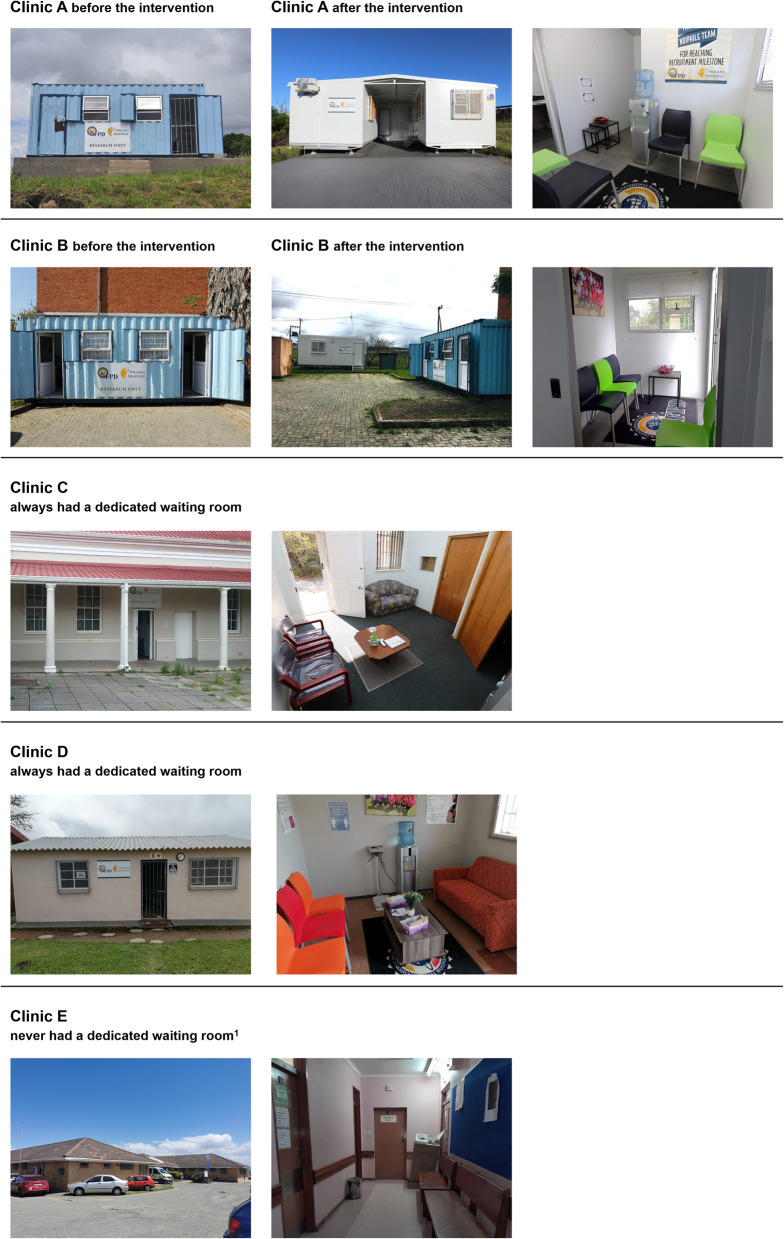 Figure 1
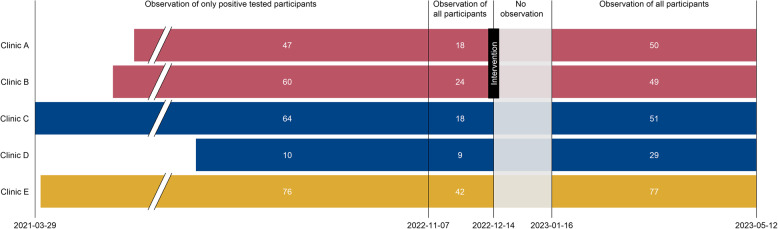 Figure 2
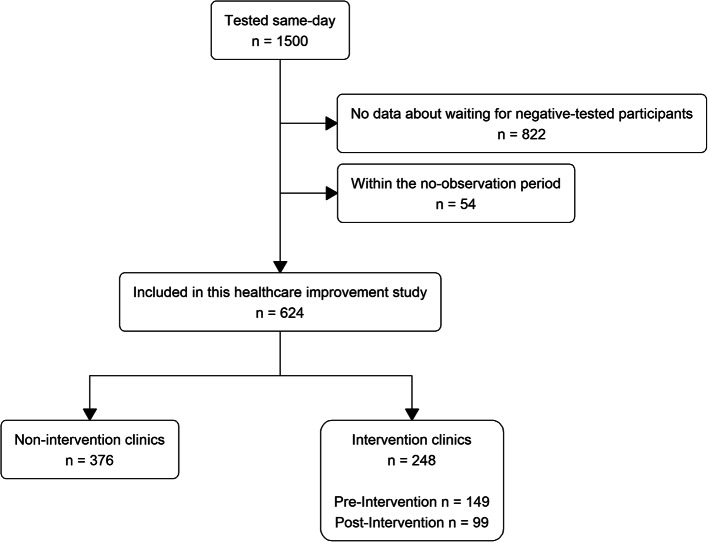 Figure 3
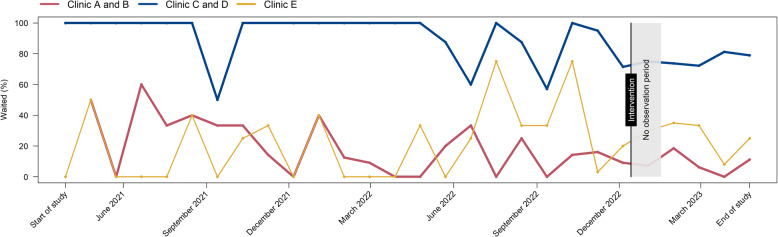 Figure 4
- —http://dx.doi.org/10.13039/501100001711Schweizerischer Nationalfonds zur Förderung der Wissenschaftlichen Forschung
- —http://dx.doi.org/10.13039/100000002National Institutes of Health
Peer Reviews
No public reviews on file for this paper yet. If you reviewed it on a platform where reviews are public (OpenReview, ICLR, NeurIPS, ICML), you can paste yours below so the community can read it here.
Videos
No videos yet. Explain this paper in a talk, walkthrough, or lecture? Add one.
Taxonomy
TopicsReproductive tract infections research · Adolescent Sexual and Reproductive Health · HIV/AIDS Research and Interventions
Introduction
Antenatal clinic services should provide timely treatment for women with newly diagnosed conditions in pregnancy. In South Africa, approximately one-third of women attending antenatal clinics have been found to have at least one curable sexually transmitted infection, including Chlamydia trachomatis, Neisseria gonorrhoeae or Trichomonas vaginalis [1, 2]. In settings lacking laboratory STI diagnostic testing, women with vaginal discharge often receive syndromic management - an empiric approach in which people are treated for the most common potential causes [3]. Clinical management of STIs in pregnancy with rapid accurate diagnostic tests at the point of care would allow same-day targeted treatment [4], reduce overtreatment of symptomatic women without infection and detect asymptomatic infections [5, 6]. The GeneXpert platform (Cepheid, Sunnyvale, California) uses highly sensitive and specific nucleic amplification technology, which can detect C. trachomatis,* N. gonorrhoeae* and T. vaginalis within 60 to 90 min but requires an electricity supply.
The proportion of women who wait for results or receive same-day treatment for STIs detected on the GeneXpert platform in community or primary care settings in resource-limited settings, including sub-Saharan Africa has varied from 2 to 92% [7–12]. In a study in Zimbabwe, researchers investigated why only 2% (1/61) of adolescents received results on the same day after being tested in non-clinical community settings. Clinic staff reported delays resulting from workflow difficulties and power cuts, and that patients could not wait 90 min for results [7]. In our South African research project, called “Philani Ndiphile”, 39% of 125 pregnant women who tested positive for STIs using GeneXpert between March 2021 and March 2022, received same-day treatment. This percentage varied from 26 to 96% among the four clinics [13]. We observed that the clinic where most women waited for results had a comfortable designated waiting room.
The ‘Ideal Clinic’ initiative of the South African National Department of Health aims to create healthcare facilities with good infrastructure, including adequate waiting space and waiting times [14]. However, most healthcare facilities in South Africa need renovation and extension [14, 15]. In addition, the increasing frequency of planned power cuts (known as ‘load shedding’) could increase the turnaround time, from arrival at the clinic to receiving of test results [4, 16], in research settings where the GeneXpert test platform is available. In September 2022, the Philani Ndiphile project investigators planned to upgrade the physical conditions in two clinics by installing a waiting room. This decision provided an opportunity to observe whether there were differences in the percentages of pregnant women waiting for GeneXpert STI test results, according to the presence of a dedicated waiting room. The objectives of this study were to: (1) observe the percentage of women waiting for STI test results before and after installing a dedicated waiting room in two clinics; (2) compare percentages of women waiting for results in clinics with and without a waiting room; and (3) describe reasons why pregnant women did not intend to wait for results.
Methods
We used the Standards for Quality Improvement Reporting Excellence (SQUIRE 2.0) guidelines [17] to report this study. The statistical analysis plan is at: https://osf.io/zk4xd/.
Study design and setting
This healthcare quality improvement study used an observational design. It was nested within the Philani Ndiphile research project, which aims to evaluate different screening strategies to decrease the prevalence of STIs among pregnant women and reduce adverse birth outcomes in Buffalo City Metropolitan Health District, Eastern Cape Province, South Africa [18, 19]. Enrolment into Philani Ndiphile commenced in the antenatal clinics of four public healthcare facilities between March and May 2021, with a fifth clinic starting in June 2022 [13]. We used study data collected from Philani Ndiphile participants from 29 March 2021 to 12 May 2023.
Clinics A, B and E are community healthcare centres, and Clinics C and D primary healthcare facilities, with the former being larger and offering more services than the latter (Table 1).1 Clinics A and E are in peri-urban townships. Clinic A is in a more densely populated area with mainly informal dwellings than Clinic E, which has a mix of formal and informal dwellings. Clinic B is in a larger peri-urban township with mainly formal dwellings. Clinic D is in a semi-rural area with formal dwellings. Clinic C is in a sparsely populated peri-urban town with formal dwellings.Table 1. Description of the clinic settings and research sites at baselineIntervention clinicsNon-intervention, control clinicsClinic^a^Clinic AClinic BClinic CClinic DClinic EDescription of area Type of health facilityCommunity health centreCommunity health centrePrimary healthcarePrimary healthcareCommunity health centre Type of settlementperi-urban township, informal dwellingsperi-urban township, formal dwellingsperi-urban town, formal dwellingssemi-rural area, formal dwellingsperi-urban township, informal and formal dwellings Population density (per km^2^) [20]17,410344351917964226 Distance to the nearest shop selling food (metres)50060030080550Description of research site Site description14m^2^ metal freight container accessible through the backdoor of the healthcare facility14m^2^ metal freight container in the parking lot of the healthcare facility, across from the main entrance3-room area inside the healthcare facility building4-room free-standing building within the grounds of the healthcare facilityOne small room inside the healthcare facility, shared with other antenatal services Water dispenser for participantsYesYesYesYesNo BathroomInside the facilityInside the facilityAcross the courtyardAcross from the waiting roomIn the same passage Waiting room descriptionNo dedicated waiting room at project start, camp chairs in an uncovered area, no privacy, no protection from the weatherNo dedicated waiting room at project start, camp chairs in an uncovered area, limited privacy, very busy area, no protection from weatherDedicated waiting room with chairs and a couch, private, not visible from the rest of the facility, cool in summer but cold in winterDedicated waiting room with chairs and a couch, private, not visible from the rest of the facility, hot in summer and cold in winterNo dedicated waiting room throughout, bench in the general waiting area, limited privacy, busy area, cool in summer, cold in winter Research nurse clinical experience, years9915339^a^Clinic identification labels A to E do not correspond with labels reported in Mdingi MM, et al. [13]
The installation of a dedicated waiting room (described as the intervention) was implemented at Clinics A and B (Table 1; Fig. 1). At these clinics, the Philani Ndiphile research procedures were initially conducted out of 14m^2^ (approximately 5.9 m x 2.3 m) metal freight containers on the community healthcare centre grounds and participants had to wait outside in an uncovered area. At Clinics C and D, research procedures were conducted in multiple rooms inside the clinic building. Only study participants could use these dedicated comfortable waiting rooms. At Clinic E, research study staff shared a small room with other antenatal care services inside the clinic building. Participants used the same waiting area, which was a corridor, as the regular antenatal clinic attendees. We judged this facility to be sub-optimal for an ‘Ideal Clinic’ [14]. Since no upgrade was planned, we considered it separately as having ‘no dedicated waiting area’.Fig. 1. Clinics before and after the intervention. Legend: 1, waiting area shared with regular clinic patients
Study population
At their enrolment visit, Philani Ndiphile study participants who received same-day STI testing according to the study protocol in the clinics, were included in this study. Participants were aged ≥ 18 years and < 27 weeks of gestation at enrolment. A research nurse conducted a physical examination and collected vaginal swabs as early as possible during the enrolment visit in all clinics. One swab was tested on-site on the GeneXpert machine. The processing time for the combined assay for C. trachomatis and N. gonorrhoeae is 90 min and, for the assay for T. vaginalis, 60 min; the tests run in parallel on the same machine. Times from arrival at the clinic until testing and from the end of processing until receipt of results were not measured.
Intervention
Clinics A and B were provided with a new air-conditioned 18m^2^ (approximately 5.9 m x 3.0 m) container, with one room furnished as a waiting room with seating space, a water dispenser, and a separate bathroom (Table 1; Fig. 1). At Clinic A, the original 14m^2^ freight container was also replaced. A newly installed roof between the two new containers could also be used as an additional outside covered waiting area. At Clinic B, the 14m^2^ freight container remained. The intervention, introduction of the new waiting rooms, started operating on 14th December 2022 (Fig. 2).Fig. 2. Study procedures from 29 March 2021 to 12 May 2023, by clinic. Legend: Clinics A and B (red bars; intervention clinics) initially had no dedicated waiting room; new waiting rooms were implanted in December 2022. Clinics C and D (blue bars; control clinics group 1) always had dedicated waiting rooms. Clinic E (yellow bar, control clinic group 2) never had a dedicated waiting room and did not receive any intervention. Break in x-axis from 01 June 2021 to 01 June 2022, no change in status. White numbers in each bar are numbers of participants for each time period and clinic
Outcomes
The primary outcome was the percentage of participants who waited to receive their STI test results on the same day. The secondary outcome was the response to structured questions about reasons for waiting for same-day STI test results.
Sample size
We used study data about all STI tests and the proportions of participants waiting for results in the Clinics A and B before the intervention (26%, 17/65 and 10%, 8/84). Guided by the proportion of participants waiting in Clinic C (94%, 77/82) which always had a waiting room, we considered a conservative increase to 45%. Based on 26% of participants waiting and 147 participants with complete pre-intervention data, a total of 220 participants would result in more than 0.8 power to detect an improvement to 45% at an alpha of 0.05, based on a chi-squared test. We aimed to observe at least 80 participants post-intervention in Clinics A and B combined.
Data collection
We recorded data in a Research Electronic Data Capture software (REDCap, Vanderbilt University, Tennessee, USA) project database [21]. From 29 March 2021 to 6 November 2022, we only collected the dates of testing and treatment for participants with a positive STI result (Fig. 2). We classified the participant as having waited for her result if the dates of testing and treatment were identical. From 7 November 2022, we captured data from all participants, irrespective of their STI test result. The first month after the waiting rooms were installed on 14 December 2022 coincided with a holiday period. We considered this a ‘settling in’ period for the intervention and did not analyse data for this period (Fig. 2). From 14 September 2022 onwards, all participants from all clinics were asked structured questions about their intention to wait, what would make them wait and, for participants who did not intend to wait but actually received same-day results, what were their reasons.
We obtained national-level data about load shedding from the national power supplier. We applied the national level of load shedding that was in operation at midday of each day in the observation period to each clinic. We defined three groups: no load shedding, stages 1–3 (3–6 h of power outage per day), and stages 4–6 (6–12 h of power outage per day) and added this information to the database at the participant level.
Statistical analysis
We summarised continuous baseline characteristics using means and standard deviations, or medians and interquartile ranges, and categorical variables as frequencies. We compared baseline characteristics of participants included in the analyses with all those eligible for same-day STI testing, using Mann-Whitney or chi-square tests.
Objective 1: we calculated the percentages (with 95% confidence intervals, CI) of women who waited for results (number who waited for their results divided by number tested), by clinic and intervention group. We made run charts, which display monthly aggregated percentages, by clinic and intervention status [22]. Objective 2: To analyse the primary outcome for each woman (waited for results, yes/no), we used binomial generalised estimating equations, with an independence correlation structure and the clinic as a cluster variable. We pre-specified 6 explanatory variables, which could have influenced waiting. Participant factors were employment status, symptom status and STI test positivity. Although the result is not known at the time of testing, women who are aware of sexual practices that increase STI acquisition risk or women who have symptoms might be more likely to wait for results under any circumstances [7, 23]. Clinic setting factors were the distance to the nearest food shop, which was a proxy for clinic location and ability to buy food whilst waiting, years of clinical experience of the research nurse and level of electrical load shedding. The primary analysis model compared data for women attending post-intervention (waiting room available) vs. pre-intervention (no waiting room) for Clinics A and B only. We conducted two secondary analyses, using data for all clinics. In the first model, waiting room was a binary variable with each woman categorised as attending a clinic in which a waiting room was available vs. not available. In the second model, waiting room was a categorical variable: never available, available from the beginning, and waiting room introduced. We conducted multivariable analyses and planned to adjust for all pre-specified explanatory variables in each model. We also conducted a subgroup analysis using data from Clinics A and B, according to the STI test, to investigate whether women who might have thought they had an STI were more likely to wait for their results under any circumstances. The model included an interaction term for STI and the intervention as additional covariates. We report results from each statistical model as the marginal risk difference (with 95% CI). Objective 3: we tabulated responses to structured questions about factors that might make the participant wait or change her mind and report these as frequencies and percentages.
Ethical considerations
All participants provide written informed consent to participate in the Philani Ndiphile study. The Philani Ndiphile study received approval from the University of Cape Town’s Human Research Ethics Committee (Reference: 676/2019) and from the local Department of Health (Reference: EC_202010_017). The study reported here is a healthcare quality improvement study, which did not require ethical committee review. Authorisation to analyse de-identified data at the University of Bern has been granted by the Canton of Bern Ethics Committee (Reference 2021 − 01209).
Results
From 29 March 2021 to 12 May 2023, a total of 1986 participants were enrolled into the Philani Ndiphile study and 1500 participants received same-day testing, according to study protocol (Fig. 3). We excluded data from 822 participants enrolled before 7 November 2022, because we did not initially collect data about waiting for those with a negative STI test result, and from 54 participants during the settling in (no observation) period. Our final dataset included 624 participants: 257 in the period during which we only collected waiting data on participants with a positive STI test and 367 in the period during which we collected waiting data on all participants (Fig. 2). Of these, 99 participants were enrolled post-intervention in Clinics A and B combined. There were no substantial differences in socio-economic and health characteristics of included and excluded participants (Additional file 1).Fig. 3. Flow chart of study participant selection
The characteristics of included participants in each clinic are shown in Table 2. Across the 5 clinics, the median age was 27 years, and 31% of women were living with HIV. Participants reported waiting from around half an hour to two hours to see a public health nurse or a doctor. Research nurses in Clinics A, B and E had the same level of clinical experience. For these clinics, the population density and distance to the nearest shop were also very similar (Table 1).Table 2. Baseline characteristics of included participants, by clinicIntervention clinicsNon-intervention, control clinicsClinic^a^Clinic AClinic BClinic CClinic DClinic ENumber of participants, n11513313348195Age, years, median (IQR)28 (24–32)26 (21–32)26 (23–32)28 (23–32)27 (22–32)Gestational age, mean weeks (SD)14 (6)15 (6)15 (6)12 (6)15 (5)Education level, n (%) Less than Grade 12^b^65 (57)53 (40)50 (38)24 (50)65 (33) Grade 12^b^40 (35)70 (53)63 (47)24 (50)113 (58) Diploma or degree10 (9)10 (8)20 (15)017 (9)Unemployed, n (%)72 (63)76 (57)78 (59)40 (83)117 (60)Vaginal discharge,^c^ n (%)15 (13)12 (9)32 (24)10 (21)13 (7)Living with HIV, n (%)42 (37)27 (20)48 (36)26 (54)48 (25)STI test positive,^d^ n (%)67 (58)80 (60)76 (57)23 (48)97 (50)Self-reported time to see a nurse/doctor,^e^ minutes, mean (SD)38 (35)116 (56)60 (44)83 (75)36 (36)Travel time to healthcare facility, minutes, mean (SD)25 (18)23 (14)26 (16)45 (33)22 (11)Money spent to attend healthcare facility, ZAR,^f^ mean (SD)26 (28)43 (45)35 (39)7 (18)49 (22)IQR interquartile range, SD standard deviation, ZAR South African Rand^a^Clinic identification labels A to E do not correspond with labels reported in Mdingi MM, et al. [13]^b^Grade 12 is the last year of school in South African and a school-leaving certificate (high school diploma) is issued when completed^c^Vaginal discharge was either self-reported on structured questionnaires or observed on clinical examination^d^Number (%) does not represent prevalence because initially only participants with a positive STI result were included; STIs tested for: Chlamydia trachomatis, Neisseria gonorrhoeae and Trichomonas vaginalis (only in Clinics A-D)^e^Women were asked how long they usually had to wait to see a nurse or doctor^f^Exchange rate 01 Nov 2023: 1 ZAR ≈ 0.05 US Dollars ≈ 0.05 Euros
The monthly run chart (Fig. 4) shows that the percentages of women waiting for their test results before and after the intervention did not change substantially and that the percentage waiting in Clinics C and D, which always had dedicated waiting room, remained higher throughout the study period than in the intervention Clinics A and B and in Clinic E, which never had a dedicated waiting room. Summary data for each clinic separately are shown in Additional file 2.Fig. 4. Monthly run chart showing the percentage of participants waiting over time, by clinic and intervention. Legend: Clinics A and B (red; intervention clinics); Clinics C and D (blue; control clinics group 1) always had a dedicated waiting room; Clinic E (yellow; control clinic group 2) never had a dedicated waiting. Intervention start was 14 December 2022; no observation from 14 December 2022 to 16 January 2023
In the primary analysis, for the intervention clinics, Clinics A and B combined, 17% (95% CI 11 to 24) of participants waited for their result before the intervention and 10% (5 to 18) after the addition of a waiting room (absolute difference, −7% (−16 to + 3) (Table 3). After adjustment for employment status, STI test positivity, symptoms, load shedding and distance to the nearest shop, the absolute adjusted percentage waiting was 6% (−16 to + 2) lower after the intervention (Table 3). The years of research nurse experience could not be included in the model because the values of the variable were identical in both clinics.Table 3. Percentage of women who waited for results, primary and secondary analysesPercentage waited, % (95% CI, n/N)Absolute percentage difference, % (95% CI)Adjusted^a^ absolute percentage difference, % (95% CI)Primary analysis: Clinics A and B combined, pre- and post-intervention Pre-intervention17 (11 to 24, 25/149) Post-intervention10 (5 to 18, 10/99)–7 (–16 to + 3)–6 (–16 to + 2)Secondary analysis 1: All clinics, grouped as dedicated waiting room available vs. not available No waiting room19 (15 to 23, 64/344) Waiting room58 (53 to 65, 161/280)+ 39 (+ 31 to + 47)+ 7 (–4 to + 18)–8 (–15 to − 0.3)^b^Secondary analysis 2: All clinics, grouped as no dedicated waiting room, dedicated waiting room from the beginning, and dedicated waiting room introduced No waiting room ever19 (15 to 23, 64/344) Waiting room from the beginning83 (77 to 88, 151/181)+ 65 (+ 58 to + 72)+ 70 (+ 56 to + 83) Waiting room introduced10 (5 to 18, 10/99)–9 (–16 to − 1)^c^–5 (–14 to + 3)^c^Abbreviations: CI 95% confidence interval^a^Adjusted for employment status of participants, STI positivity, proportions of symptomatic participants, load shedding (in 3 categories: no load shedding, stage 1–3, stage 4–6), and distance to the nearest food shop^b^Adjusted for variables above and years of clinical experience of research nurse^c^Compared with no dedicated waiting room
For the secondary analysis, with waiting room as a binary variable, 58% (53 to 65) of participants waited for their result when a waiting room was available and 19% (15 to 23) when there was no waiting room (absolute difference 39%, 31 to 47). After adjustment for employment status, STI test positivity, symptoms, load shedding and distance to the nearest shop, the adjusted percentage difference was + 7% (− 4 to + 18) when a waiting room was available (Table 3). When the clinical experience of the nurse was added to the model, the adjusted percentage difference was − 8% (− 15 to − 0.3) (Additional file 3).
With waiting room as a 3-level categorical variable, the percentages of participants waiting were: no dedicated waiting room ever 19% (15 to 23), waiting room available from the beginning 83% (77 to 88), and dedicated waiting room introduced 10% (5 to 18). Compared with no dedicated waiting room ever, the absolute percentage difference was + 65% (+ 58 to + 72) when a waiting room was available from the beginning and − 9% (− 16 to − 1) when a waiting room was introduced. In the multivariable model, distance to the nearest shop and clinical experience of the research nurse were highly correlated and could not both be included. After adjustment for employment status of participants, STI positivity, symptoms, load shedding, and distance to the nearest shop, the adjusted percentage differences waiting were similar to the univariable analysis (Table 3).
In the subgroup analysis, according to the presence of an STI, we used data for Clinics A and B. We did not find evidence for an interaction between the STI status and waiting (p-value for interaction unadjusted = 0.79, p-value for interaction adjusted = 0.76, Additional file 4).
Three hundred and ninety-two of 624 (63%) participants provided data about intentions and reasons for not waiting for results (Table 4). Responses did not differ substantially by clinic (Additional file 5) and 136/392 (35%) were collected before the intervention. Of these, 55% (217/392) reported that they did not intend to wait for their results. The main reasons were family (30%, 66/217) or work/school (28%, 60/217) commitments. When we asked these 217 participants what would change their mind about waiting, 72% (157/217) reported that nothing would change their mind. Of 11 participants who did not intend to wait but who received same-day results, 7 said that they were still waiting for other procedures at the clinic, for example for medication from the pharmacy (Table 4). Of 175 participants who intended to wait for their results, 77% (103/175) waited.Table 4. Reasons for not waiting for STI test results, or for changing intention“What is your main reason, why you are not intending to wait today?”Overall (n = 217), n (%)Have to get back to my kids/family66 (30)Have to get to work/school60 (28)Hungry29 (13)Want to go to the shop26 (12)Not feeling well11 (5)No time/going somewhere8 (4)Load shedding5 (2)Referred to hospital4 (2)Too hot2 (1)Boring2 (1)Transport availability1 (0.5)No space to wait1 (0.5)Didn’t come alone to the clinic1 (0.5)Tired1 (0.5)“What would make you change your mind?”Overall (n = 217), n (%)Nothing157 (72)If I did not have other commitments/not be in a hurry26 (12)Food23 (11)If I had someone looking after the kids6 (3)If I can feel better3 (1)Comfortable waiting space2 (1)“What made you change your mind about waiting for the results?”Overall (n = 11), n (%)Waiting for other clinic procedures (for example, medication)7 (64)Education about importance of waiting by the nurse3 (27)Returned to clinic after being called1 (9)
Discussion
The absolute difference in Clinics A and B after the introduction of a waiting room was − 7% (95% Cl –16 to + 3) in univariable analysis and − 6% (–16 to + 2) in multivariable analysis. The percentages of pregnant women waiting for STI test results were higher throughout the study period in Clinics C and D, which always had a dedicated waiting room, than in intervention Clinics A and B, and in Clinic E, which never had a dedicated waiting room. Most participants overall (217/392, 55%) said that they were not willing to wait for their results and of those not intending to wait, 72% (157/217) stated that nothing would change their mind.
Strengths and limitations of the study methods
The main strength of this healthcare improvement study is the real-world setting in multiple primary care clinics, which allowed comparisons both pre- and post-intervention and between clinics in which the availability of a waiting room differed. The study setting and observational design are methodological limitations because the number of clinics was limited and a randomised or crossover design were not possible. Whilst we pre-specified factors that could have affected the tendency to wait for STI test results, the measured variables might not have fully captured the reasons for differences between the study clinics. Measurement error, for example, resulting from applying national-level data to each clinic, could have resulted in a non-differential error, biasing any effect towards the null. In addition, the multivariable analyses aimed to adjust for differences between clinics, but some variables could not be included because the values were identical between clinics or were highly correlated. We collected data about intentions and reasons for waiting for test results after deciding to evaluate the intervention, so these questions were only presented to a subset of participants, and potentially important reasons might have been missed because the responses were pre-defined.
Interpretation of the study findings
Following installation of a dedicated waiting room, water dispenser and bathroom in two community health facilities, the percentage of pregnant women waiting for the results of on-site GeneXpert tests for STIs did not increase. It was plausible that upgrading the physical infrastructure of research study clinics could have made it more comfortable for women to wait for their results because we had observed much higher percentages of women waiting for results in a healthcare facility with a dedicated waiting room than in clinics without [13]. There are several possible reasons for the primary findings observed in our study. First, the presence or absence of a waiting room in itself might not be a decisive factor influencing decisions about waiting for results. Responses from a subset of participants in this study (Table 4) support this, as very few women said that the absence of a waiting room was the main reason for not waiting and availability of a waiting room would not have changed the decision. This information was only obtained, however, after the decision to install dedicated waiting rooms had been made. Second, an increase in load shedding during the study period might have masked any possible effect of the new waiting rooms. The percentage of women waiting was lower after the intervention than before; power cuts would have decreased the capacity of the GeneXpert machines, made the clinic environment less conducive to waiting and further prolonged clinic visits. Third, there is imprecision in the estimates, which are compatible with both a reduction and a small increase in the percentage of participants waiting.
In other research studies in resource-limited settings, 90% or more of pregnant women have been reported to wait for same-day results and/or treatment following GeneXpert STI testing [9–12]. In our study, similar percentages of women waited for results in some clinics. The large differences between clinics likely reflect a mix of setting-related factors, which we could not entirely disentangle. These clinics differed in other ways from the clinics at which few women waited; locations were in less densely populated areas and closer to the nearest shop, and research nurses were more experienced. In our secondary analysis, the crude percentage difference was 39% (31 to 47) higher when a waiting room was available than when it was not available (Table 3). This difference was reduced to + 7% (− 4 to + 18) after adjusting for factors, including the distance to the nearest shop. This variable may represent other unmeasured community-related characteristics associated with ability to wait for test results. Additional adjustment for the experience of the research nurse reduced this difference further to − 8% (− 15 to − 0.3) (Additional file 3). The duration of clinical experience of research nurses might therefore also influence outcomes or might represent other unmeasured factors, which could be investigated in future qualitative studies. It is also possible that the physical environment of freight containers and their placement away from the main clinic building (Fig. 1) was less attractive than fixed integrated spaces within a healthcare facility.
Implications for research and policy
This healthcare improvement study shows both the importance and the challenges of evaluating the outcomes of changing physical conditions in the healthcare setting. The goal of improving healthcare infrastructure through initiatives such as the ‘Ideal Clinic’ is clearly important [14] but understanding the impact on process and outcome indicators is also needed. Relevant modifiable factors include clinic workflow, staff training, clinic infrastructure and the turnaround time of test technology. Point-of-care tests that allow treatment decisions to be made at the initial clinical encounter and are rapid, affordable, electricity-independent are particularly important in settings with limited healthcare infrastructure [4–6, 24]. Currently licensed platforms, such as GeneXpert, for on-site C. trachomatis, N. gonorrhoeae and T. vaginalis detection, remain restricted to research studies in most settings. Long waiting times for GeneXpert STI test results have been reported as a major reason for not waiting, in a study amongst youth in Zimbabwe [7] and interruptions to the supply of electricity also reduce efficiency and limit the ability to reduce overall turnaround times. Both qualitative and quantitative studies will be needed to evaluate reasons for differences in, and the implementation of interventions to improve the probability of, waiting for STI results.
Conclusion
Changing only the physical infrastructure by introducing a dedicated and comfortable waiting room to primary healthcare facilities did not overcome the challenges of providing same-day treatment among pregnant women in our study setting. Future studies should investigate how infrastructure, individual and test-based factors, including other methods of results notification or point-of-care tests with faster turnaround times can improve the uptake of same-day STI testing and treatment.
Supplementary Information
Additional file 1. Socio-economic and health characteristics of included and excluded participants
Additional file 2. Percentage of women who waited for results by clinic and intervention date (14 December 2023)
Additional file 3. Secondary analysis 1: All clinics, grouped by waiting room availability
Additional file 4. Sub-group analysis: Clinics A and B combined, grouped by presence of a sexually transmitted infection
Additional file 5.
The reference list from the paper itself. Each links out to its DOI / PubMed record.
- 11. Joseph Davey DL, Nyemba DC, Gomba Y, Bekker LG, Taleghani S, Di Tullio DJ, et al. Prevalence and correlates of sexually transmitted infections in pregnancy in HIV-infected and- uninfected women in Cape Town, South Africa. P Lo S One. 2019. 10.1371/journal.pone.0218349.10.1371/journal.pone.0218349 PMC 660217131260486 · doi ↗ · pubmed ↗
- 22. Govender V, Moodley D, Naidoo M, Connoly C, Ngcapu S, Abdool Karim Q. High incidence of asymptomatic genital tract infections in pregnancy in adolescent girls and young women: need for repeat aetiological screening. Sex Transm Infect. 2023. 10.1136/sextrans-2022-055658.10.1136/sextrans-2022-055658 PMC 1071550637208192 · doi ↗ · pubmed ↗
- 34. Pai NP, Vadnais C, Denkinger C, Engel N, Pai M. Point-of-care testing for infectious diseases: diversity, complexity, and barriers in low- and middle-income countries. P Lo S Med. 2012. 10.1371/journal.pmed.1001306.10.1371/journal.pmed.1001306 PMC 343340722973183 · doi ↗ · pubmed ↗
- 45. Peters R, Klausner JD, de Vos L, Feucht UD, Medina-Marino A. Aetiological testing compared with syndromic management for sexually transmitted infections in HIV-infected pregnant women in South Africa: a non-randomised prospective cohort study. BJOG. 2021. 10.1111/1471-0528.16617.10.1111/1471-0528.16617 PMC 817547333277768 · doi ↗ · pubmed ↗
- 56. Nyemba DC, Medina-Marino A, Peters RPH, Klausner JD, Ngwepe P, Myer L, et al. Prevalence, incidence and associated risk factors of ST Is during pregnancy in South Africa. Sex Transm Infect. 2021. 10.1136/sextrans-2020-054631.10.1136/sextrans-2020-054631 PMC 801239433004610 · doi ↗ · pubmed ↗
- 67. Martin K, Dziva Chikwari C, Mackworth-Young CRS, Chisenga M, Bandason T, Dauya E, et al. “It was difficult to offer same day results”: evaluation of community-based point-of-care testing for sexually transmitted infections among youth using the Gene Xpert platform in Zimbabwe. BMC Health Serv Res. 2022. 10.1186/s 12913-022-07557-7.10.1186/s 12913-022-07557-7PMC 883001735144602 · doi ↗ · pubmed ↗
- 78. Wynn A, Ramogola-Masire D, Gaolebale P, Moshashane N, Agatha Offorjebe O, Arena K, et al. Acceptability and feasibility of sexually transmitted infection testing and treatment among pregnant women in Gaborone, Botswana, 2015. Biomed Res Int. 2016. 10.1155/2016/1251238.10.1155/2016/1251238 PMC 482691127119076 · doi ↗ · pubmed ↗
- 89. Morikawa E, Mudau M, Olivier D, de Vos L, Joseph Davey D, Price C, et al. Acceptability and feasibility of integrating point-of-care diagnostic testing of sexually transmitted infections into a South African antenatal care program for HIV-infected pregnant women. Infect Dis Obstet Gynecol. 2018. 10.1155/2018/3946862.10.1155/2018/3946862 PMC 597135929861622 · doi ↗ · pubmed ↗