Patterns of physical activity in Obstructive Sleep Apnoea and their association with sleepiness
By Jack Callum, Yu Sun Bin, Kate Sutherland, Amanda Piper, Kristina Kairaitis, John Wheatley, Philip de Chazal, Brendon J. Yee, Emmanuel Stamatakis, Peter A. Cistulli

TL;DR
This study examines physical activity patterns in people with obstructive sleep apnoea and finds that higher activity is linked to more daytime sleepiness in women but not men.
Contribution
The study identifies a gender-specific association between physical activity and daytime sleepiness in obstructive sleep apnoea patients.
Findings
47% of OSA patients reported high physical activity levels (>3000 MET-min/week).
In women, severe OSA combined with medium or high physical activity was linked to higher daytime sleepiness scores.
No significant association was found between physical activity and sleepiness in men after adjusting for covariates.
Abstract
Excessive daytime sleepiness (EDS) is a key symptom of Obstructive Sleep Apnoea (OSA). Both EDS and OSA affect, and are affected by, physical activity (PA). This study explores physical activity patterns in OSA patients and the association between activity and EDS. This is a retrospective analysis of cross-sectional data from the Sydney Sleep Biobank, which recruited sleep clinic patients between August 2018 and June 2022. Participants aged > 18 years with untreated OSA were included, while those with other sleep disorders or whose medication/work affected sleepiness were excluded. PA was assessed with the International Physical Activity Questionnaire (IPAQ), with intensity quantified by metabolic equivalent of task (MET). Subjective daytime sleepiness with quantified by the Epworth Sleepiness Scale (ESS). Of 487 patients with OSA, 21% reported low (< 600 MET-min/week), 32% medium…
Genes, proteins, chemicals, diseases, species, mutations and cell lines named across the full text — each resolved to its canonical identifier and authoritative record.
Click any figure to enlarge with its caption.
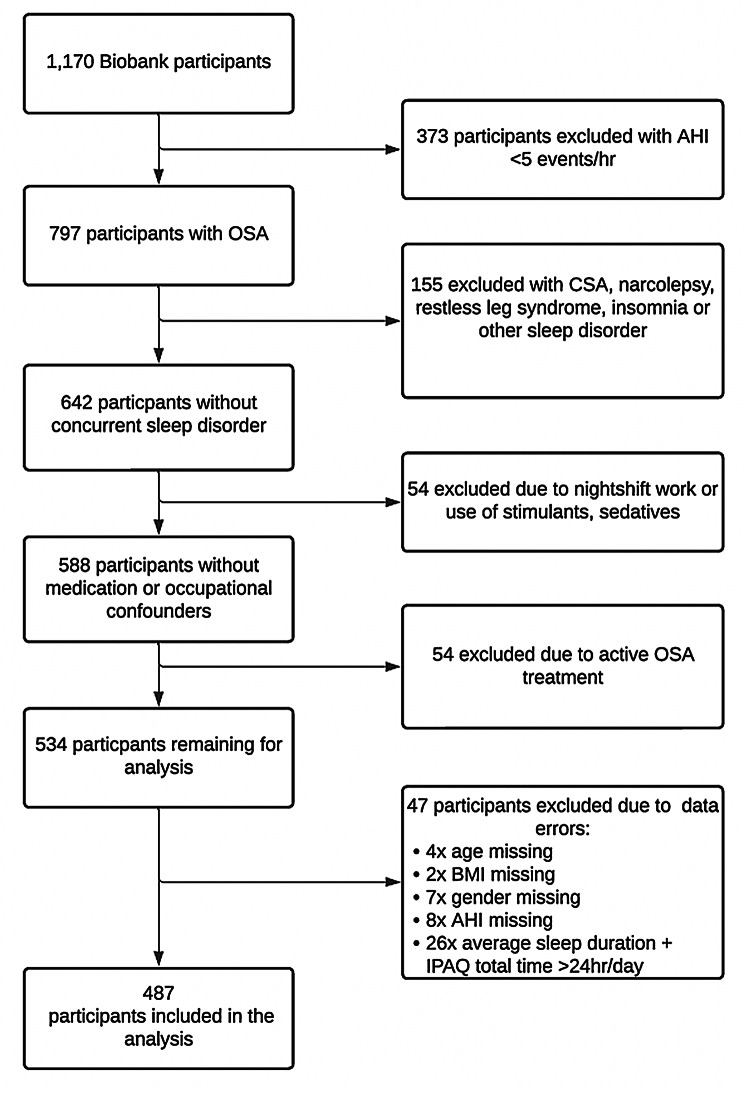 Figure 1
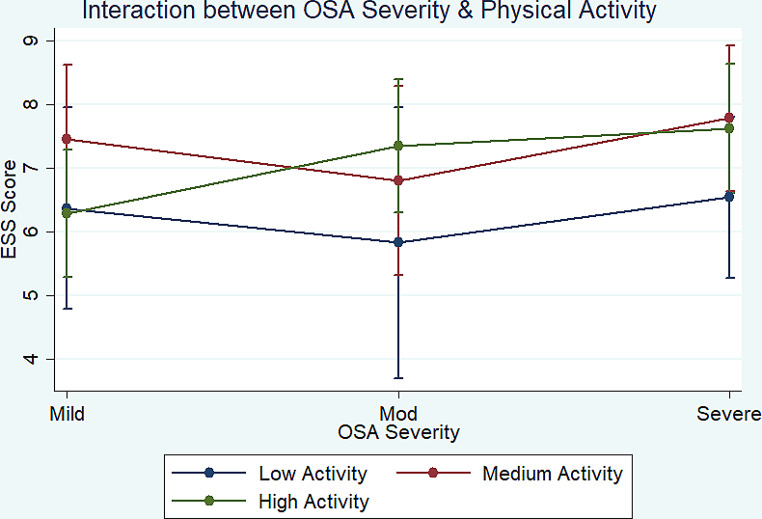 Figure 2
- —University of Sydney
Peer Reviews
No public reviews on file for this paper yet. If you reviewed it on a platform where reviews are public (OpenReview, ICLR, NeurIPS, ICML), you can paste yours below so the community can read it here.
Videos
No videos yet. Explain this paper in a talk, walkthrough, or lecture? Add one.
Taxonomy
TopicsObstructive Sleep Apnea Research · Sleep and related disorders · Sleep and Wakefulness Research
Background
Excessive daytime sleepiness represents one of the most recognisable and clinically significant feature of Obstructive Sleep Apnoea (OSA), with excessive sleepiness being a strongly recommended indication for treatment listed by the American Academy of Sleep Medicine [1]. OSA is a disease affecting approximately one billion individuals worldwide [2]. OSA is characterized by recurrent episodes of partial or complete upper airway obstruction during sleep, leading to intermittent hypoxemia and sleep fragmentation, which result in excessive daytime sleepiness—defined as ‘daily episodes of an irrepressible need to sleep or daytime lapses into sleep [3]. The effect of this excessive daytime sleepiness extends beyond individual patients to public health, economic productivity and societal influences [2].
Physical activity (PA) includes a range of movement behaviours of varying intensities. Exercise captures only dedicated periods of high exertion whereas physical activity incorporates moderate activity (such as gentle cycling) as well as time spent walking. There is evidence to show that acute and chronic exercise positively affect sleep architecture, enhancing slow-wave sleep and modulating rapid eye movement (REM) [4, 5]. The timing of this activity may be important as exercise within 4 h of sleep can evoke a stress response and compromise sleep quality, though this has been an inconsistent finding [6–8]. While exercise and physical activity positively impacts mood and sleep quality, its influence on excessive daytime sleepiness remains relatively unexplored [9, 10]. Moreover, a bidirectional relationship is seen whereby excessive daytime sleepiness curtails physical activity due to diminished motivation.
Despite the pivotal role of PA in health, there is little research on physical activity patterns in OSA. Existing evidence suggests a potential association between increased physical activity with reduced daytime sleepiness and anxiety, alongside enhanced sleep quality in individuals with OSA [11, 12]. PA also appears to correlate with attenuated OSA severity and better treatment outcomes [13, 14]. Two previous studies have shown that PA is correlated with reduced daytime sleepiness, as measured by the Epworth Sleepiness Score (ESS) among OSA patients [12, 15]. However, no previous studies have controlled for OSA severity when examining this relationship, although it is possible OSA severity is affected by with physical inactivity and contributes to greater sleep deficits.
This study aimed to describe PA patterns among individuals with OSA and to assess the interaction of PA levels and OSA severity on excessive daytime sleepiness. We hypothesised that PA would be negatively correlated with both OSA severity and excessive daytime sleepiness.
Methods.
Study design
Data for this cross-sectional study were collected as part of the Sydney Sleep Biobank (SSB) [16]. The SSB includes polysomnography and a comprehensive questionnaire collected from patients of three tertiary hospitals across Sydney (Royal North Shore Hospital, Royal Prince Alfred Hospital and Westmead Hospital) and the Westmead Institute for Medical Research in Australia. Data were collected between August 2018 and June 2022. The SSB recruits patients from tertiary outpatient sleep services referred for polysomnography for any indication. Referrals to these tertiary sleep services are predominantly made from general practice although can also include complex sleep patients referred for a subspecialist opinion by other respiratory and sleep services around the state of New South Wales.
Participants
Participant selection from the Sydney Sleep Biobank for this study is shown in Fig. 1. Participants were included if they were aged 18 years or older with an apnoea-hypopnoea index (AHI) of ≥ 5 events/hour on polysomnography (PSG). We note that for the Biobank as a whole, the most common indication for PSG was suspected obstructive sleep apnoea syndrome (84.2%) with symptoms on referral including daytime fatigue (89.9%), snoring (71.6%), and witnessed apnoeas (42.2%). Participants were excluded if they: (1) reported other sleep disorders which contribute to daytime sleepiness, such as narcolepsy, restless legs syndrome or insomnia; (2) reported an average nightly sleep duration of ≥ 10 or < 4 h; (3) reported being on current OSA therapy; (4) had central events making up more than 20% of their total AHI; (5) reported having any other sleep disturbance including nerve pain, night-time epilepsy, periodic limb movement disorder, sleep paralysis or disturbed sleep from pain; (6) reported use of sedating or stimulating drugs amongst their regular medications, including benzodiazepines, opioids, zolpidem/zopiclone, modafinil/armodafinil or dexamphetamine; (7) were shift workers who performed overnight-shifts (10pm to 8am) as part of their current employment (Fig. 1).
Fig. 1. Participant selection flow chart
Measurements
PA was assessed using the International Physical Activity Questionnaire (IPAQ) which measures time spent undertaking varying levels of PA in the preceding seven days and which has been validated for OSA populations [17]. Metabolic equivalent minutes of activity per week were calculated based on responses to this questionnaire as ‘MET-Min/week’ [18, 19]. MET-Min/week were calculated through the addition of all physical activity with one minute of walking equivalent to 3.3 MET-min, one minute of moderate exercise equivalent to 4 MET-Min and one minute vigorous activity equivalent to 8 MET-min [20]. Participants were grouped into categories of ‘Low Physical Activity’ (0-599 MET-Min/week), ‘Moderate Physical Activity’ (600-2,999 MET-Min/week) or ‘High Physical Activity’ (≥ 3,000 MET-Min/week) [21–23]. 600 MET-Min/week is equivalent to approximately 3 h walking per week, or 2.5 h of moderate activity per week, or 75 min of vigorous activity per week, or a combination of these [22]. The cut-offs were chosen based on the World Health Organisation recommendations for physical activity as well as previously published papers using the IPAQ questionnaire [22, 24]. Physical activity patterns were also examined based on the hours spent sitting, walking, and engaging in moderate to vigorous activity (see Fig. 2).
Fig. 2. Sleepiness by Obstructive sleep apnoea severity and Level of physical activity. Physical Activity: Low = < 600Met-Min/week; Medium = 600-3,000 Met-Min/Week; High = > 3,000 Met-Min/week. OSA severity: Mild = AHI 5 to < 15 events/h; moderate = 15 to < 30 events/h; severe = ≥ 30 events/h. Abbreviations: OSA, obstructive sleep apnoea. Error bars are 95% confidence intervals
OSA severity was grouped into three categories of mild (AHI 5-14.9 events/hour), moderate (AHI 15-29.9 events/hour) and severe (AHI ≥ 30 events/hour) based on the American Academy of Sleep Medicine guidelines [25]. Age, sex, body mass index and self-reported sleep duration were considered covariates. Sleep duration was based on question four of the completed Pittsburgh Sleep Quality Index (PSQI) “how many hours of actual sleep do you get at night” which reflects patients’ usual habits during the past month [26].
Excessive daytime sleepiness was assessed using the Epworth Sleepiness Scale (ESS) [27, 28]. ESS is an eight item questionnaire which measures daytime sleepiness with a high degree of unidimensionality [29]. It uses scores ranging from 0 to 24 with scores greater than 10 considered excessively sleepy [28].
Statistical analysis
All statistical analyses were conducted in Stata 14.2 (StataCorp LP, College Station TX). Differences between the physical activity groups were assessed with one-way ANOVA for continuous variables (age, BMI, sleep duration, AHI, hours of activity and MET-min/week) and chi-squared tests for categorical variables (sex, physical activity group, OSA severity group).
Linear regression analyses were then performed to estimate the effect of physical activity (categorical) and OSA severity (categorical) on ESS (continuous) with adjustment for confounders. Model 0 included OSA severity, sleep duration, age, BMI, and sex as predictors of ESS. Model 1 added physical activity (categorical) to the model. To examine interactions between OSA severity and physical activity on ESS, an interaction term was generated and added to Model 2.
Three sensitivity analyses were conducted as shown in the supplementary materials. The first involved carrying out the regression models including physical activity and OSA severity (AHI) as continuous, rather than categorical, variables. The second sensitivity analysis was performed to assess the removal of BMI from the models to determine whether physical activity influences ESS primarily through obesity, by comparison with the main models presented. We also examined potential sex differences by repeating the Model 1 analysis in males and females separately. Finally, Model 1 was repeated with ESS as a continuous variable.
The significance level was defined as P < 0.05 for all analyses.
Results
Participant characteristics for the sample and by OSA severity group are presented in Table 1. In the sample overall, an average of 41 h of sitting, 7 h of walking, 5 h of moderate-intensity activity, and 4 h of vigorous intensity were reported each week (Table 1). However, there were no differences in mean sitting time, mean walking time, nor mean moderate and vigorous PA time between OSA severity groups.
High levels of overall physical activity were reported by 47% of the sample, moderate levels of physical activity by 32%, and low physical activity by only 21% (Table 1). Overall physical activity differed by OSA severity with more than half of those with mild OSA achieving high levels of physical activity, whilst patients with severe OSA were evenly divided into those with low/medium/high levels of activity (Table 1).
Table 1. Participant characteristics by obstructive sleep Apnoea (OSA) severity (n = 487)Total (n = 487)Mild OSA (n = 171)Moderate OSA (n = 125)Severe OSA (n = 191)Test statistic, p-valueMean AHI (SD)31.2 (25.3)9.5 (2.9)31.4 (4.3)56.9 (21.7)F(2,486) = 565.8P < 0.01Age in years (SD)53.7 (14.2)52.5 (14.7)54.1 (14.9)54.3 (14.6)F(2,486) = 0.81P = 0.45Men (n, %)347 (71.3%)108 (63.2%)88 (70.4%)151 (79.1%)Chi^2^(2) = 11.19Women140 (28.8%)60 (36.8%)37 (29.6%)40 (20.9%)P < 0.01BMI in kg/m^2^ (SD)32.5 (8.3)29.2 (6.3)31.2 (7.0)36.2 (9.2)F (2,486) = 39.90P < 0.01Sleep Duration in hours (SD)6.7 (1.2)6.9 (1.2)6.6 (1.0)6.7 (1.3)F (2,486) = 3.21P = 0.04Physical Activity Level-Low (< 600 MET-min/week)101 (20.7%)31 (30.7%)60 (38.7%)80 (34.6%)Chi^2^(4) = 14.24-Medium (600-2,999 MET-min/week)155 (31.8%)17 (16.8%)35 (22.6%)73 (31.6%)P <0.01-High (≥ 3,000 MET-min/week)231 (47.4%)53 (52.5%)60 (38.7%)78 (33.8%)Total Metabolic-Equivalent Minutes/week (SD)4598.0 (5296.2)4,517.1 (5,208.6)4,894.4 (4,306.4)4,476.4 (5,940.8)F (2,486) = 0.27P = 0.77Sitting Hours/week (SD)40.8 (25.4)42.6 (25.2)38.9 (24.7)40.4 (26.1)F (2, 486) = 0.77P = 0.47Walking Hours/week (SD)6.9 (9.2)7.0 (9.8)6.7 (6.1)6.9 (10.2)F (2,486) = 0.04P = 0.96Moderate Activity Hours/week (SD)4.8 (8.0)4.63 (8.6)5.69 (7.8)4.28 (7.6)F (2,486) = 1.21P = 0.30Vigorous Activity Hours/week (SD)4.4 (7.6)4.21 (6.9)4.60 (5.9)4.35 (9.1)F (486) = 0.09P = 0.91Moderate-to-Vigorous Activity Hours/week (SD)9.1 (12.8)8.8 (12.9)10.3 (11.0)8.6 (13.9)F (2,486) = 0.70P = 0.50Mean ESS (SD)7.0 (4.7)6.8 (4.5)7.2 (5.0)7.1 (4.6)F (2,486) = 0.43P = 0.65
Participant characteristics by physical activity group (low/medium/high) are displayed in Table 2.
Table 2. Participant characteristics by level of physical activity (n = 487)Low Physical Activity (n = 101)Medium Physical Activity (n = 155)High Physical Activity (n = 231)Test statistic, p-valueMean AHI (SD) events/h37.8 (28.1)30.0 (23.8)29.0 (24.6)F (2, 486) = 4.58P = 0.01Age in years (SD)54.3 (14.0)55.0 (14.3)52.5 (14.2)F (2,486) = 1.57P = 0.21Men (n, %)63 (63.4%)101 (65.2%)183 (79.2%)Chi^2^(2) = 13.85Women38 (37.6%)54 (34.8%)38 (20.8%)P < 0.01BMI in kg/m^2^ (SD)35.9 (9.8)32.2 (8.2)31.2 (7.2)F (2, 486) = 12P < 0.01Sleep Duration in hours (SD)6.8 (1.4)6.8 (1.1)6.7 (1.2)F (2, 486) = 0.16P = 0.8Mean ESS (SD)6.2 (5.1)7.4 (4.5)7.2 (4.5)F (2, 486) = 2.39P = 0.09Mean Sitting Hours/week (SD)35.5 (34.0)45.4 (24.7)40 (20.6)F (2, 486) = 5.00P = 0.01Mean Walking Hours/week (SD)0.6 (0.9)5.5 (3.4)10.5 (11.8)F (2, 486) = 52.4P < 0.01Mean Moderate Activity Hours/week (SD)0.0 (0.2)1.3 (2.2)9.2 (9.8)F (2, 486) = 92.1P < 0.01Mean Vigorous Activity Hours/week (SD)0 (0)0.36 (1.1)9.0 (9.0)F (2, 486) = 119.9P < 0.01Mean Moderate-to-Vigorous Activity Hours/week (SD)0.0 (0.2)1.6 (2.5)18.1 (13.7)F (2, 486) = 195.7P < 0.01
There were no significant differences between physical activity groups on age or sleep duration.
There was a higher proportion of men in the most physically active group compared to the least physically active group. Participants who were the least physically active had significantly higher BMI and AHI than those in the medium and high physical activity groups. Participants who were the least physically active appeared to have lower levels of daytime sleepiness, although this did not reach statistical significance (Table 2).
Table 3 shows the results of the regression modelling. As expected, older age, higher BMI, and shorter sleep duration were independent predictors of ESS scores, while OSA severity was not significantly correlated with ESS (Model 0). When physical activity was added into the regression model, it was found that participants with medium levels of physical activity had significantly higher ESS (compared to those with low levels of physical activity) while no significant difference was observed between those with high and low levels of physical activity (Model 1). Addition of a PA level by OSA severity interaction term did not significantly change the results (Model 2); likelihood ratio test comparing Model 1 (without the interaction term) to Model 2 (with the interaction term) was not statistically significant (LR Chi^2^(4) = 2.75, P = 0.60).
Table 3. Regression models assessing the association of ESS with physical activity level and OSA severityESS difference in unstandardised unitsModel 0 (95% CI) P Model 1 (95% CI)^a^ P Model 2 (95% CI)^b^ P
Gender MaleReference-Reference-Reference-Female0.58 (-0.34,1.50)0.220.60 (-0.33,1.53)0.20.56 (-0.37,1.50)0.24 Age -0.04 (-0.07,-0.01)0.01-0.04 (-0.07,-0.01)0.01-0.03 (-0.06,-0.01)0.02 BMI -0.06 (-0.11,-0.01)0.03-0.05 (-0.12,0.00)0.06-0.05 (-0.10,0.01)0.09 Sleep Duration -1.12 (-1.45,-0.78)< 0.01-1.12 (-1.43,-0.77)< 0.01-1.09 (-1.42,-0.75)< 0.01 OSA Severity MildReference-Reference-Reference-Moderate0.29 (-0.75,1.34)0.590.27 (-0.78,1.32)0.61-0.54 (-3.19,2.11)0.69Severe0.74 (-0.29,1.77)0.160.78 (-0.24,1.81)0.140.18 (-1.87,2.22)0.87 PA Level LowReference-Reference-Medium1.15 (0.02,2.28)0.051.09 (-0.85,3.03)0.27High0.79 (-0.30,1.87)0.15-0.08 (-1.94,1.78)0.93OSA Severity x PA Level*0.94Moderate OSA x Medium PA-0.11 (-3.35,3.12)0.3Moderate OSA x High PA1.59 (-1.41,4.60)0.91Severe OSA x Medium PA0.15 (-2.41,2.70)0.25Severe OSA x High PA1.15 (-1.27,3.58)*Interaction base levels are Mild OSA and Low Physical activityModel 0 examines the association between OSA severity and ESS adjusting only for gender, age, BMI and sleep duration^a^Model 1 additionally adjusts for physical activity level in addition to gender, age, BMI, sleep duration, and OSA severity^b^Model 2 additionally adjusts for the OSA severity and physical activity interaction term, in addition to gender, age, BMI, sleep duration, OSA severity, and physical activity level
Sensitivity analysis using continuous instead of categorical physical activity and AHI revealed similar results (Supplementary Table 1). Sensitivity analysis without adjustment for BMI showed although the small change in coefficients for physical activity suggests that BMI is partially mediating the relationship between physical activity and sleepiness (Supplementary Table 2).
In the sex-stratified analysis, a clear correlation between increasing physical activity and higher ESS scores was observed exclusively in females, while no such correlation was found in males (Supplementary Table 3a). Additionally, when ESS was analysed as a categorical variable (with ESS ≥ 10 indicating excessive daytime sleepiness and < 10 considered normal), no significant correlation between physical activity and excessive daytime sleepiness was detected (Supplementary Table 4).
Discussion
This study described physical activity patterns among patients with differing levels of OSA severity, most notably that participants with mild OSA are the most likely to have high levels of physical activity.
Contrary to our hypothesis, we found that physical activity was not significantly associated with excessive daytime sleepiness in the primary multivariate regression model. However, in the sex-stratified model there was a clear correlation in the opposite direction. We had hypothesised that increased physical activity would correlate with decreased ESS scores, based on previous research suggesting that exercise improved sleep quality. Surprisingly, our findings indicated that among women, increased PA was associated with increased ESS scores.
Several factors may explain this unexpected result. Sex differences in sleep architecture and the possibility that women experience an amplified response to circadian modulation induced by physical activity could be contributing factors [30, 31]. Additionally, hormonal differences may also play a role; for instance, testosterone release is more closely correlated with physical activity compared to oestradiol or progesterone [32]. It is conceivable that while physical activity induces a need for sleep and rest in both sexes, this effect in males might be counterbalanced by the post-exercise increase in testosterone [33], particularly given that low testosterone levels in OSA are associated with increased fatigue [34].
Mild OSA may be correlated with higher levels of physical activity for several reasons. Acutely, physical activity has been shown to lead to fluid redistribution, increased muscle tone, and reduced OSA severity [15, 35–39]. Longer-term, physical activity is also linked to weight loss, a key risk factor for OSA severity [15]. It is also likely that reduced physical activity increases obesity and worsens OSA. This is supported by the finding that the least physically active participants had the highest AHI.
The Australian Government’s Department of Health and Aged Care Guidelines on Physical Activity and Exercise recommends that adults (aged 18 to 64) should undertake either 2.5 to 5 h of moderate intensity physical activity per week or 1.25 to 2.5 h of vigorous activity per week or a combination of the two [40]. This would equate to a minimum recommendation of 600 MET-Min/week, meaning that 79% participants in our study reached these recommendations with 82% of mild, 86% of moderate and 72% of severe OSA patients undertaking at least 600 MET-Min/week. Whilst our findings align with previous studies regarding mean moderate-to-vigorous physical activity (MVPA) per week our sample had a much higher mean MET-Min/week and higher proportion of OSA patients in the ‘high physical activity’ group compared to previous literature [22, 41]. It is unclear why this is the case although there may be a healthy volunteer effect but also may reflect the heavy male overrepresentation. Whilst the EPISONO study in Brazil had 56% female population, our cohort was only 28.8% female [22]. Finally, there may be geographic, cultural, and socioeconomic differences in the approaches to exercise in our study compared to previous studies in Sao Paolo, Brazil [22] or Al-Hassa, Saudi Arabia [41].
These findings also suggest that ESS is not a reliable indicator of OSA severity and perhaps other OSA metrics such as arousal intensity or hypoxic burden may better predict OSA severity [42]. ESS measures “tendency to fall asleep” which is distinct from the drowsiness/sleepiness without unexpected somnolence caused by OSA. OSA is also phenotypically heterogenous and disease severity may only be linked to sleepiness in the ‘Excessively Sleepy’ phenotype [43]. The low mean ESS (mean ESS 7.0, SD 4.7) may also have caused a ceiling effect contributing to a lack of correlation between ESS with physical activity and OSA severity. Finally, it is possible that unmeasured confounding factors such caffeine, alcohol intake, and diet are affecting the relationship [44–46].
It was also curious that participants with the lowest level of physical activity had significantly lower ESS than those in the medium physical activity group. Previous research suggests exercise is associated with shorter sleep latency and longer sleep duration so it had been presumed that this would lead to reduced ESS [12, 15, 47]. It may be, however, that physical activity necessitates longer sleep for recovery in order to achieve the same level of wakefulness [48, 49]. Finally, it is possible that high levels of physical activity induce mild hypoglycaemia, and the resultant fatigue contributed to participants’ reporting of sleepiness [50].
The strengths of this study are that it controlled for multiple confounders including medications, comorbid sleep disorders, and shift work, which has not been done in previous studies on this question. It also had a large sample size of 487 participants recruited from more than one site [15].
The main limitation of this study is the cross-sectional study design which prevents inference of a causal relationship between physical activity, OSA severity, and sleepiness. It is likely that there is a bidirectional relationship between physical activity and sleepiness in which physical activity may induce or reduce sleepiness but sleepiness may also limit a person’s ability to undertake physical activity. The study is also limited by reliance on self-reported physical activity which is prone to bias; previous studies suggest that patients may overestimate their physical activity [51]. Finally, the time of day that physical activity occurred was unable to be recorded and it may be that evening physical activity was detrimental to sleep quality whilst morning activity was beneficial to wakefulness [52, 53]. Future research should also employ objective measures of physical activity whilst utilising a longitudinal study design to elucidate the direction of causality between activity and sleepiness.
In conclusion, this study brings to light the physical activity patterns in patients with differing levels of OSA severity, showing no mean difference in time spent sitting, walking, or undertaking moderate-to-vigorous physical activity across OSA severity groups, but that more patients with mild OSA engaged in high levels of physical activity as measured by metabolic-equivalent minutes of activity. Whilst physical activity is important for a myriad of health benefits it does not appear to be associated with reduced sleepiness symptoms amongst OSA patients; sleepiness was primarily accounted for by differences in age, obesity, and sleep duration across OSA severity groups. There may be sex differences as physical activity was associated with reduced sleepiness in women only and this unexpected finding will need to be replicated in future studies. More research is needed with objective measures of physical activity and varied metrics of assessing the clinical impact of OSA beyond ESS scores.
Electronic supplementary material
Below is the link to the electronic supplementary material.
Supplementary Material 1
The reference list from the paper itself. Each links out to its DOI / PubMed record.
- 1Dunn AL, Trivedi MH, Kampert JB, Clark CG, Chambliss HO (2005) Exercise treatment for depression: efficacy and dose response. American journal of preventive medicine;28(1):1–810.1016/j.amepre.2004.09.00315626549 · doi ↗ · pubmed ↗
- 2Silva R Pd, Martinez D, Bueno KSS, Uribe-Ramos JM (2019) Effects of exercise on sleep symptoms in patients with severe obstructive sleep apnea. Jornal Brasileiro de Pneumologia 4510.1590/1806-3713/e 20180085 PMC 671502531241653 · doi ↗ · pubmed ↗
- 3Cistulli P (2023) Sydney Sleep Biobank: University of Sydney: Charles Perkins Centre; [Available from: https://www.sydney.edu.au/charles-perkins-centre/our-research/sleep/sydney-sleep-biobank.html
- 4Guidelines for data processing and analysis of the International Physical Activity Questionnaire (IPAQ)-short and long forms: IPAQ Research Committee (2005) [Available from: http://www.ipaq.ki.se/scoring.pdf
- 5Craig CL, Marshall AL, Sjöström M, Bauman AE, Booth ML, Ainsworth BE et al (2003) International physical activity questionnaire: 12-country reliability and validity. Medicine & Science in Sports & Exercise 35(8):1381-9510.1249/01.MSS.0000078924.61453.FB 12900694 · doi ↗ · pubmed ↗
- 6Bull FC, Al-Ansari SS, Biddle S, Borodulin K, Buman MP, Cardon G et al (2020) World health organization 2020 guidelines on physical activity and sedentary behaviour. Br J Sports Med 54(24):1451–146210.1136/bjsports-2020-102955 PMC 771990633239350 · doi ↗ · pubmed ↗
- 7Mônico-Neto M, Antunes HKM, Dos Santos RVT, D’Almeida V, de Souza AAL, Bittencourt LRA et al (2018) Physical activity as a moderator for obstructive sleep Apnoea and cardiometabolic risk in the EPISONO study. Eur Respir J 52(4)10.1183/13993003.01972-201730093572 · doi ↗ · pubmed ↗
- 8Zota IM, Roca M, Leon MM, Cozma CD, Anghel L, Statescu C et al (2023) Long-Term Adherence in Overweight Patients with Obstructive Sleep Apnea and Hypertension—A Pilot Prospective Cohort Study. Diagnostics;13(8):144710.3390/diagnostics 13081447 PMC 1013795437189548 · doi ↗ · pubmed ↗