Correction: Experimental peri-implantitis induces neuroinflammation: An exploratory study in rats
Emilio A. Cafferata, Ausra Ramanauskaite, Astrid Cuypers, Karina Obreja, Eva Dohle, Shahram Ghanaati, Frank Schwarz

Abstract
Genes, proteins, chemicals, diseases, species, mutations and cell lines named across the full text — each resolved to its canonical identifier and authoritative record.
Click any figure to enlarge with its caption.
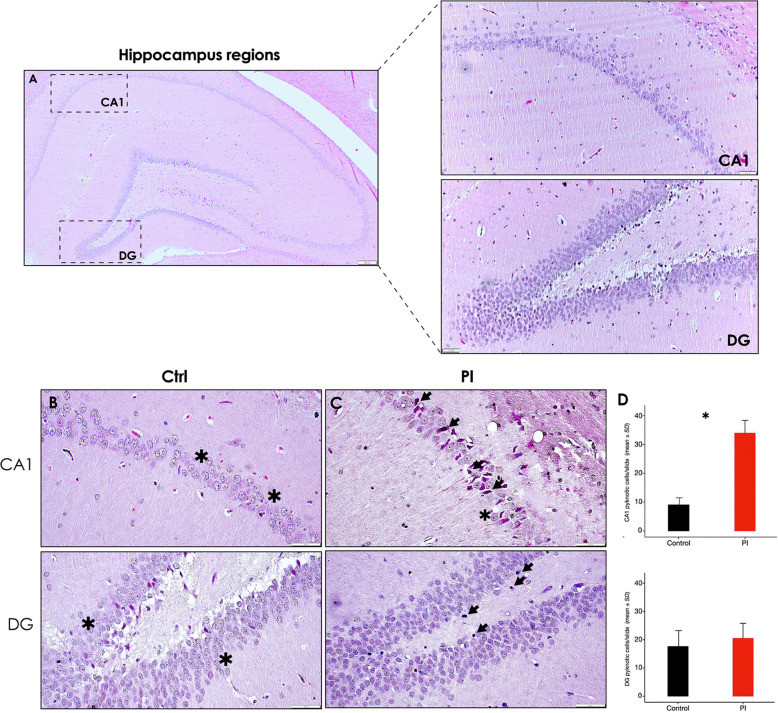 Figure 1
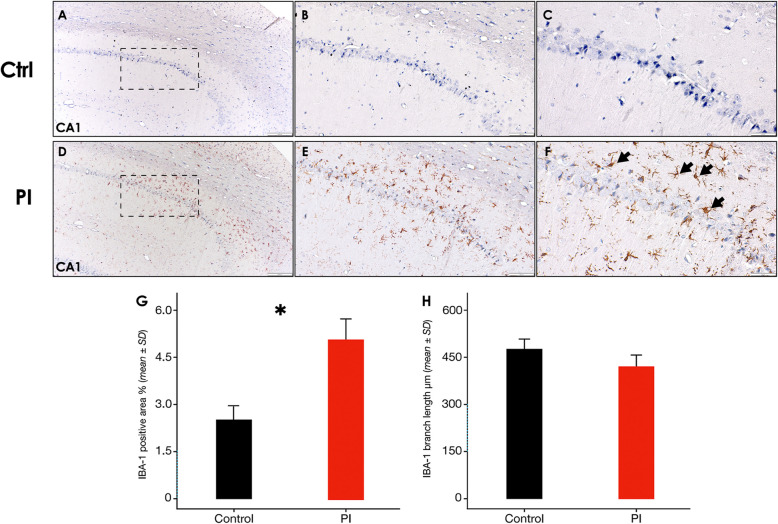 Figure 2
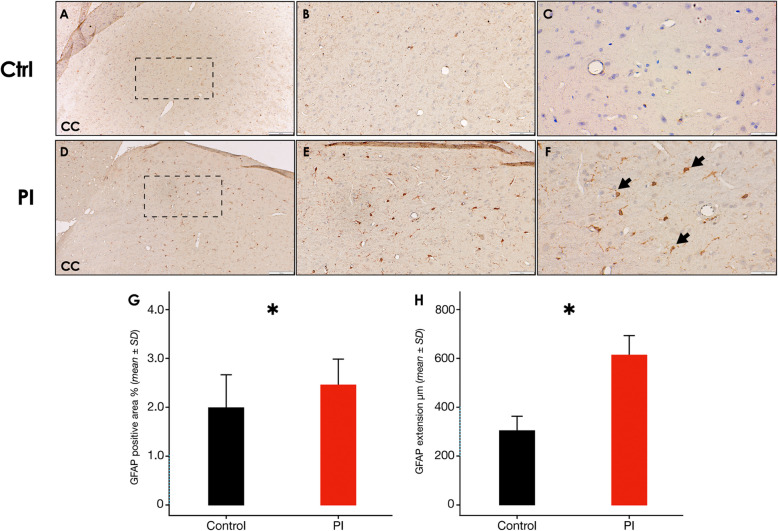 Figure 3
Peer Reviews
No public reviews on file for this paper yet. If you reviewed it on a platform where reviews are public (OpenReview, ICLR, NeurIPS, ICML), you can paste yours below so the community can read it here.
Videos
No videos yet. Explain this paper in a talk, walkthrough, or lecture? Add one.
Taxonomy
TopicsMedical and Biological Ozone Research
Correction **: ** BMC Oral Health 24, 1238 (2024)
https://doi.org/10.1186/s12903-024-04995-z
In this article [1], part of the Fig. 3, Fig. 7 and Fig. 8 are missing, specifically panels Fig. 3b-c-d, Fig. 7g-h, and Fig. 8g-h, which depict the relative quantification of pyknotic neurons, IBA-1^+^ and GFAP^+^ cells, respectively. The Figs. 3, 7 and 8 should have appeared as shown below.
Fig. 3. Hippocampus H&E staining showing cellular morphological alterations following experimental PI. A Representative image showing the hippocampus regions -CA1, CA2, C3, CA4 and DG-, the regions of interest CA1 and DG are delimited by dashed squares [5x]; Right: Representative imagesof the CA1 (superior) and DG (inferior) hippocampus regions of the control group [10x]. B and C Representative images of the CA1 (superior) and DG(inferior) hippocampus regions of the control and peri-implantitis group, showing morphologically altered neurons and glial cells [40x]. D Relative quantificationof pyknotic cells in the CA1 and DG regions of the hippocampus of rats in control and PI groups. Data are represented as mean ± SD pyknoticcells from 10 random slides per sample. *p < 0.05.CA: Cornu ammonis; DG: dentate gyrus; PI: peri-implantitis group; CTRL: control group; ↘: pyknotic pyramidal neuron; *: normal neuron. Figure scales correspond to: superior [200 μm], superior right [100 μm] and inferior [50 μm] figures
Fig. 7. Hippocampus IBA-1 immunostaining following experimental PI. A Representative hippocampus image of the control group, showing the CA1 region, a zoom augmented area is delimited by a dashed square [10x], B [20x] and C [40x]. D Representative hippocampus image of the peri-implantitis group, showing the CA1 region, a zoom augmented area is delimited by a dashed square [10x], E [20x] and F [40x]. G IBA-1^+^ surface coverage percentage and H) IBA-1^+^ Microglia branch length in the CA1 region of the hippocampus of rats in control and PI groups. Data are represented as mean ± SD of the percentage of positively stained area from 10 random slides per sample, or mean ± SD of the branches length divided by the number of cells per slide from 10 random slides per sample. *p < 0.05. PI: peri-implantitis group; CTRL: control group; ↘: IBA-1 positive cell. Figure scales correspond to:left [200 μm], middle [100 μm] and right [50 μm] figures
Fig. 8. Cerebral cortex GFAP immunostaining following experimental PI. Representative image of the control group showing the cerebral cortex,a zoom augmented area is delimited by a dashed square [10x], B [20x] and C [40x]. D Representative image of the peri-implantitis group showing the cerebral cortex, a zoom augmented area is delimited by a dashed square [10x], E [20x] and F [40x]. G GFAP^+^ surface coverage percentage in the cerebral cortex of rats in control and PI groups. Data are represented as mean ± SD of the percentage of positively stained area from 10 random slides per sample. *p < 0.05. PI: peri-implantitis group; CTRL: control group; ↘: GFAP positive cell. Figure scales correspond to: left [200 μm], middle [100 μm]and right [50 μm] figures
The original article has been corrected.