Effects of FABP5 Expression on Clinicopathological and Survival Characteristics in Digestive System Malignancies: A Systematic Review and Meta‐Analysis
Miaoqing Li, Xiaoxia Wang, Jia Guo, Junchen Qu, Yu Cao, Qingkun Song, Jun Lu

TL;DR
This study finds that high FABP5 levels are linked to worse outcomes in digestive cancers, suggesting it could be a useful biomarker.
Contribution
The study provides a meta-analysis and mechanistic insights into FABP5's role in digestive system malignancies.
Findings
FABP5 overexpression is associated with poorer survival and advanced tumor features in digestive cancers.
FABP5 promotes cancer cell growth and spread in liver and stomach cancer cell lines.
FABP5 may drive tumor progression through PPARβ/δ and other related pathways.
Abstract
Digestive system malignancies are a major global health burden, and the role of fatty acid binding protein 5 (FABP5) in these tumors remains controversial. This meta‐analysis aimed to evaluate the correlation between FABP5 expression and clinicopathological features, as well as survival outcomes in digestive system malignancies. Data from 11 studies (1207 patients) retrieved from PubMed, Embase, Cochrane Library, CNKI, and WanFang were analyzed. FABP5 overexpression was associated with poorer overall survival (OS), larger tumor size, advanced UICC stage, and increased risk of vascular invasion and lymph node metastasis. Notably, FABP5 overexpression is particularly associated with poorer OS in the subgroup of digestive tract malignancies and larger tumor sizes in the subgroup of Chinese patients. Cellular experiments demonstrated that FABP5 overexpression enhances proliferation,…
Genes, proteins, chemicals, diseases, species, mutations and cell lines named across the full text — each resolved to its canonical identifier and authoritative record.
Click any figure to enlarge with its caption.
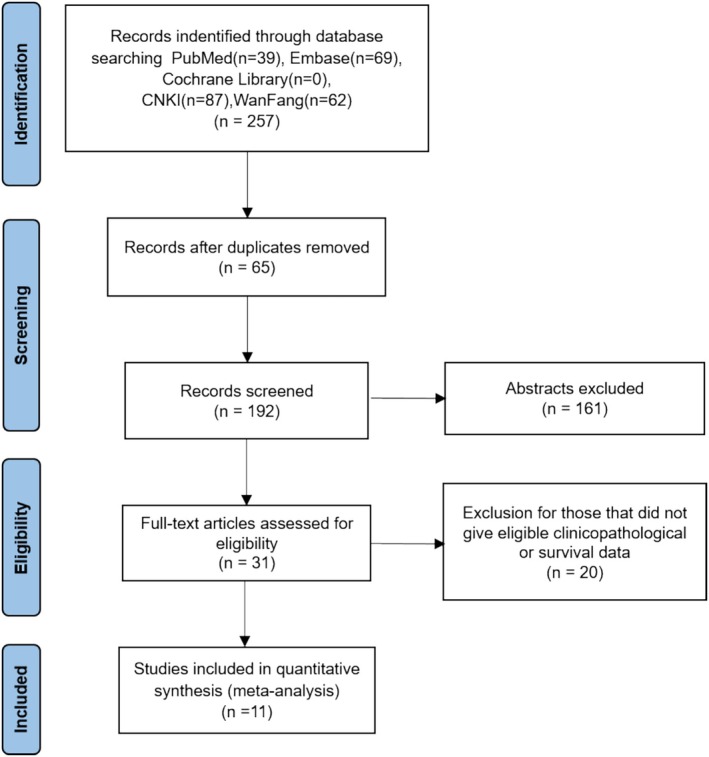 FIGURE 1
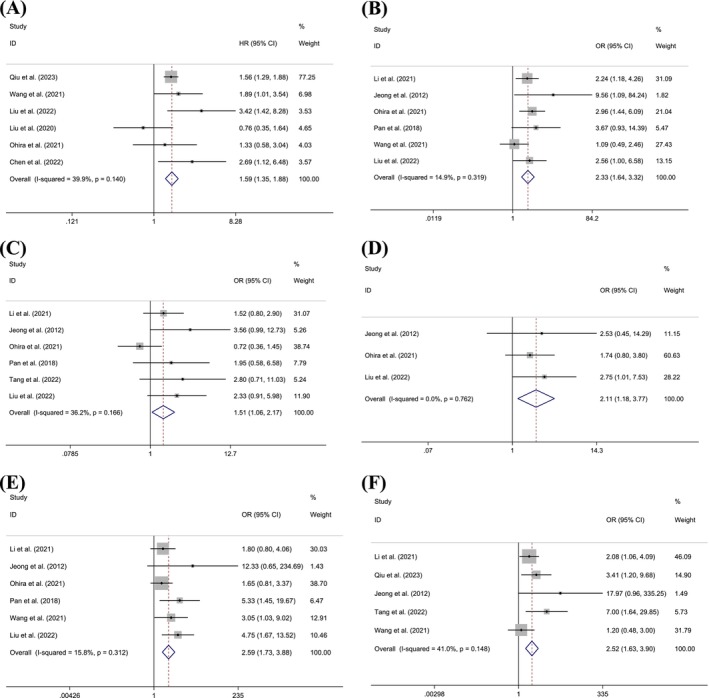 FIGURE 2
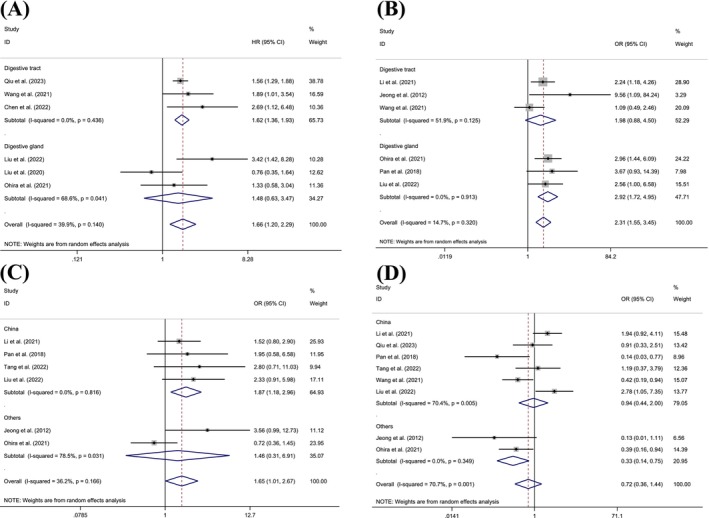 FIGURE 3
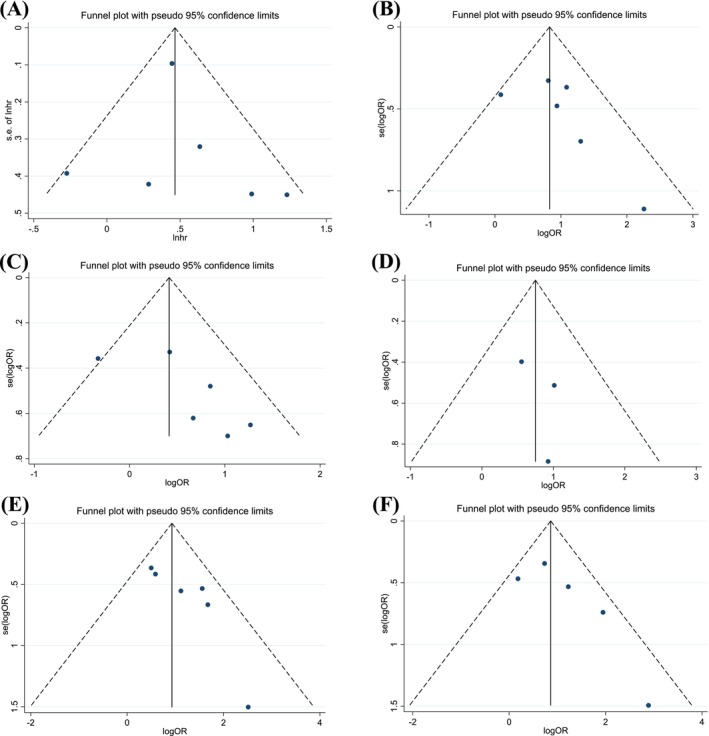 FIGURE 4
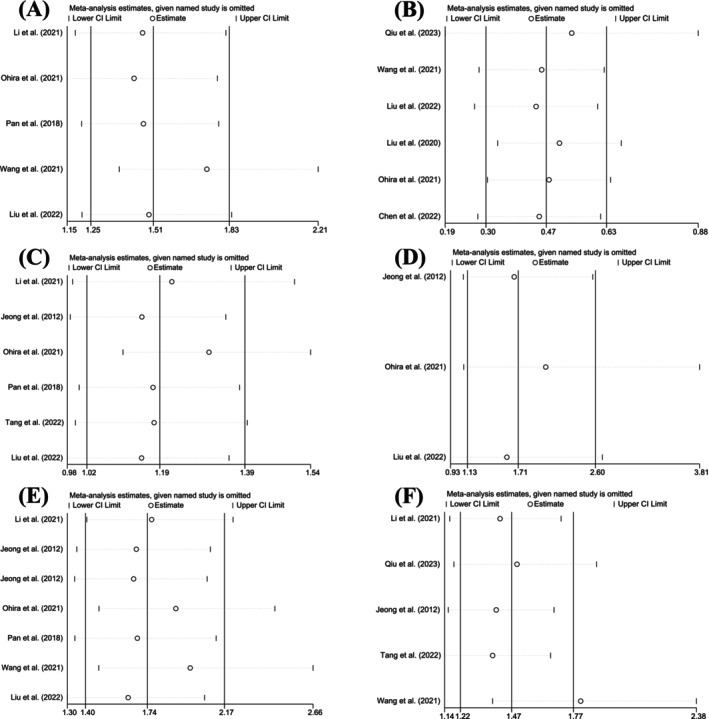 FIGURE 5
| Authors | Year | Country | Tumor | No. of patients | Sample | Assessment method | Survival analysis | HRs of survival analysis | Gender (Male vs. Female) | Age (> 60 vs. < 60) | UICC stage (III + IV vs. I + II) | Tumor size (> 5 cm vs. ≤ 5 cm) | Tumor number (multinodular vs. single) | Tumor differentiation (moderate and high vs. low) | Vascular invasion (present vs. absent) | Nerve invasion (present vs. absent) | Lymph node metastasis (present vs. absent) | NOS score |
|---|---|---|---|---|---|---|---|---|---|---|---|---|---|---|---|---|---|---|
| Chen et al. | 2022 | China | ESCC | 56 | tissue | IHC | OS | Estimate | 43/13 | NR | NR | NR | NR | NR | NR | NR | NR | 8 |
| Li et al. | 2021 | China | ESCC | 344 | tissue | IHC | NR | NR | 119/53 | 83/58 | 99/102 | 116/56 | NR | 137/35 | 33/139 | 35/137 | 57/115 | 8 |
| Qiu et al. | 2023 | China | GC | 104 | tissue | IHC | OS | Reported in article | 55/24 | NR | NR | NR | NR | 59/20 | NR | NR | 57/22 | 8 |
| Wang et al. | 2021 | China | GC | 101 | tissue | IHC | OS | Reported in article | 70/31 | NR | 62/38 | NR | NR | 53/48 | 48/20 | 37/35 | 77/24 | 7 |
| Jeong et al. | 2012 | Korea | ICC | 59 | tissue | IHC | NR | NR | NR | NR | 10/33 | 28/21 | 22/35 | 34/9 | 6/37 | 8/35 | 8/35 | 6 |
| Liu et al. | 2022 | China | HCC | 76 | tissue | IHC | OS | Reported in article | 57/19 | 40/32 | 35/41 | 36/40 | NR | NR | 53/53 | NR | NR | 7 |
| Liu et al. | 2020 | China | HCC | 118 | tissue | IHC | OS/DFS | Estimate | NR | NR | NR | NR | 23/53 | 42/34 | NR | NR | NR | 7 |
| Ohira et al. | 2021 | Japan | HCC | 220 | tissue | WB | OS/DFS | Estimate | 107/21 | NR | 59/69 | 59/71 | 72/92 | 101/27 | 50/78 | NR | NR | 7 |
| Pan et al. | 2018 | China | HCC | 43 | tissue | IHC | NR | NR | 35/8 | NR | 27/28 | 21/22 | NR | 31/12 | 22/21 | NR | NR | 6 |
| Tang et al. | 2022 | China | HCC | 48 | tissue | IHC | NR | NR | 21/13 | 16/32 | NR | 36/12 | NR | 19/29 | NR | NR | 15/33 | 7 |
| Seo et al. | 2020 | Korea | HCC | 38 | tissue | IHC | DFS | Estimate | NR | NR | NR | NR | NR | NR | NR | NR | NR | 8 |
| Characteristics | No. of studies | No. of patients | Pooled HR/OR (95% CI) |
| Heterogeneity | |
|---|---|---|---|---|---|---|
|
|
| |||||
| Overall survival | 6 | 558 | 1.592 (1.349, 1.880) | < 0.001 | 39.9 | 0.140 |
| Disease‐free survival | 3 | 284 | 1.049 (0.529, 2.081) | 0.891 | 69.6 | 0.037 |
| Gender (Male vs. Female) | 8 | 689 | 0.782 (0.554, 1.104) | 0.163 | 0.0 | 0.769 |
| Age (> 60 years vs. < 60 years) | 3 | 261 | 0.923 (0.569, 1.498) | 0.747 | 21.0 | 0.282 |
| UICC stage (III + IV vs. I + II) | 6 | 603 | 2.331 (1.637, 3.319) | < 0.001 | 14.9 | 0.319 |
| Tumor size (> 5 cm vs. ≤ 5 cm) | 6 | 518 | 1.515 (1.056, 2.174) | 0.024 | 36.2 | 0.166 |
| Tumor number (multinodular vs. single) | 3 | 297 | 2.114 (1.185, 3.774) | 0.011 | 0.0 | 0.762 |
| Tumor differentiation (moderate and high vs. low) | 8 | 690 | 0.722 (0.361, 1.443) | 0.356 | 70.7 | 0.001 |
| Vascular invasion (present vs. absent) | 6 | 560 | 2.590 (1.729, 3.881) | < 0.001 | 15.8 | 0.312 |
| Nerve invasion (present vs. absent) | 3 | 287 | 0.985 (0.571, 1.700) | 0.958 | 0.0 | 0.485 |
| Lymph node metastasis (present vs. absent) | 5 | 443 | 2.518 (1.626, 3.900) | < 0.001 | 41.0 | 0.148 |
| Subgroup | No. of studies | No. of patients | Pooled HR/OR (95% CI) |
| Heterogeneity | |
|---|---|---|---|---|---|---|
|
|
| |||||
| Overall survival | 6 | 558 | 1.592 (1.349, 1.880) | < 0.001 | 39.9 | 0.140 |
| Tumor name | ||||||
| GC | 2 | 180 | 1.585 (1.323, 1.899) | < 0.001 | 0.0 | 0.570 |
| ESCC | 1 | 56 | 2.690 (1.117, 6.475) | — | — | — |
| HCC | 3 | 322 | 1.480 (0.632, 3.466) | 0.366 | 68.6 | 0.041 |
| Tumor type | ||||||
| Digestive tract | 3 | 236 | 1.619 (1.356, 1.933) | < 0.001 | 0.0 | 0.436 |
| Digestive gland | 3 | 322 | 1.480 (0.632, 3.466) | 0.366 | 68.6 | 0.041 |
| Country | ||||||
| China | 5 | 430 | 1.723 (1.174, 2.526) | 0.005 | 50.8 | 0.087 |
| Others | 1 | 128 | 1.330 (0.582, 3.040) | — | — | — |
| Disease‐free survival | 3 | 284 | 1.049 (0.529, 2.081) | 0.891 | 69.6 | 0.037 |
| Country | ||||||
| China | 1 | 118 | 1.200 (0.791, 1.821) | — | — | — |
| Others | 2 | 166 | 1.056 (0.261, 4.264) | 0.939 | 79.4 | 0.027 |
| UICC stage | 6 | 603 | 2.331 (1.637, 3.319) | < 0.001 | 14.9 | 0.319 |
| Tumor name | ||||||
| GC | 1 | 101 | 1.093 (0.486, 2.456) | — | — | — |
| ESCC | 1 | 344 | 2.244 (1.181, 4.263) | — | — | — |
| ICC | 1 | 43 | 9.563 (1.085, 84.243) | — | — | — |
| HCC | 3 | 259 | 2.920 (1.721, 4.953) | < 0.001 | 0.0 | 0.913 |
| Tumor type | ||||||
| Digestive tract | 3 | 344 | 1.984 (0.876, 4.496) | 0.101 | 51.9 | 0.125 |
| Digestive gland | 3 | 259 | 2.920 (1.721, 4.953) | < 0.001 | 0.0 | 0.913 |
| Country | ||||||
| China | 4 | 432 | 1.989 (1.310, 3.020) | 0.001 | 8.5 | 0.351 |
| Others | 2 | 171 | 3.486 (1.777, 6.838) | < 0.001 | 2.4 | 0.312 |
| Tumor size | 6 | 790 | 1.515 (1.056, 2.174) | 0.024 | 36.2 | 0.166 |
| Tumor name | ||||||
| ICC | 1 | 43 | 3.556 (0.993, 12.733) | — | — | — |
| ESCC | 1 | 344 | 1.524 (0.800, 2.902) | — | — | — |
| HCC | 4 | 387 | 1.545 (0.760, 3.141) | 0.229 | 48.8 | 0.119 |
| Tumor type | ||||||
| Digestive tract | 2 | 403 | 1.932 (0.916, 4.075) | 0.084 | 26.0 | 0.245 |
| Digestive gland | 4 | 387 | 1.545 (0.760, 3.141) | 0.229 | 48.8 | 0.119 |
| Country | ||||||
| China | 4 | 511 | 1.870 (1.182, 2.959) | 0.008 | 0.0 | 0.816 |
| Others | 2 | 279 | 1.457 (0.307, 6.913) | 0.636 | 36.2 | 0.166 |
| Tumor number | 3 | 297 | 2.114 (1.185, 3.774) | 0.011 | 0.0 | 0.762 |
| Tumor name | ||||||
| ICC | 1 | 57 | 2.526 (0.447, 14.293) | — | — | — |
| HCC | 2 | 240 | 2.063 (1.115, 3.817) | 0.021 | 0.0 | 0.481 |
| Country | ||||||
| China | 1 | 76 | 2.753 (1.007, 7.529) | — | — | — |
| Others | 2 | 221 | 1.863 (0.917, 3.785) | 0.085 | 0.0 | 0.701 |
| Tumor differentiation | 8 | 995 | 0.722 (0.361, 1.443) | 0.356 | 70.7 | 0.001 |
| Tumor name | ||||||
| GC | 2 | 205 | 0.577 (0.275, 1.211) | 0.146 | 25.7 | 0.246 |
| ESCC | 1 | 344 | 1.941 (0.918, 4.106) | — | — | — |
| ICC | 1 | 43 | 0.125 (0.014, 1.111) | — | — | — |
| HCC | 4 | 387 | 0.719 (0.220, 2.352) | 0.585 | 77.4 | 0.004 |
| Tumor type | ||||||
| Digestive tract | 4 | 608 | 0.705 (0.268, 1.855) | 0.479 | 71.7 | 0.014 |
| Digestive gland | 4 | 387 | 0.719 (0.220, 2.352) | 0.585 | 77.4 | 0.004 |
| Country | ||||||
| China | 6 | 716 | 0.941 (0.443, 1.997) | 0.874 | 70.4 | 0.005 |
| Others | 2 | 279 | 0.329 (0.144, 0.750) | 0.008 | 0.0 | 0.349 |
| Vascular invasion | 6 | 560 | 2.590 (1.729, 3.881) | < 0.001 | 15.8 | 0.312 |
| Tumor name | ||||||
| ICC | 1 | 43 | 12.333 (0.648, 234.685) | — | — | — |
| GC | 1 | 101 | 3.051 (1.032, 9.022) | — | — | — |
| ESCC | 1 | 344 | 1.799 (0.797, 4.062) | — | — | — |
| HCC | 3 | 277 | 2.659 (1.566, 4.514) | < 0.001 | 49.9 | 0.136 |
| Tumor type | ||||||
| Digestive tract | 3 | 283 | 2.504 (1.340, 4.677) | 0.004 | 0.0 | 0.389 |
| Digestive gland | 3 | 277 | 2.659 (1.566, 4.514) | < 0.001 | 49.9 | 0.136 |
| Country | ||||||
| China | 4 | 389 | 2.966 (1.785, 4.930) | < 0.001 | 0.2 | 0.391 |
| Others | 2 | 171 | 2.029 (1.035, 3.978) | 0.039 | 43.4 | 0.184 |
| Nerve invasion | 3 | 287 | 0.985 (0.571, 1.700) | 0.958 | 0.0 | 0.485 |
| Country | ||||||
| China | 2 | 244 | 0.796 (0.377, 1.682) | — | — | — |
| Others | 1 | 43 | 1.254 (0.562, 2.795) | 0.580 | 0.0 | 0.356 |
| Lymph node metastasis | 5 | 656 | 2.518 (1.626, 3.900) | < 0.001 | 41.0 | 0.148 |
| Tumor name | ||||||
| GC | 2 | 205 | 1.961 (0.706, 5.446) | 0.196 | 53.9 | 0.2938 |
| ESCC | 1 | 344 | 2.083 (1.060, 4.092) | — | — | — |
| ICC | 1 | 43 | 17.971 (0.963, 335.249) | — | — | — |
| HCC | 1 | 48 | 7.000 (1.641, 29.854) | — | — | — |
| Tumor type | ||||||
| Digestive tract | 4 | 608 | 2.194 (1.179, 4.083) | 0.013 | 30.6 | 0.228 |
| Digestive gland | 1 | 48 | 7.000 (1.641, 29.854) | — | — | — |
| Country | ||||||
| China | 4 | 597 | 2.383 (1.294, 4.388) | 0.005 | 37.7 | 0.186 |
| Others | 1 | 59 | 17.971 (0.963, 335.249) | — | — | — |
| Characteristics |
|
|
|---|---|---|
| OS | 0.133 | 0.702 |
| UICC stage | 0.260 | 0.278 |
| Tumor size | 0.260 | 0.109 |
| Tumor number | 1.000 | 0.584 |
| Vascular invasion | 0.260 | 0.039 |
| Lymph node metastasis | 0.221 | 0.142 |
- —National Key Research and Development Program of China 10.13039/501100012166
- —Beijing Hospitals Authority’s Ascent Plan
Peer Reviews
No public reviews on file for this paper yet. If you reviewed it on a platform where reviews are public (OpenReview, ICLR, NeurIPS, ICML), you can paste yours below so the community can read it here.
Videos
No videos yet. Explain this paper in a talk, walkthrough, or lecture? Add one.
Taxonomy
TopicsPeroxisome Proliferator-Activated Receptors · Cancer, Lipids, and Metabolism · Cancer-related gene regulation
Introduction
1
Digestive system cancers exhibit high incidence and mortality rates worldwide, making them a major global health burden. This category includes malignancies of the esophagus, stomach, liver, bile ducts, gallbladder, pancreas, small intestine, colorectum, and anorectal region [1]. Studies have shown that different types of cancers share many common features in terms of chronic inflammation, genetic mutations, and epigenetic changes, imbalances in cell proliferation and apoptosis, as well as clinical manifestations [2]. For instance, both hepatocellular carcinoma (HCC) and gastric cancer (GC) often exhibit abnormal activation of the Wnt/β‐catenin signaling pathway and mutations in the TP53 gene, which promote tumor progression [3, 4]. Clinically, these cancers typically present with symptoms related to the digestive system. According to the latest data from the Global Cancer Database (Globocan) in 2022, approximately 4 million new cases of digestive system cancers arise annually, accounting for about 20% of global cancer incidence. The annual death toll exceeds 3 million cases, representing more than 30% of global cancer mortality. Colorectal cancer ranks as the third most common cancer worldwide and is the second leading cause of cancer‐related deaths. Liver cancer is the sixth most prevalent cancer globally, with the third highest mortality rate among cancer‐related deaths [5]. Therefore, exploring the pathophysiological mechanisms underlying digestive system cancers and identifying molecular biomarkers for early diagnosis are crucial steps in predicting patient prognosis, guiding personalized treatment, and developing novel therapeutic strategies.
Fatty acid binding protein 5 (FABP5), also known as Epidermal‐type Fatty Acid Binding Protein (E‐FABP), is a member of the fatty acid binding proteins (FABPs) family. FABPs are intracellular lipid‐binding proteins that play a crucial role in binding and transporting long‐chain fatty acids within cells [6]. These proteins serve as key regulatory factors in fatty acid metabolism, inflammation, and energy balance [7]. Research indicates that FABP5 is a target gene involved in the regulation of tumorigenesis and tumor progression in tumor cells influenced by both saturated and unsaturated fatty acids [8]. FABP5 can increase the expression of proteins involved in tumorigenesis by activating transcription factors (TFs), thereby promoting the growth and spread of tumors in various locations, such as lung [9], kidney [10], brain [11], and breast [12], especially closely related to various malignant tumors of the digestive system organs. In esophageal cancer [13, 14], gastric cancer [15, 16], liver cancer [17, 18, 19, 20, 21, 22], and colorectal cancer [23], studies have observed FABP5 overexpression, which correlates with tumor proliferation, invasiveness, and poor patient prognosis. However, some studies report contrasting findings, such as reduced FABP5 expression levels in pancreatic cancer [24], and evidence suggesting that FABP5 overexpression in liver cancer is associated with prolonged OS and disease‐free survival (DFS) [25].
Currently, the pathological mechanisms by which FABP5 contributes to the development of digestive system malignancies remain poorly understood, and existing studies yield inconsistent findings. To address this gap, we conducted a meta‐analysis of available studies to examine the impact of FABP5 expression on the clinicopathological features and prognosis of digestive system tumors.
Methods
2
Search Strategy
2.1
We conducted this study in accordance with the Preferred Reporting Items for Systematic Reviews and Meta‐Analyses (PRISMA) guidelines and registered it with PROSPERO (ID: CRD42024567624). We searched five major electronic databases—PubMed, Embase, Cochrane Library, CNKI, and WanFang—for relevant English‐language studies published up to August 2024. After the electronic search, we performed a manual search by cross‐referencing key papers to identify additional relevant studies. All retrieved materials were managed using EndNote 21. The search terms included “Digestive system malignancies,” “Digestive system cancers,” and “Digestive system neoplasms,” combined with “Fatty acid binding protein 5” and “FABP5.” The detailed search strategy is shown in Appendix 1.
Criteria for Inclusion and Exclusion
2.2
We included studies if they met the following eligibility criteria: [1] The full text of the study was available [2]. Patients were clearly diagnosed with digestive system cancer, and FABP5 expression was directly examined using immunohistochemistry (IHC) or RT‐PCR [3]. The study provided clinicopathological characteristics or survival data [4]. Hazard ratios (HRs) for survival data were reported or could be calculated from the published data.
We excluded studies if they met any of the following criteria: [1] Ineligible study types, including ecological studies, case reports, reviews, editorials, letters, conference abstracts, or animal trials; [2] Repeated studies based on the same database or patient cohort; [3] Studies that lacked sufficient data.
Data Extraction and Quality Assessment
2.3
Two investigators, Miaoqing Li and Xiaoxia Wang, independently screened the studies to determine whether the relevant articles met the inclusion criteria. We resolved any discrepancies through discussion, re‐extraction of data, or third‐party adjudication. The extracted data included the first author's name, publication year, number of patients, region of origin, sample source, assessment method, and clinicopathological features such as gender, age, UICC stage, tumor size, tumor number, tumor differentiation, vascular invasion, nerve invasion, lymph node metastasis, as well as survival data including HRs with 95% confidence intervals (CIs) for OS and DFS. We utilized the Newcastle‐Ottawa Scale (NOS) and Grading of Recommendations Assessment, Development and Evaluation (GRADE) to evaluate the quality of the included studies. Studies scoring NOS ≥ 6 were considered high quality, while those scoring below were regarded as poor quality. We included only high‐quality studies in this meta‐analysis.
Statistical Analysis
2.4
We used STATA 15.0 software to calculate pooled ORs and HRs with 95% CIs. We extracted survival data from Kaplan–Meier curves using Engauge Digitizer 12.1 software. We assessed the association between positive FABP5 expression and clinicopathological features using fixed or random effects models, depending on whether I ^2^ was less than or greater than 50%. An HR or OR greater than 1 indicated a worse prognosis for the group with FABP5 overexpression. We considered the results statistically significant if the 95% CI did not include 1.
Results
3
Eligible Studies
3.1
The retrieval process followed the PRISMA flow chart (Figure 1). Initially, we identified 257 studies based on the selection criteria described in the Methods section, including all digestive system cancers of the esophagus, stomach, colorectal, pancreas, liver, and bile duct. Of these, 65 studies were excluded due to duplication, and 161 were excluded after screening the summaries. Following a full‐text review, 20 additional articles were excluded due to missing data. Ultimately, 11 studies met the inclusion criteria and were selected for analysis, which were related to esophageal cancer, gastric cancer, cholangiocarcinoma, and liver cancer.
PRISMA flow chart of the search and selection procedure.
Main Characteristics and Quality Assessment of the Included Studies
3.2
Eleven studies with 1207 patients were included for meta‐analysis (Table 1). These studies originated from three countries (China, Korea, and Japan) and were published from 2018 to 2023. Sample sizes ranged from 38 to 344, and the NOS scale scores of all the studies were ≥ 6, suggesting high quality; the specific scoring details are presented in Appendix 2. The GRADE system was utilized to assess the credibility of the included studies. Owing to the inherent limitations of the included studies being nonrandomized controlled trials, the results generally demonstrated a low level of credibility. The detailed scoring situation is displayed in Appendix 3.
Association Between FABP5 Expression and all Characteristics in Patients With Digestive System Cancer
3.3
We combined the HRs for survival characteristics (Table 2). Six studies involving 558 patients demonstrated a significant correlation between FABP5 expression and OS (OR = 1.592, 95% CI = 1.349, 1.880, p = 0.000, I ^2^ = 39.9%) (Figure 2A). In contrast, three studies with 284 HCC patients showed no significant correlation between FABP5 expression and DFS (p > 0.05).
Forest plot of survival and clinicopathological characteristics with FABP5 expression, including (A) OS, (B) UICC stage, (C) tumor size, (D) tumor number, (E) vascular invasion, and (F) lymph node metastasis.
We also combined the ORs for clinicopathological characteristics (Table 2). FABP5 expression significantly correlated with UICC stage (OR = 2.331, 95% CI = 1.637, 3.319, p < 0.001, I ^2^ = 14.9%) (Figure 2B), tumor size (OR = 1.515, 95% CI = 1.056, 2.174, p = 0.024, I ^2^ = 36.2%) (Figure 2C), tumor number (OR = 2.114, 95% CI = 1.185, 3.774, p = 0.011, I ^2^ = 0.0%) (Figure 2D), vascular invasion (OR = 2.590, 95% CI = 1.729, 3.881, p < 0.001, I ^2^ = 15.8%) (Figure 2E), and lymph node metastasis (OR = 2.518, 95% CI = 1.626, 3.900, p < 0.001, I ^ 2 ^ = 41.0%) (Figure 2F). However, FABP5 expression was not significantly associated with gender, age, tumor differentiation, or nerve invasion (p > 0.05).
Subgroup Analysis of Heterogeneous Characteristics
3.4
We performed subgroup analyses for variables with heterogeneity greater than 50%, such as disease‐free survival and tumor differentiation. Although heterogeneity in other pathological characteristics was minimal, we conducted further subgroup analyses due to differences in specific tumor names and types and countries of origin across the included studies (Table 3).
Six studies involving 558 patients showed that FABP5 expression was more strongly associated with OS in patients with digestive tract cancers (OR = 1.619, 95% CI = 1.356, 1.933, p < 0.001, I ^2^ = 0.0%) especially in GC (OR = 1.585, 95% CI = 1.323, 1.899, p < 0.001, I ^2^ = 0.0%), compared to patients with HCC (Table 3, Figure 3A). Additionally, given that all digestive tract patients (GC and ESCC) with available OS clinical data were derived from China, the results may hold greater validity within the Chinese patient population. Six studies with 603 patients revealed that FABP5 expression was more strongly associated with UICC in patients with HCC (OR = 2.920, 95% CI = 1.721, 4.953, p < 0.001, I ^2^ = 0.0%) compared to those with digestive tract cancers, including GC, ESCC, and ICC (Table 3, Figure 3B).
Subgroup analysis of forest plots of characteristics with FABP5 expression, including (A) OS of different tumor types, (B) UICC stages of different tumor types, (C) tumor sizes of different countries, and (D) tumor differentiation of different countries.
Furthermore, six studies with 790 patients demonstrated that FABP5 expression was more significantly linked to tumor size in patients from China (OR = 1.870, 95% CI = 1.182, 2.959, p = 0.008, I ^2^ = 0.0%) compared to those from other countries (Table 3, Figure 3C). Although eight studies involving 995 patients indicated that FABP5 expression was significantly associated with tumor differentiation in patients from countries other than China (specifically Korea and Japan) (OR = 0.329, 95% CI = 0.144, 0.750, p = 0.008, I ^2^ = 0.0%), the significance of this finding is limited by the geographic variations (Table 3, Figure 3D).
Publication Biases and Sensitivity Analysis
3.5
We employed Funnel plots, Egger's tests, and Begg's tests to assess potential publication bias in the data for each characteristic in patients with digestive system cancer. For characteristics with significant differences, the Funnel plots showed a largely symmetrical distribution (Figure 4), suggesting minimal bias. Further quantitative analysis using Egger's and Begg's tests revealed no significant publication bias (p > 0.05) for most characteristics (Table 4), with one exception. In the case of vascular invasion, Egger's test suggested possible bias; however, this was not supported by the results of the Begg's test or the Funnel plots.
Funnel plots of survival and clinicopathological characteristics, including (A) OS, (B) UICC stage, (C) tumor size, (D) tumor number, (E) vascular invasion, and (F) lymph node metastasis.
We conducted a sensitivity analysis by excluding each article one by one (Figure 5). The results indicated that the overall findings were not significantly affected by the removal of any individual study, suggesting that our results are reliable.
Sensitivity analysis of survival and clinicopathological characteristics, including (A) OS, (B) UICC stage, (C) Tumor size, (D) Tumor number, (E) Vascular invasion, and (F) lymph node metastasis.
Discussion
4
This systematic review and meta‐analysis was conducted using rigorous inclusion and exclusion criteria, compiled clinical–pathological data and survival information from 1207 patients across 11 retrospective cohort studies. To our knowledge, this is the first systematic review and meta‐analysis to evaluate the impact of FABP5 expression on clinicopathological features and survival outcomes in digestive system malignancies. Regarding the strength of evidence, the NOS assessment of the included studies demonstrated moderate to high quality. However, due to the nature of retrospective evidence, the GRADE system rated the evidence quality as moderate or lower. Therefore, there is a need to incorporate more prospective studies.
Our findings indicate that patients with digestive system tumors who exhibit overexpression of FABP5 have poorer survival outcomes. Specifically, FABP5 overexpression significantly correlates with OS among these patients, and subsequent subgroup analyses reveal a stronger association in patients with digestive tract tumors, especially in GC. We observed substantial heterogeneity in DFS among patients with HCC (I ^2^ = 69.6%), with no significant correlation to FABP5 expression. Further subgroup analyses did not reduce this heterogeneity, which remained high (I ^2^ = 79.4%). This high heterogeneity may stem from the limited number of studies included and the variability in HCC staging and treatment approaches among the patients. For instance, Liu et al. [25] included studies that enrolled patients who had not received radiotherapy or chemotherapy prior to tumor resection but did not restrict those with comorbidities; Ohira et al. [19] excluded patients with preoperative alcoholic hepatitis or autoimmune diseases; and Seo et al. [22] did not limit tumor staging and made no mention of restrictions on treatment or comorbidities. Similar scenarios were observed in the analysis of the correlation between FABP5 expression and all other indicators, where the inclusion and exclusion criteria for patients varied across studies or were not specified. Although the pooled analysis exhibited low heterogeneity and both sensitivity and bias analyses indicated robust results with a certain level of credibility, the potential impact of confounding factors should still be taken into account. Additionally, the patients with available DFS data were exclusively those with HCC, which limits the generalizability of the findings to all patients with digestive system cancers. Similar observations apply to the conclusions regarding OS. Our study demonstrated a stronger correlation between OS and FABP5 expression in patients with digestive tract tumors, particularly in those with GC. However, all patients with digestive tract tumors included in the analysis were sourced from China. These limited factors collectively suggest that future analyses incorporating a larger number of studies are necessary.
Our study reveals that patients with digestive system malignancies and elevated FABP5 expression exhibit more severe clinical–pathological features. These include advanced UICC stage, larger tumor size, greater tumor numbers, and an increased propensity for vascular invasion and lymph node metastasis. Subgroup analyses further indicate that FABP5 expression is particularly associated with tumor size in the Chinese patient subgroup, as well as with UICC stage in the subgroup of patients with HCC. While FABP5 expression demonstrated a stronger correlation with tumor differentiation in two studies conducted outside of China (specifically in Korea and Japan), the significance of this finding is diminished by the differing geographical origins of these studies. This suggests that the correlation between FABP5 expression and tumor differentiation may not be evident in studies conducted in China. Therefore, further research that includes a broader range of studies is warranted to enhance our understanding of this relationship.
Moreover, we conducted relevant cellular experiments to validate our conclusions; the relevant experimental methods are shown in Data S1. In the hepatocellular carcinoma cell line Huh7 and the gastric cancer cell line HGC‐27, overexpression of FABP5 enhanced cancer cell proliferation (Data S2A), migration (Data S2B), and invasion (Data S2C), whereas knockdown of FABP5 attenuated these capabilities (Data S3A–C). Multiple studies have identified various mechanisms through which FABP5 promotes tumor development, supporting our findings. FABP5 facilitates tumor cell proliferation and metastasis by modulating the PPAR β/δ signaling pathway and stabilizing epidermal growth factor [26]. It also promotes epithelial‐mesenchymal transition [27], with the PPAR β/δ signaling pathway serving as a primary mechanism [28, 29, 30]. Furthermore, FABP5 regulates the expression of VEGF through PPARγ [31] and enhances the expression of other angiogenic factors, including EGF [26] and IL‐6 [32], thereby promoting tumor angiogenesis. Additionally, FABP5 modulates the function of vascular endothelial cells; its deficiency impairs cell proliferation and chemotactic migration [33]. However, some studies indicate that the pro‐oncogenic mechanisms of FABP5 may function independently of the PPAR β/δ or PPAR γ signaling pathways, instead relying on the modulation of fatty acid metabolism within cancer cells [34]. FABP5 can activate hypoxia‐inducible factor‐1α (HIF‐1α) and is involved in regulating genes associated with lipid storage, such as acyl‐coenzyme A synthetase long chain family member 1 (ACSL1), glycerol‐3‐phosphate acyltransferase (GPAT), Lipin‐1, and diacylglycerol O‐acyltransferase 2 (DGAT2) [22]. Additionally, FABP5 may regulate genes involved in de novo fatty acid synthesis and fatty acid breakdown, including fatty acid synthase (FASN), stearoyl‐CoA desaturase‐1 (SCD1), and ATP citrate lyase (ACLY) [9].
Furthermore, FABP5 may contribute to inflammatory responses in tumor cells by modulating the expression of interleukin‐1 (IL‐1), IL‐6, and IL‐8, as well as parathyroid hormone‐related protein. This modulation leads to the production of reactive oxygen species (ROS) and the activation of protein kinase C [35]. FABP5 may also promote tumor cell energy production by regulating the AMP to ADP/ATP ratio, protein kinases, and the number of autophagosomes [36].
Conclusion
5
Our study confirms that the overexpression of FABP5 is associated with poorer clinical–pathological features and reduced overall survival in patients with digestive system tumors, as demonstrated through meta‐analysis. This finding highlights the significant role of FABP5 in exploring the pathophysiological mechanisms of digestive system malignancies. However, due to the limited number of current studies and small sample sizes, further research with larger cohorts is necessary to provide additional support. FABP5 represents a valuable molecular biomarker for the treatment of digestive system cancers and requires further investigation in the future.
Author Contributions
Miaoqing Li: conceptualization, methodology, software, data curation, formal analysis, writing – original draft, writing – review and editing, validation, investigation, visualization, supervision, resources, project administration. Xiaoxia Wang: methodology, software, validation, investigation. Jia Guo: validation, resources. Junchen Qu: data curation. Yu Cao: writing – review and editing, validation. Qingkun Song: validation. Jun Lu: funding acquisition, writing – review and editing, resources.
Ethics Statement
The authors have nothing to report.
Consent
The authors have nothing to report.
Conflicts of Interest
The authors declare no conflicts of interest.
Supporting information
Data S1.
Data S2.
Data S3.
The reference list from the paper itself. Each links out to its DOI / PubMed record.
- 1I. D. Nagtegaal , R. D. Odze , D. Klimstra , et al., “The 2019 WHO Classification of Tumours of the Digestive System,” Histopathology 76, no. 2 (2020): 182–188, 10.1111/his.13975.31433515 PMC 7003895 · doi ↗ · pubmed ↗
- 2A. Stenzinger and W. Weichert , “Genetic Profiling of Cancers of the Digestive System: Biological Insights and Clinical Implications,” Pathobiology 84, no. 6 (2017): 306–322.28178700 10.1159/000446545 · doi ↗ · pubmed ↗
- 3F. Molaei , M. M. Forghanifard , Y. Fahim , and M. R. Abbaszadegan , “Molecular Signaling in Tumorigenesis of Gastric Cancer,” Iranian Biomedical Journal 22, no. 4 (2018): 217–230.29706061 10.22034/ibj.22.4.217PMC 5949124 · doi ↗ · pubmed ↗
- 4M. J. Perugorria , P. Olaizola , I. Labiano , et al., “Wnt‐β‐Catenin Signalling in Liver Development, Health and Disease,” Nature Reviews. Gastroenterology & Hepatology 16, no. 2 (2019): 121–136.30451972 10.1038/s 41575-018-0075-9 · doi ↗ · pubmed ↗
- 5F. Bray , M. Laversanne , H. Sung , et al., “Global Cancer Statistics 2022: GLOBOCAN Estimates of Incidence and Mortality Worldwide for 36 Cancers in 185 Countries,” CA: A Cancer Journal for Clinicians 74, no. 3 (2024): 229–263.38572751 10.3322/caac.21834 · doi ↗ · pubmed ↗
- 6A. W. Zimmerman and J. H. Veerkamp , “New Insights Into the Structure and Function of Fatty Acid‐Binding Proteins,” Cellular and Molecular Life Sciences 59, no. 7 (2002): 1096–1116.12222958 10.1007/s 00018-002-8490-y PMC 11337517 · doi ↗ · pubmed ↗
- 7J. Storch and A. E. Thumser , “Tissue‐Specific Functions in the Fatty Acid‐Binding Protein Family,” Journal of Biological Chemistry 285, no. 43 (2010): 32679–32683.20716527 10.1074/jbc.R 110.135210 PMC 2963392 · doi ↗ · pubmed ↗
- 8L. Levi , Z. Wang , M. K. Doud , S. L. Hazen , and N. Noy , “Saturated Fatty Acids Regulate Retinoic Acid Signalling and Suppress Tumorigenesis by Targeting Fatty Acid‐Binding Protein 5,” Nature Communications 6 (2015): 8794.10.1038/ncomms 9794 PMC 466207026592976 · doi ↗ · pubmed ↗