Feasibility and Effectiveness of Using Community Testing Centers to Increase Access to COVID-19 Testing Services in Urban Mozambique
Júlia Sambo, Nádia Sitoe, Neuza Nguenha, Jorfélia Chilaúle, Phath Guambe, Denise Langa, Júlio Rafael, Chishamiso Mudenyanga, Nédio Mabunda, Osvaldo Loquiha, Ilesh Jani

TL;DR
This study evaluated how community testing centers in Mozambique improved access to COVID-19 testing for underrepresented groups and found they increased testing rates compared to traditional health facilities.
Contribution
The study introduces a community-based testing approach to address gaps in traditional health facility access for infectious disease screening in urban settings.
Findings
Testing rates at community centers were significantly higher than at traditional health facilities.
Community testing centers were effective in reaching vaccinated individuals without symptoms or comorbidities.
Intervention health facilities near testing centers saw a fourfold increase in testing rates during the intervention period.
Abstract
Conventional diagnostic systems struggled to meet the fluctuating demand for testing across the different waves of the coronavirus disease 2019 (COVID-19) pandemic. This study aimed to assess the feasibility and effectiveness of the walkthrough (WT) approach in extending access to COVID-19 testing to high-risk populations traditionally underrepresented at health facilities (HFs) and to observe its impact on testing demand. An interventional study was implemented in markets (WT markets) and ports (WT ports) in Maputo City and Province, Mozambique. Demographic, epidemiological, and clinical data were collected for patients testing for COVID-19 in HFs and at WTs, and a nasal swab COVID-19 antigen rapid diagnostic test (Ag-RDT) was administered. Overall, testing rates at WTs were higher than those at HFs. At WTs, 4,452 of 4,457 participants were eligible and screened for COVID-19. Most…
Genes, proteins, chemicals, diseases, species, mutations and cell lines named across the full text — each resolved to its canonical identifier and authoritative record.
Click any figure to enlarge with its caption.
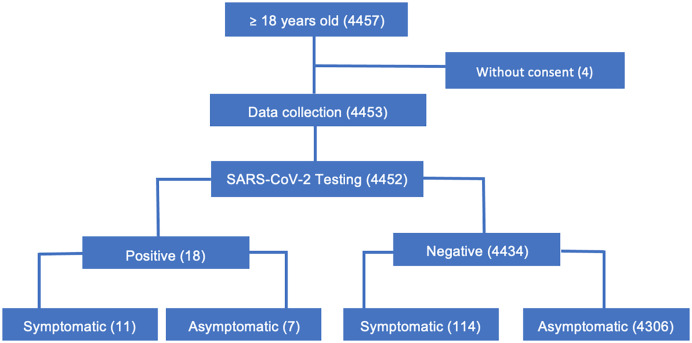 Figure 1
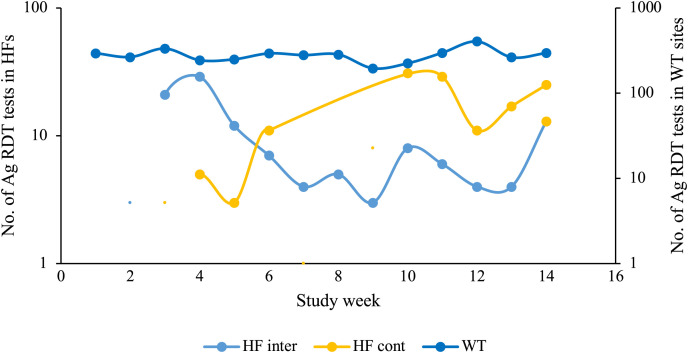 Figure 2
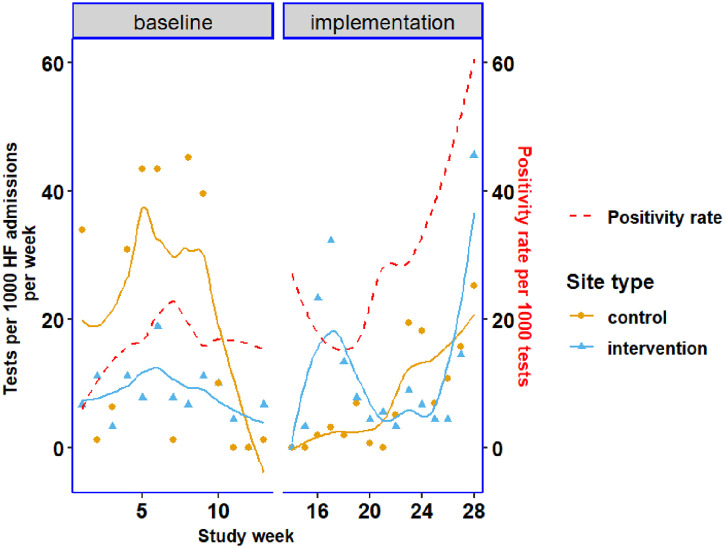 Figure 3
| Facility Type | Type of Site | Site Names |
|---|---|---|
| Walkthrough sites | Markets | Xipamanine |
| Santos | ||
| Truck driver stopping points | Maputo Port | |
| Matola Port | ||
| Health facilities | Intervention | Centro de Saúde de Xipamanine |
| Centro de Saúde de Matola Santos | ||
| Control | Centro de Saúde de Hulene | |
| Centro de Saúde de Matola 2 |
| Characteristic | Markets, | Ports, | HF, | |||
|---|---|---|---|---|---|---|
|
| % |
| % |
| % | |
| Age groups | ||||||
| 18–29 years | 1,202 | 45.0% | 167 | 9.4% | 144 | 39.9% |
| 30–39 years | 514 | 19.3% | 764 | 42.8% | 95 | 26.3% |
| 40–49 years | 368 | 13.8% | 605 | 33.9% | 46 | 12.7% |
| 50–59 years | 274 | 10.3% | 188 | 10.5% | 40 | 11.1% |
| 60+ years | 312 | 11.7% | 59 | 3.3% | 36 | 10.0% |
| Median age (IQR) | 32 (23–47) | 39 (34–45) | 33 (24–46) | |||
| Sex | ||||||
| Female | 1,502 | 56.3% | 16 | 0.9% | 207 | 57.3% |
| Male | 1,168 | 43.7% | 1,767 | 99.1% | 154 | 42.7% |
| Nationality | ||||||
| Mozambican | 2,657 | 99.5% | 960 | 53.8% | 343 | 95.0% |
| Other | 13 | 0.5% | 822 | 46.1% | 0 | 0.0% |
| Missing | 0 | 0.0% | 1 | 0.1% | 18 | 5.0% |
| Residence | ||||||
| Maputo City | 725 | 27.2% | 160 | 9.0% | 72 | 19.9% |
| Maputo Province | 1,933 | 72.4% | 730 | 40.9% | 252 | 69.8% |
| Other province | 5 | 0.2% | 40 | 2.2% | 0 | 0.0% |
| Missing | 7 | 0.3% | 853 | 47.8% | 37 | 10.2% |
| Characteristic | Markets, n = 2,670 | Ports, n = 1,783 | ||
|---|---|---|---|---|
|
| % |
| % | |
| Occupation | ||||
| Driver/truck driver | 61 | 2.3% | 1,691 | 94.8% |
| Merchant | 885 | 33.1% | 3 | 0.2% |
| Unemployed | 542 | 20.3% | 3 | 0.2% |
| Student | 389 | 14.6% | 1 | 0.1% |
| Security/army | 126 | 4.7% | 40 | 2.2% |
| Other | 561 | 21.0% | 45 | 2.5% |
| Missing | 106 | 4.0% | 0 | 0.0% |
| COVID-19 vaccination status | ||||
| No vaccine | 696 | 26.1% | 425 | 23.8% |
| Complete vaccination | 1,787 | 66.9% | 1,318 | 73.9% |
| Incomplete vaccination | 161 | 6.0% | 31 | 1.7% |
| COVID-19 symptoms | ||||
| No | 2,557 | 95.8% | 1,758 | 98.6% |
| Yes | 111 | 4.2% | 13 | 0.7% |
| Missing | 2 | 0.1% | 12 | 0.7% |
| Comorbidities | ||||
| Hypertension | 296 | 11.1% | 56 | 3.1% |
| Gastritis | 125 | 4.7% | 24 | 1.3% |
| HIV | 114 | 4.3% | 21 | 1.2% |
| Asthma | 79 | 3.0% | 10 | 0.6% |
| Rhinitis | 51 | 1.9% | 3 | 0.2% |
| Other | 232 | 8.7% | 32 | 1.8% |
| None | 1,657 | 62.1% | 1,568 | 87.9% |
| Missing | 116 | 4.3% | 69 | 3.9% |
| Ag-RDT result | ||||
| Negative | 2,661 | 99.7% | 1,774 | 99.5% |
| Positive | 9 | 0.3% | 9 | 0.5% |
| Missing | 0 | 0.0% | 0 | 0.0% |
| Effects | IRR | Robust Std. Err. | 95% CI | |
|---|---|---|---|---|
| Site type | ||||
| Baseline period | ||||
| Control | ref. | |||
| Intervention | 0.194 | 0.061 | 0.104–0.361 | 0.000 |
| Phases | ||||
| Control sites | ||||
| Baseline | ref. | |||
| Implementation | 0.257 | 0.149 | 0.082–0.801 | 0.019 |
| Log time (weeks) | 0.857 | 0.229 | 0.508–1.445 | 0.563 |
| Phases, site type | ||||
| Implementation, intervention | 3.804 | 1.825 | 1.486–9.739 | 0.005 |
| Controlling indicators | ||||
| Ag-RDT positivity | 1.023 | 0.009 | 1.005–1.041 | 0.014 |
| Constant | 0.025 | 0.011 | 0.010–0.058 | 0.000 |
| Alpha | 1.099 | 0.264 | 0.686–1.758 | – |
| ln (admissions) | 1 | (exposure) | – | – |
- —German Federal Ministry for Economic Cooperation and Development (BMZ)
Peer Reviews
No public reviews on file for this paper yet. If you reviewed it on a platform where reviews are public (OpenReview, ICLR, NeurIPS, ICML), you can paste yours below so the community can read it here.
Videos
No videos yet. Explain this paper in a talk, walkthrough, or lecture? Add one.
Taxonomy
TopicsSARS-CoV-2 detection and testing · COVID-19 epidemiological studies · Vaccine Coverage and Hesitancy
INTRODUCTION
Access to timely severe acute respiratory syndrome coronavirus 2 (SARS-CoV-2) testing is crucial to reduce the spread of the virus and the associated morbidity and mortality.1^,^2 However, in low-income settings, the coverage of laboratory-based diagnostic testing is often limited because of inadequate infrastructure, a lack of equipment, deficient sample referral systems, a shortage of reagents, and a scarcity of trained personnel.3?^–^5 These challenges are further exacerbated during periods of high demand for testing, particularly during epidemics.
During pandemic waves, a long turnaround time (TAT) for results negatively impacts infection control efficiency, especially during periods of high community transmission.3^,^6 High TATs deter people from seeking diagnostic services and might lead to the continuous transmission of infectious agents in the community. During the coronavirus disease 2019 (COVID-19) pandemic, the utilization of community-based screening points, particularly through the walkthrough (WT) approach, was associated with increased access to testing.2^,^7^,^8
In Mozambique, by the end of 2020, the first year of the response to the COVID-19 pandemic, 68.9% (970,426) of tests were conducted at conventional laboratories using reverse transcriptase polymerase chain reaction (RT-PCR). The use of antigen rapid diagnostic tests (Ag-RDT) was implemented and scaled up to district hospitals to improve testing coverage at high-volume health facilities (HFs) starting in September 2021, during the third COVID-19 wave. In the capital city, Maputo, the WT center approach was implemented at two markets and one bus terminal to reach the population that was unable or unwilling to visit HFs.2
We aimed to describe the impact of WT testing centers on the access to diagnosis of high-risk populations in markets and at long-distance truck drivers’ stopping points. We also assessed whether the WT approach had an effect on the number of COVID-19 tests performed in nearby HFs.
MATERIALS AND METHODS
Study area and study population.
This study was implemented in high-traffic areas of commuters in Maputo City and Maputo Province, namely, two markets with taxi terminals (Xipamanine and Santos) and two long-distance truck driver stopping points (Maputo Port and Matola Port). The Xipamanine and Matola Santos markets are among the most crowded markets in Maputo City and Maputo Province, respectively. Centro de Saúde de Xipamanine and Centro de Saúde da Matola Santos were the health centers nearest to the selected WT locations. These served as intervention HFs. In selecting control sites, we rigorously evaluated potential HFs based on a set of criteria designed to ensure comparability with intervention sites. These included geographic proximity to high-traffic areas, similar service levels, historical testing volumes, and the socioeconomic and demographic profiles of their respective catchment areas (data not shown). Centro de Saúde de Hulene and Centro de Saúde de Matola 2 were ultimately chosen as control sites because these closely matched the intervention sites across all dimensions, with no WTs nearby (Table 1). The distance from the WT to the control sites was 8.1 km and 5.2 km for the Maputo City and Maputo Province sites, respectively. The distance between the WT and the intervention sites was less than 1 km.
Maputo City and Maputo Province are in South Mozambique. In 2022, the estimated populations of Maputo City and Maputo Province were 1,130,319 and 2,390,673, respectively. These two provinces were selected because they reported the highest number of COVID-19-positive cases. The southern area of the country is one of the main corridors for truck drivers because of the Maputo Port and the proximity to South Africa and Eswatini.
COVID-19 testing was made available to all individuals over the age of 18 years who wished to be tested, encompassing both those who met the WHO criteria for COVID-19 testing, including close contacts of confirmed cases, and those without symptoms.9 Individuals who had a positive test result for COVID-19 within the previous 7 days were excluded from this study. Testing at WTs was performed between 7:30 am and 3:30 pm from Monday to Friday, excluding public holidays.
This study was implemented from August to November 2022. During this exact period in Mozambique, Vero cell, Pfizer-BioNTech, AstraZeneca, and Janssen from Johnson & Johnson COVID-19 vaccines were authorized and in circulation. The local vaccination guidelines stipulated two doses spaced 4 weeks and 8 weeks apart for the Sinovac and AstraZeneca vaccines, respectively, and a single dose for the Johnson & Johnson vaccine for adults >18 years old.
Intervention and control HFs.
A primary healthcare facility nearest to the WT testing center was selected as the intervention HF. The control HF was a primary healthcare facility that was similar in terms of the service level. These HFs followed the same routine workflow that was implemented at all HFs offering COVID-19 screening and testing. The HFs tested symptomatic patients and contacts of confirmed cases using rapid diagnostic tests (RDTs).
Implementation of WT testing centers.
Each WT center had two community mobilizers who raised awareness of the services provided by WTs within the catchment area. People volunteering and consenting to be tested at the WTs had their blood pressure checked, were questioned about any existing chronic conditions, and then offered SARS-CoV-2 Ag-RDT testing using the PanbioTM COVID-19 Ag nasal rapid diagnostic test (Abbott, Jena, Germany, Ref: 41FK11). Each test was preceded by a detailed explanation of the procedure. After receiving their results, individuals were given a comprehensive explanation of what their results meant. Those with positive results had their oxygen saturation checked using handheld pulse oximeters. All patients with positive results were advised to self-isolate for a period of 7 days and encouraged to refer their known close contacts (per the WHO’s definitions) for testing, irrespective of symptoms.9 All asymptomatic individuals with negative results were considered negative, whereas all symptomatic individuals with negative results were referred for RT-PCR testing using Abbott m2000 sp/rt platforms (Abbott Molecular Inc., Taipei City, Taiwan), Cobas 6,800 instrument (Roche, Amadora, Portugal), or Applied Biosystem QuantStudio^TM^ 5 Real-Time PCR system (Thermo Fisher Scientific, Waltham, MA) for negativity confirmation (per national guidelines).10
Individuals identified as having high blood pressure during the testing process were referred to the nearest HF for a clinical follow-up, regardless of their Ag-RDT results. Those who tested positive for COVID-19 and experienced moderate or severe symptoms, as well as those with low oxygen saturation levels (<95%) and those who reported suffering from hypertension, were referred to COVID-19 treatment centers. Data were collected from the HF near the WT, which served as the intervention arm, and compared with data obtained from the HF in the control arm.
Data collection, storage, and analysis.
At the WT centers, sociodemographic, clinical, and epidemiological data were collected electronically by using tablets (Samsung, Suwon-si, South Korea, model: TAB A 8”) with Open Data Kit software (v2022.2.1; Seattle, Washington) and stored in a secure database hosted at the Instituto Nacional de Saúde servers. Data were synchronized daily for monitoring by using a dashboard for integrity checking and the resolution of inconsistencies. In the HFs, data were retrospectively collected by using the same instrument as the COVID-19 notification form and patient logbooks.
STATISTICAL ANALYSES
Descriptive statistics were calculated for the main indicators and summarized in tables and graphs. These indicators included COVID-19 vaccination coverage, which was defined as “fully vaccinated” for the participants who received all the required doses and “incompletely vaccinated” for those who received at least one but not all doses, according to the guidelines. Other indicators were the proportion tested with symptoms, the proportion tested with comorbidities, and Ag-RDT positivity rates. These statistics were displayed for markets, ports, and HFs. Statistical comparisons were made for these indicators between control and intervention HFs to assess WT impact by using a Wald χ^2^ test with robust standard errors.
For the impact of WTs in reducing the testing load in intervention HFs, we compared the Ag-RDT testing rate between control and intervention HFs while controlling for the effects of time (transformed for linearity using a logarithm function), an indicator for baseline data, and a 1-week lagged Ag-RDT positivity rate (i.e., positivity rate from previous week). The Ag-RDT testing rate was defined as the number of COVID-19 tests conducted per 1,000 health facility admissions (any entries at the HFs of the study) per study week, starting from week 1 of August 2022 and continuing until November 2022 (a total of 16 weeks). Using the number of COVID-19 tests per 1,000 HF admissions per week provides a relative measure of testing intensity and the effectiveness of public health interventions. Changes in this rate may signal shifts in testing strategies, changes in the outbreak severity, or changes in the impact of control measures.
As a proxy for the at-risk or exposed population, data from all available admission points at each health facility were used, including emergencies, ambulatory services, and wards. This included all admissions, whether or not they were related to COVID-19, per week, and information was gathered from each service’s logbook. Overall, data were collected from ∼20 admission sites or points in each health facility, with an average of 95 admissions per week. Although HF admission data were used as a proxy for the population at risk, it may not fully capture the entire population at risk of needing COVID-19 testing for various reasons, such as reduced positivity rates leading to negligence about testing, even among those exhibiting symptoms. Thus, this approach likely underestimates the true number of individuals at risk.
We assumed that the number of Ag-RDTs follows from a negative binomial distribution and that the expected counts can be modeled as , where is the extra Poisson variability, and . The are regression coefficients for the controlling effects of , and we used them as the offset or exposure for the total number of patients admitted for any consultation. Baseline data included testing volume records from 3 months before the implementation of the WTs (May to July) obtained from the control and intervention sites. Robust standard errors were used because of the clustering nature of the counts, and data analysis was performed by using STATA/IC 12.1 (StataCorp LLC, College Station, TX) and R (R Foundation for Statistical Computing, Vienna, Austria). The alpha (α) value considered was 0.05, corresponding to a 95% confidence level.
RESULTS
Characteristics of the study participants.
The four WT enrolled 4,457 participants, of whom 4,452 were eligible and screened for COVID-19 (Figure 1). The median age was 32 years (interquartile range [IQR]: 23–42 years) for participants in WT markets, 39 years (IQR: 34–45 years) for participants in WT ports, 33 years (IQR: 24–46 years) for participants in all HF, 33 years (IQR: 26–46) for participants in intervention HF, and 32 years (IQR: 23–45 years) for participants in control HF. The WT markets and all HFs had more female participants (56.3% and 57.3%, respectively), whereas the WT ports had more male participants (99.1%; Table 2).
Diagram of participants who attended the walkthrough for coronavirus disease 2019 screening using antigen rapid diagnostic tests.
Participants who attended WT markets (Table 3) were merchants (33.1%), unemployed citizens who lived close to the WT (20.3%), and students (14.6%). Although the participants were mostly vaccinated for COVID-19 (66.9%), a lower proportion (6%) did not complete the vaccination schedule. Most of the tested participants had no symptoms (95.8%), and the overall positivity rate was 0.3% (9/2670; Table 3).
In WT ports, participants were mostly truck drivers (94.8%), with security personnel (2.2%) and people with other occupations constituting minor proportions. As observed in the other WT type, the majority of participants (73.9%) were fully vaccinated, and 1.7% did not complete the vaccination schedule for COVID-19. In addition, most of the participants (98.6%) reported no symptoms, and the overall positivity rate was 0.5% (9/1783), which is lower when compared with the positivity rate observed in HFs (Table 3).
The main comorbidities reported by participants in both WT markets and WT ports were hypertension, gastritis, HIV, asthma, and rhinitis (Table 3).
Impact of WTs on volume and testing rate in intervention HFs.
We conducted our study during a low-transmission period of COVID-19, and in the first week of data collection, a stockout of COVID-19 RDTs was observed in the HF. The overall COVID-19 Ag-RDT positivity rate at HFs was 9.2 (31/337). Higher positivity rates were observed in both control (9.2%, 17/184) and intervention (9.2%, 14/153) HFs, compared with the overall positivity rate at the WTs (0.4%; 18/4453). At WTs, seven out of 18 participants with positive results were asymptomatic (Figure 1).
Next, we hypothesized that WTs reduced the volume and testing rate of the nearest HFs and measured the testing volumes for COVID-19 in intervention and control HFs. The proportion of participants with symptoms tested in the control HFs (99%; 180/182) was markedly higher than that of intervention HFs (88%; 154/176), and the observed difference was statistically significant (P <0.001; Supplementary Table 1). Although testing volumes were constant in the WTs, with a rate of 260 tests per week, we observed different trends in the intervention and control HFs (Figure 2). Starting at week 5, there was an increasing trend of tested individuals in control HFs, with a rate of ∼14 tests per week and a decreasing trend in intervention HFs (rate of 13 tests per week; Figure 2).
Testing volume measured using the number of antigen rapid diagnostic tests (Ag-RDTs) per study week in control and intervention health facilities (HFs) and walkthroughs (WTs) during the study implementation period. The yellow line represents the HF control, the light blue line represents the HF intervention, and the dark blue line represents the WT sites. The y-axis on the left represents the number of Ag-RDTs in HFs, and the y-axis on the right represents the number of antigen tests performed in WT sites; both axes are in the logarithm scale (log10). The x-axis represents the number of weeks of WT implementation. These are smoothed lines showing the overall tendency of Ag-RDT testing volumes during the study period. cont = control; int = intervention.
We plotted the testing rate, defined as the number of Ag-RDTs per 1,000 HF admissions, by time in weeks (Figure 3). The overall trend during the implementation phase featured an increasing testing rate, showing that in general, the testing rate was relatively similar between the control and intervention sites during this phase (Figure 3), with a higher rate in the intervention sites during the initial weeks of the implementation and a relatively lower rate in the latter weeks. The average testing rate was 8.7 (per 1,000 HF admissions) at control sites and 5.9 (per 1,000 HF admissions) at intervention sites during the implementation period. The positivity rate was relatively lower in the baseline period but increased slightly during the implementation period, with a sharp increase in the latter weeks of the study period, although the positivity rates between the baseline and implementation phases did not differ significantly (Supplemental Table 1 and Figure 3).
Testing rate by study week for control and intervention sites and by phase (baseline and implementation phase).
The results of the regression model are displayed in Table 4. During the baseline phase, controlling for other factors, such as positivity rate, the incidence rate of Ag-RDTs at intervention sites was roughly 0.2 (95% CI: 0.104–0.361; P <0.001) of the incidence rate in the control sites. When comparing the incidence rate of Ag-RDT between the baseline and implementation period at the control sites, the incidence rate during the intervention period was significantly (P = 0.019) reduced compared with the baseline period (0.25; 95% CI: 0.082–0.801). Moreover, the incidence rate of Ag-RDT increased by a factor of 3.804 (95% CI: 1.486–9.739) in the intervention HF during the implementation period. The percent change in the incidence rate of Ag-RDTs was a 2.3% increase for every percentage point increase in the Ag-RDT positivity rate (P = 0.014). Supplemental Table 2 shows the expected testing rate by site type and phase while keeping the rest of the covariates constant at their mean values.
DISCUSSION
The present study was implemented in the third year of the COVID-19 pandemic and a year and a half after the initiation of the vaccination process in Mozambique. We hypothesized that community testing centers, named WTs, impact the number of COVID-19 tests performed at the intervention sites compared with the control sites. At the time of the study, numerous preventive and containment measures had already been lifted in the country. Our results show that most of the study population was vaccinated, with a higher percentage observed at WT ports when compared with WT markets. Truck drivers were identified as a high-risk group and potential spreaders of the infection earlier during the pandemic, and special efforts were made to vaccinate them in Mozambique and other African countries.11 Furthermore, an important contextual factor for our study was the policy shift in Mozambique in terms of requirements for travelers. Starting in April 2022, before the study period, travelers were no longer required to present a COVID-19 testing certificate but instead had to present a COVID-19 vaccination certificate. Therefore, our study, which was conducted from August to November 2022, provides insights into the impact of point-of-care COVID-19 testing in a period marked by significant policy and behavioral changes related to COVID-19 prevention and control measures. The introduction of vaccination certificates as a requirement for travelers likely influenced public attitudes toward testing and vaccination, potentially affecting the demand for WT testing services. Understanding the timing and implication of this policy change is crucial for interpreting our findings, particularly regarding the observed testing volumes and positivity rates.
The percentage of symptomatic participants and those with positive COVID-19 results was higher in HFs. This can be attributed to the testing algorithm implemented in the country, which stipulated that only patients with symptoms suggestive of SARS-CoV-2 infection or direct contacts of confirmed cases were tested in HFs using Ag-RDTs.10 Moreover, a previous evaluation of COVID-19 Ag-RDTs conducted in Mozambique showed that the sensitivity and specificity of these RDTs were higher in symptomatic patients.11
Although the WT centers detected 18 cases of COVID-19 out of 4,435 tests, the significance of this intervention extends beyond the detection rate alone. This approach can lead to increased access to testing, the early detection and isolation of positive cases, and increased public health awareness about testing and preventive measures. The WT approach can also contribute to a broader epidemiological understanding of COVID-19’s spread within the community and serve as the cornerstone for community-based public health interventions.
During the implementation of the study, we observed a variation in the COVID-19 positivity rate nationally. The initial weeks of data collection were characterized by a low positivity rate, which gradually increased from midway through the study period. This fluctuation in the positivity rate influenced the testing volume at control HFs, showing an increase that mirrored the country’s positivity rate trend. This national epidemiological context may have influenced the overall incidence rate observed in control HFs during the baseline and implementation periods.
This analysis has shown that during the baseline period, control HFs exhibited a higher incidence rate of COVID-19 testing than implementation HFs. This highlights that although our control and intervention HFs were similar in terms of services delivered, they differed in terms of SARS-CoV-2 diagnosis. This disparity could have been influenced by reported testing disruption due to the stockout of COVID-19 tests observed at both control and implementation HFs, with a more significant impact on the implementation sites. To minimize the impact of the availability of tests, we ensured that all HFs in the study had access to Ag-RDTs for routine testing before the implementation period.
After adjusting the models, we observed an increase in the incidence rate during the implementation period in intervention HFs. These results do not corroborate the positive impact described by other authors in reducing the testing burden on HFs. Our findings indicate that the WT did not reduce the incidence rate in HFs, at least not in the context of low a positivity rate.2^,^8^,^12 Although we initially hypothesized that the WT testing approach could play a significant role in the early detection of COVID-19 cases and potentially reduce community transmission, our findings indicate that the effectiveness of such interventions may be contingent on the prevailing positivity rates within the community. During the study period, observed positivity rates were relatively low, which limited our ability to conclusively demonstrate the anticipated impact of WT testing centers on early case detection and transmission prevention. Therefore, although our results suggest that WT testing centers have the potential to contribute to public health efforts, especially in scenarios of higher transmission, the low positivity rates encountered during the study period offer a cautionary note regarding the conditions under which such interventions are most likely to be effective. It is possible that the true value of WT testing centers in early case detection and the prevention of disease transmission could be more pronounced in contexts with higher baseline levels of COVID-19 or during peaks of transmission, rather than during periods of low positivity, as experienced in our study.12^,^13 Still, in our study, WTs performed a higher number of tests than HFs, demonstrating not only their feasibility but also increased reach to urban communities. In resource-limited countries, this approach may provide an alternative way to offer healthcare services to communities, such as family planning and screening for noncommunicable diseases.
In comparing ports and markets, a higher number of symptomatic cases was observed in markets. This disparity can be primarily attributed to the differing employment conditions between the two groups commonly frequenting these locations. Specifically, truck drivers who predominantly use ports are often employed by large corporations that offer secure contracts, including benefits such as paid sick leave. This employment stability likely enables truck drivers to adhere more strictly to health guidelines by staying home when symptomatic. Conversely, market sellers and their customers largely consist of self-employed individuals who rely on daily earnings for their livelihood. The absence of a financial safety net compels these informal workers from the markets to continue working, even when they are experiencing symptoms of illness, thereby potentially contributing to the higher observed rate of symptomatic cases in markets. Additionally, individuals exhibiting mild symptoms, or only one symptom, are less likely to seek testing at HFs. However, they still represent a significant group for potential disease transmission.14
Although our analysis revealed a 2.3% increase in the incidence testing rate of Ag-RDTs for every percentage point increase in positivity rate, we acknowledge that the overall impact of this finding may be limited given the generally low positivity rate throughout the study period. This incremental change, although statistically significant, should be interpreted within the broader context of testing strategy effectiveness and public health implications.
This study was implemented during a period of decreased positivity rates in the country, immediately following a wave of COVID-19. This fact influenced the number of patients visiting HFs for COVID-19 testing. The testing points (WTs), offering other services, such as blood pressure measurements, may have attracted a larger number of participants. Integrating infectious disease testing with screenings for noncommunicable diseases like hypertension optimizes existing health infrastructure. This dual approach addresses various public health needs simultaneously, enhancing service delivery comprehensively. Such integration broadens the impact of health interventions, meeting a wider range of community health requirements efficiently.
Future studies focusing on the knowledge, attitudes, and practices among the study population, would provide deeper insights into the behavioral factors driving individuals to use these testing facilities, particularly those who are unable or unwilling to visit traditional HFs. Studying these aspects could offer valuable information to refine and enhance public health strategies and interventions, ensuring they are more aligned with the community’s needs and expectations.
CONCLUSION
During periods of low positivity rates and weak influx, the WT testing points do not have the anticipated effect on reducing the incidence testing rate within HFs. Nevertheless, they might be valuable for pinpointing cases and comorbidity screening in communities. This study demonstrates that public health resources may be better used elsewhere during periods of low COVID-19 transmission in the community.
An appropriate study should be implemented to assess if the WTs can be more effective in situations of high positivity rates, as well as if they can be used to validate vaccination coverage in the general population.
Supplemental Materials
10.4269/ajtmh.23-0805Supplemental Materials
The reference list from the paper itself. Each links out to its DOI / PubMed record.
- 1Abdullahi IN Emeribe AU Akande AO Ghamba PE Adekola HA Ibrahim Y Dangana A, 2020. Roles and challenges of coordinated public health laboratory response against COVID-19 pandemic in Africa. J Infect Dev Ctries 14: 691–695.32794455 10.3855/jidc.12813 · doi ↗ · pubmed ↗
- 2Kim SI Lee JY, 2020. Walk-through screening center for COVID-19: An accessible and efficient screening system in a pandemic situation. J Korean Med Sci 35: e 154.32301300 10.3346/jkms.2020.35.e 154PMC 7167399 · doi ↗ · pubmed ↗
- 3Favresse J , 2021. Head-to-head comparison of rapid and automated antigen detection tests for the diagnosis of SARS-Co V-2 infection. J Clin Med 10: 265.33450853 10.3390/jcm 10020265 PMC 7828347 · doi ↗ · pubmed ↗
- 4Kiyaga C , 2013. Uganda’s new national laboratory sample transport system: A successful model for improving access to diagnostic services for early infant HIV diagnosis and other programs. P Lo S ONE 8: e 78609.24236026 10.1371/journal.pone.0078609 PMC 3827263 · doi ↗ · pubmed ↗
- 5Zhu N , 2020. A novel coronavirus from patients with pneumonia in China, 2019. N Engl J Med 382: 727–733.31978945 10.1056/NEJ Moa 2001017 PMC 7092803 · doi ↗ · pubmed ↗
- 6Igl▪i Z , 2020. Clinical evaluation of the Roche/SD Biosensor rapid antigen test with symptomatic, non-hospitalized patients in a municipal health service drive-through testing site. Available at: https://www.medrxiv.org/content/10.1101/2020.11.18.20234104 v 1. Accessed September 16, 2021.
- 7Shah A Challener D Tande AJ Mahmood MO’Horo JC Berbari E Crane SJ, 2020. Drive-through testing: A unique, efficient method of collecting large volume of specimens during the SARS-Co V-2 (COVID-19) pandemic. Mayo Clin Proc 95: 1420–1425.32448589 10.1016/j.mayocp.2020.04.030PMC 7252102 · doi ↗ · pubmed ↗
- 8Kwon KT Ko J Shin H Sung M Kim JY, 2020. Drive-through screening center for COVID-19: A safe and efficient screening system against massive community outbreak. J Korean Med Sci 35: e 123.32193904 10.3346/jkms.2020.35.e 123PMC 7086085 · doi ↗ · pubmed ↗