Food and Water Safety Risks From Salmonella enterica and Escherichia coli Contamination in Bukavu City, Democratic Republic of the Congo
Alain M Okito, John M Wagacha, Catherine W Lukhoba, Alex A Lina, Wolfgang R Mukabana

TL;DR
This study found high contamination of food and water with harmful bacteria in Bukavu, DR Congo, due to poor sanitation and hygiene practices.
Contribution
The study provides new empirical data on the prevalence of Salmonella and E. coli in food and water in Bukavu, linking contamination to environmental and handling factors.
Findings
Salmonella enterica was found in over 24% of food and water samples, with the highest rates in pork, sausage, and well water.
E. coli was most prevalent in fish and well water, with 57.1% of well water samples contaminated by Salmonella.
Food contamination was significantly influenced by cooking and heating practices in restaurants.
Abstract
Introduction Bukavu city is facing sanitation challenges, with many reported cases of epidemics such as cholera, salmonellosis, and other infectious diseases. Food and water sold under poor sanitation conditions are exposed to potential contamination by pathogenic bacteria. Consumers are therefore at risk of contracting bacterial infections, which could increase the burden of infectious diseases. Solid waste and wastewater management is unsatisfactory in Bukavu city. Few scientific investigations have been conducted to assess the influence of environmental conditions on food and water contamination. For these reasons, this study aimed to investigate the quality of food sold in restaurants and on the streets, as well as the types of water and milk produced and consumed, since food safety and environmental sanitation remain major public health challenges in Bukavu city. Objective The…
Genes, proteins, chemicals, diseases, species, mutations and cell lines named across the full text — each resolved to its canonical identifier and authoritative record.
Click any figure to enlarge with its caption.
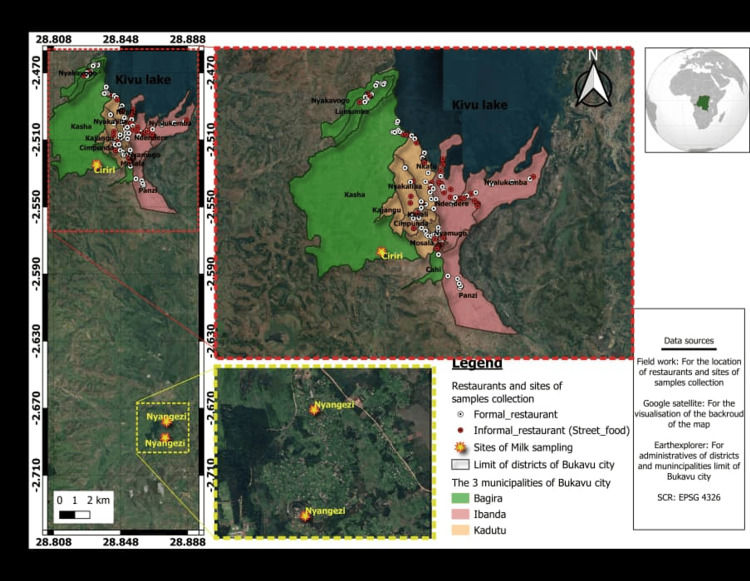 Figure 1
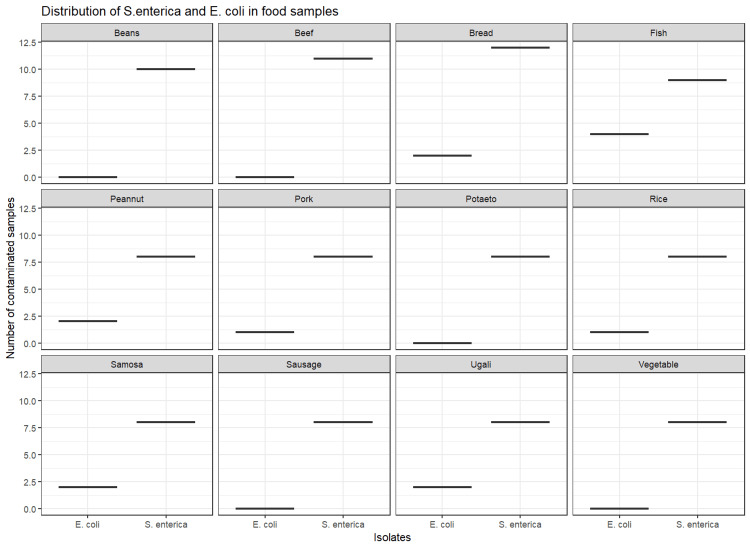 Figure 2
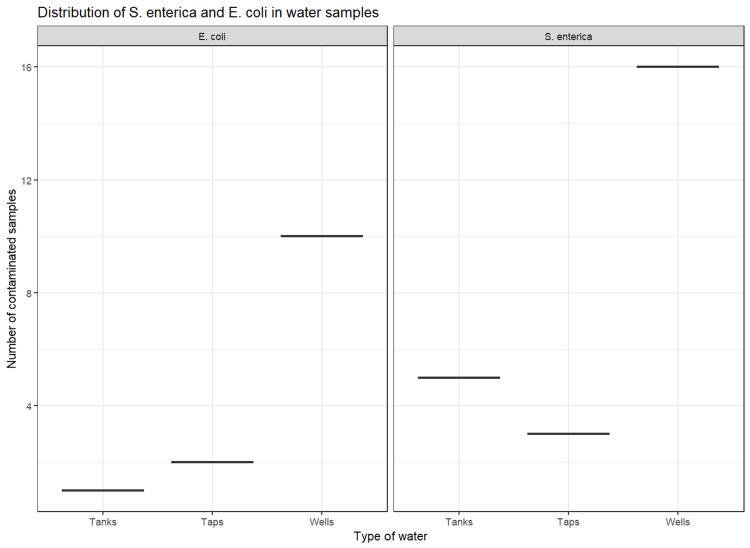 Figure 3
| Municipality | Type of restaurants | Total | |
| Formal restaurant | Informal restaurant | ||
| Bagira | 32 | 9 | 41 |
| Ibanda | 41 | 53 | 94 |
| Kadutu | 46 | 25 | 71 |
| Total | 119 | 87 | 206 |
| Municipality | Price of meals | Total | |
| Low-cost restaurant (≤ 1 $) | Expensive restaurant (>1 $) | ||
| Bagira | 40 | 1 | 41 |
| Ibanda | 85 | 9 | 94 |
| Kadutu | 70 | 1 | 71 |
| Total | 195 | 11 | 206 |
| Municipality | Food | Water | Milk | Total | ||
| Tap | Tank | Well | ||||
| Bagira | 65 | 12 | 4 | 4 | 0 | 85 |
| Ibanda | 105 | 16 | 0 | 4 | 0 | 125 |
| Kadutu | 245 | 16 | 16 | 20 | 0 | 297 |
| Kabare | 0 | 0 | 12 | 0 | 0 | 12 |
| Ciriri | 0 | 0 | 0 | 0 | 13 | 13 |
| Nyangezi 1 | 0 | 0 | 0 | 0 | 11 | 11 |
| Nyangezi 2 | 0 | 0 | 0 | 0 | 10 | 10 |
| Total | 415 | 44 | 32 | 28 | 34 | 553 |
| Variables | Frequency (n = 206) | % (95%CI) | p-value | Chi-square value |
| Age | ||||
| 15–50 years old | 187 | 90.8 (85.9-94.3) | 0.00 | 96.9 |
| >50 years old | 19 | 9.2 (5.6-14.0) | ||
| Gender | ||||
| Female | 93 | 45.1 (38.2-52.2) | 0.29 | 1.1 |
| Male | 113 | 54.9 (47.8-61.8) | ||
| Marital status | ||||
| Single | 86 | 41.7 (34.9-48.8) | 0.00 | 138.5 |
| Married | 109 | 52.9 (45.9-59.9) | ||
| Divorced | 4 | 2 (0.5-4.9) | ||
| Widowed | 7 | 3.4 (1.4-6.9) | ||
| Literacy level | ||||
| Illiterate | 19 | 9.2 (5.6-14.0) | 0.00 | 185.1 |
| Primary | 32 | 15.5 (10.9-21.2) | ||
| Secondary | 133 | 64.6 (57.6-71.1) | ||
| Undergraduate | 21 | 10.2 (6.4-15.2) | ||
| No response | 1 | 0.5 (0.0-2.8) | ||
| Variables | Frequency (n = 206) | % (95% CI) | p-value | Chi-square value |
| Source of food raw materials | ||||
| Directly from farm and fishery | 2 | 1.0 (0.1-3.5) | 0.00 | 272.3 |
| Public market | 179 | 86.9 (81.5-91.2) | ||
| Grocery store or supermarket | 9 | 4.3 (2.0-8.1) | ||
| Other sources | 16 | 7.8 (4.5-12.3) | ||
| Mode of transportation of food raw materials | ||||
| Walking with food on head | 77 | 37.4 (30.8-44.4) | 0.01 | 8.9 |
| Vehicle (taxi, bus, car) | 83 | 40.3 (33.5-47.3) | ||
| Motorcycle | 46 | 22.3 (16.8-28.6) | ||
| Type of restaurant customers | ||||
| Children | 3 | 1.5 (0.3-4.2) | 0.00 | 107.6 |
| Adults | 62 | 30.1 (23.9-36.9) | ||
| Children and adults | 141 | 68.4 (61.6-74.7) | ||
| Availability of hand sanitizer | ||||
| Yes | 84 | 40.8 (34.0-47.8) | 0.00 | 76.0 |
| No | 115 | 55.8 (48.8-62.7) | ||
| Present sometimes | 7 | 3.4 (1.4-6.9) | ||
| Availability of hand washing device | ||||
| Yes | 128 | 62.1 (55.1-68.8) | 0.00 | 7.6 |
| No | 78 | 37.9 (31.2-44.9) | ||
| Presence of washroom in restaurant | ||||
| Yes | 117 | 56.8 (49.7-63.7) | 0.13 | 2.27 |
| No | 89 | 43.2 (36.3-50.3) | ||
| Garbage around restaurants | ||||
| Yes | 142 | 68.9 (62.1-75.2) | 0.00 | 19.2 |
| No | 64 | 31.1 (24.8-37.9) | ||
| Food exposed to dust | ||||
| Yes | 139 | 67.5 (60.6-73.8) | 0.00 | 85.3 |
| No | 52 | 25.2 (19.5-31.7) | ||
| Sometimes | 15 | 7.3 (0.4-11.7) | ||
| Food on continuous heat | ||||
| Yes | 103 | 50.0 (43.0-57.0) | 0.00 | 29.5 |
| No | 72 | 35.0 (28.5-41.9) | ||
| Sometimes | 31 | 15.0 (10.5-20.7) | ||
| Food preservation state before serving | ||||
| Food stored open | 68 | 33.0 (26.6-40.0) | 0.00 | 15.3 |
| Food stored closed | 138 | 67.0 (60.1-73.4) | ||
| Frequency of cooking food | ||||
| Daily | 179 | 86.9 (81.5-91.2) | 0.00 | 359.5 |
| Once per week | 3 | 1.5 (0.3-4.2) | ||
| Twice per week | 7 | 3.4 (1.4-6.9) | ||
| Thrice per week | 12 | 5.8 (3.0-10) | ||
| Others (depending on sales) | 5 | 2.4 (0.8-5.6) | ||
| Wearing uniforms during food service | ||||
| Yes | 10 | 4.9 (2.4-8.7) | 0.00 | 121.1 |
| No | 196 | 95.1 (91.3-97.6) | ||
| Refrigerate food at the restaurant | ||||
| Yes | 35 | 17.0 (12.1-22.8) | 0.00 | 61.5 |
| No | 171 | 83.0 (77.2-87.9) | ||
| Offer takeaway food service | ||||
| Yes | 133 | 64.6 (57.6-71.1) | 0.00 | 11.1 |
| No | 73 | 35.4 (28.9-42.4) | ||
| Packaging type used for take-way food | ||||
| Nylon bag | 1 | 0.5(0.0-2.7) | 0.00 | 91.5 |
| Plastic bag | 104 | 50.5(43.5-57.5) | ||
| Other packaging (carton, kraft paper) | 36 | 17.4(12.5-23.4) | ||
| No response | 65 | 31.6(25.3-38.4) | ||
| Overnight food served | ||||
| Yes | 139 | 67.5 (60.6-73.8) | 0.00 | 16.3 |
| No | 67 | 32.5 (26.2-39.4) | ||
| Heating food before serving customers | ||||
| Yes | 102 | 49.5 (42.5-56.5) | 0.00 | 18.5 |
| No | 45 | 21.9 (16.4-28.1) | ||
| No response | 59 | 28.6 (22.6-35.3) | ||
| Water used and consumed in the restaurant | ||||
| REGIDESO water | 168 | 81.5 (75.6-86.6) | 0.00 | 234.1 |
| Bottle packaged water | 23 | 11.2 (7.2-16.3) | ||
| Water from well | 1 | 0.5 (0.0-2.7) | ||
| Water not served to customers | 14 | 6.8 (3.8-11.1) | ||
| Water boiled before serving customers | ||||
| Yes | 9 | 4.4 (2.0-8.1) | 0.00 | 124.0 |
| No | 197 | 95.6 (91.9-98) | ||
| Sample type |
| (95% CI) |
| (95%CI) | p-value | Chi-square value | |
| Food (n = 415) | |||||||
| Beans (n = 41) | 10 (24.4) | (12-4 0) | 0 (0.0) | (0-8.6) | 0.15 | 15.57 | |
| Beef (n = 34) | 11 (32.4) | (17.4-50.5) | 0 (0.0) | (0-10.3) | |||
| Fish (n = 34) | 9 (26.5) | (12.9-44.4) | 4 (11.8) | (3-27.5) | |||
| Bread (n = 34) | 12 (35.3) | (19.7-53.5) | 2 (5.9) | (1-19.7) | |||
| Peanuts (n = 34) | 8 (23.5) | (10.7-41.2) | 2 (5.9) | (1-19.7) | |||
| Pork (n = 34) | 13 (38.2) | (22.2-56.4) | 1 (2.9) | (0-15.3) | |||
| Potato (n = 34) | 11 (32.4) | (17.4-50.5) | 0 (0.0) | (0-10.3) | |||
| Rice (n = 34) | 7 (20.6) | (8.7-37.9) | 1 (2.9) | (0-15.3) | |||
| Samosaa(n = 34) | 6 (17.6) | (6.8-34.5) | 2 (5.9) | (1-19.7) | |||
| Sausage (n = 34) | 13 (38.2) | (22.2-56.4) | 0 (0.0) | (0-10.3) | |||
| Ugalib (n = 34) | 13 (38.2) | (22.2-56.4) | 2 (5.9) | (1-19.7) | |||
| Vegetables (n = 34) | 9 (26.5) | (12.9-44.4) | 0 (0.0) | (0-10.3) | |||
| Total (n = 415) | 122 (29.4) | (25.1-34.0) | 14 (3.4) | (2-5.6) | |||
| Water (n = 104) | |||||||
| Tap (n = 44) | 3 (6.8) | (1.4-18.7) | 2 (4.5) | (0.6-15.5) | 0.58 | 1.07 | |
| Tank (n = 32) | 5 (15.6) | (5.3-32.8) | 1 (3.1) | (0.1-16.2) | |||
| Well (n = 28) | 16 (57.1) | (37.2-75.5) | 10 (35.7) | (18.6-55.9) | |||
| Total (n = 104) | 24 (23.1) | (15.4-32.4) | 13 (12.5) | (6.8-20.4) | |||
| Milk (n = 34) | |||||||
| Farm 1 (n = 13) from Ciriri | 1 (7.7) | (0.2-36.0) | 0 (0.0) | (0-25.0) | 0.07 | 3.46 | |
| Farm 2 (n = 11) from Nyangezi | 2 (18.2) | (2.0-52.0) | 0 (0.0) | (0-28.0) | |||
| Farm 3 (n = 10) from Nyangezi | 3 (30.0) | (7.0-65.0) | 0 (0.0) | (0-31.0) | |||
| Total (n = 34) | 6 (17.6) | (7.0-35.0) | 0 (0.0) | (0-10.0) | |||
| Independent variables | Dependent variables | p-value | Chi-square value | |
| Municipality | ||||
| Bagira | 22 (18.0) | 1(7.1) | 0.15 | 3.68 |
| Ibanda | 37 (30.3) | 2 (14.3) | ||
| Kadutu | 63 (51.6) | 11(78.6) | ||
| Type of restaurant | ||||
| Formal | 41 (33.6) | 5(35.7) | 1.00 | 0.00 |
| Informal | 81 (66.4) | 9(64.3) | ||
| Price of meals | ||||
| Cheap | 89 (73.0) | 11(78.6) | 0.89 | 0.01 |
| Expensive | 33 (27.0) | 3 (21.4) | ||
| Availability of hand sanitizer | ||||
| Yes | 20 (16.4) | 2 (14.3) | 0.97 | 0.04 |
| No | 68 (55.7) | 8 (57.1) | ||
| Sometimes | 34 (27.9) | 4 (28.6) | ||
| Availability of hand washing device | ||||
| Yes | 46 (37.7) | 3 (21.4) | 0.36 | 0.82 |
| No | 76 (62.3) | 11(78.6) | ||
| Presence of washroom in restaurant | ||||
| Yes | 69 (56.6) | 9(64.3) | 0.78 | 0.07 |
| No | 53 (43.4) | 5(35.7) | ||
| Garbage around restaurants | ||||
| Yes | 84 (68.9) | 11(78.6) | 0.65 | 0.19 |
| No | 38 (31.1) | 3(21.4) | ||
| Food exposed to dust | ||||
| Yes | 82 (67.2) | 9(64.3) | 0.81 | 0.41 |
| No | 11 (9.0) | 2(14.3) | ||
| Sometimes | 29 (23.8) | 3(21.4) | ||
| Food on continuous heat | ||||
| Yes | 58 (47.5) | 7(50.0) | 0.96 | 0.08 |
| No | 43 (35.2) | 5(35.7) | ||
| Sometimes | 21 (17.2) | 2(14.3) | ||
| Food preservation state before serving | ||||
| Food stored opened | 83 (68.0) | 11(78.6) | 0.61 | 0.25 |
| Food stored closed | 39 (32.0) | 3(21.4) | ||
| Frequency of cooking food | ||||
| Daily | 56 (45.9) | 12(85.7) | 0.03 | 10.66 |
| Once per week | 9 (7.4) | 0(0.0) | ||
| Twice per week | 6 (4.9) | 0(0.0) | ||
| Thrice a week | 15 (12.3) | 1(7.1) | ||
| Others (depending on food sales) | 36 (29.5) | 1(7.1) | ||
| Wearing uniforms during food service | ||||
| Yes | 24 (19.7) | 1(7.1) | 0.43 | 0.61 |
| No | 98 (80.3) | 13(92.9) | ||
| Refrigerate food at the restaurant | ||||
| Yes | 21 (17.2) | 1(7.1) | 0.55 | 0.34 |
| No | 101 (82.8) | 13(92.9) | ||
| Overnight food served | ||||
| Yes | 82 (67.2) | 9(64.3) | 1.00 | 0.00 |
| No | 40 (32.8) | 5(35.7) | ||
| Heating food before serving customers | ||||
| Yes | 27 (22.1) | 7(50.0) | 0.05 | 5.98 |
| No | 60 (49.2) | 3(21.4) | ||
| No response | 35 (28.7) | 4(28.6) | ||
| Type of water used in the restaurant | ||||
| State company water | 78 (63.9) | 11(78.6) | 0.03 | 8.55 |
| Bottle package water | 28 (23.0) | 0(0.0) | ||
| Water of well | 3 (2.4) | 2(14.3) | ||
| Water not served to customers | 13 (10.7) | 1(7.1) | ||
| Water boiled and served to clients | ||||
| Yes | 117 (95.9) | 13 (92.8) | 0.65 | 0.20 |
| No | 5 (4.1) | 1 (7.2) | ||
Peer Reviews
No public reviews on file for this paper yet. If you reviewed it on a platform where reviews are public (OpenReview, ICLR, NeurIPS, ICML), you can paste yours below so the community can read it here.
Videos
No videos yet. Explain this paper in a talk, walkthrough, or lecture? Add one.
Taxonomy
TopicsSalmonella and Campylobacter epidemiology · Child Nutrition and Water Access · Vibrio bacteria research studies
Introduction
Salmonella enterica and Escherichia coli are among the Enterobacteriaceae that cause infectious diseases in humans and animals. These species live in water, food, soil, grass, and air and are implicated in foodborne and waterborne diseases [1,2]. Food and water are therefore the main sources from which pathogenic bacteria spread from the environment to infect humans and animals. Worldwide, Salmonella infection remains a public health threat, with 11.9 million typhoid fever cases and approximately 129,000 deaths per year in low- and middle-income countries. This issue is exacerbated by poverty due to the heavy economic burden of treatment [3].
The Democratic Republic of Congo, a low-income country, faces the challenge of foodborne and waterborne diseases, along with multifaceted conflicts and other health crises [4,5]. These challenges contribute to population displacement, high mortality rates, and increasing cases of emerging and re-emerging diseases [6,7]. Indeed, contaminated food and water pose a threat to human and animal health by causing various bacterial and parasitic infections [8,9]. However, the prevalence of bacteria in environmental samples such as food and water is underestimated. Previous studies have primarily focused on the prevalence of *Salmonella *and *Escherichia *infections in human samples (blood, urine, and stool) collected from hospitals [10-12]. The environmental aspects of infections associated with these pathogens are often neglected or under-investigated.
Residents of Bukavu city struggle to access clean drinking water despite the presence of Lake Kivu and several rivers [13]. In recent years, the Inspectorate of Hygiene and Health Conditions has reported several cases of diarrhea, enteric fever, cholera, and typhoid fever in the city [9]. A study in Bukavu city revealed a high incidence of *E. coli *(83%) and other pathogenic bacterial species (77%) in samples from street-vended foods [14]. Given that these foods are more accessible to lower-income populations, they constitute an important but often overlooked factor in the transmission of pathogenic bacteria. For example, Ngaruka et al. reported an association between the type of food consumed and the prevalence of *Salmonella *infection in patients [15].
In the Bukavu hinterlands, farmers produce milk and other dairy products such as cheese and yogurt, but the microbial quality of these products remains a challenge [16]. In addition to inadequate hygiene practices in food handling, poor sanitation remains a major public health challenge in Bukavu city. The city lacks sufficient sewage systems to ensure the safe collection and disposal of wastewater [6,13]. In some neighborhoods, water shortages can last for a week, while in others, there is no piped water supply. Water is therefore obtained from natural or artificial wells or from Lake Kivu [6]. Additionally, Bukavu city experiences various challenges, including landslides, water pollution, recurring cholera outbreaks, the presence of displaced populations, and impassable roads [9,13].
These challenges, combined with unreliable water supply and insufficient hygiene practices in restaurants, increase consumers' susceptibility to foodborne and waterborne diseases. This could silently contribute to a rise in infectious diseases in Bukavu city. However, there are limited studies on the prevalence of foodborne and waterborne diseases and the occurrence of S. enterica and E. coli in Bukavu. The public health challenge is further exacerbated by insufficient food and water safety controls by state services.
In alignment with the One Health concept, which promotes a holistic approach to addressing health issues as defined by Fao et al. [17], this study aimed to assess the hygienic conditions of restaurants and street-vended ready-to-eat foods, determine the prevalence of *S. enterica *and *E. coli *in food, milk, and water samples, and evaluate the distribution of *S. enterica *and *E. coli *in food in relation to hygiene practices applied by food handlers in restaurants. By achieving these objectives, this study has contributed to raising awareness among Bukavu residents. The findings could encourage food handlers to systematically monitor hygiene practices, particularly during food service. Additionally, the study provides recommendations for public health authorities to strengthen routine food and water quality monitoring. Finally, this study serves as scientific evidence to urge local and national decision-makers to improve sanitation in Bukavu city.
Materials and methods
Study area
The food, water, and milk samples were collected in Bukavu city, located at 2º29’-2º33’ South and 28º48’-28º52’ East, at an altitude ranging from 1,463 to 2,200 m in South Kivu Province, Democratic Republic of Congo. The city spans 60 km² and has approximately 1.5 million inhabitants residing in three municipalities: Bagira, Ibanda, and Kadutu (Figure 1). The Bukavu region is characterized by a humid tropical climate, with nine months of rainfall (September-May) and three dry months (June-August), receiving an average annual rainfall of 1,414 mm [9,13].
Sampling sites across three municipalities of Bukavu city where food and water samples were collected and two localities (Ciriri and Nyangezi) for milk samples. This figure is the authors' own creation using the global positioning system of each location where samples were collected. This map was created using QGIS. The waypoints were collected using KoboCollect.
Field observations and determination of sample size for the survey
The selection of restaurants for investigation was based on the geological morphology of Bukavu city, which is dominated by mountains, with most economic activities concentrated along the main roads. Given the lack of official statistics on the number of restaurants, a field observation was conducted to locate restaurants across the three municipalities of Bukavu city. A total of 119, 321, and 302 formal restaurants and street-vended food establishments were identified in Bagira, Ibanda, and Kadutu, respectively. A survey questionnaire was used to collect information from food handlers. Before administering the questionnaire to respondents, a pre-survey was conducted from November 10 to 17, 2022, in selected restaurants located in the Kharale district, an area primarily frequented by students from three universities: Université Officielle de Bukavu, Université Catholique de Bukavu, and Institut Supérieur des Techniques Médicales de Bukavu. Following the pre-survey, the questionnaire was refined to improve clarity and relevance.
To determine the number of food handlers to be surveyed, a probabilistic model was applied using the equation:
\begin{document}n=\frac{Ɛ^{2}pq}{d^{2}}\end{document}
where n represents the sample size, p is the proportion of hygiene practices applied in restaurants, q is 1 - p, Ɛ is 1.65, and d is the precision at 10%. Given that the proportion of restaurants and their hygiene practices in Bukavu were unknown, p and q were assigned equal probabilities (p = 50% and q = 50%) [18]. By substituting these values into the equation, the minimum number of food handlers required for the survey was determined to be 67.
Field survey
To select the restaurants to be included in the study, each municipality was considered a subgroup of all restaurants in Bukavu city, forming three subgroups based on the field observation: 119, 321, and 302 restaurants in Bagira, Ibanda, and Kadutu, respectively. Next, a simple random method was applied to identify which restaurants to include in the study. Using a survey questionnaire, food handlers were interviewed in two stages, from December 10 to 20, 2022, and from June 5 to 23, 2023. The structured questionnaire was implemented in the Kobo Collect application as a tool to collect data related to the socio-demographic profile of food handlers, characterization of restaurants and hygiene practices, sanitation conditions in and around restaurants, and the origin of water used for cooking and drinking in restaurants (Tables 4-6). One food handler was interviewed in each restaurant, and the same questionnaire was used for all participants.
During the pre-survey, most food handlers refused to participate in the study, requesting payment before responding to the questions. Others refused for personal reasons or due to being too busy serving customers. To minimize refusals, the survey involved visiting restaurants and engaging the food handler by explaining the purpose of the study before requesting their participation. If a food handler refused to respond, the investigator moved to the next identified restaurant to survey as many restaurants as possible. Using this approach, 234 food handlers were interviewed, and information related to the study objectives was collected. During data processing, all questionnaires where respondents did not answer at least three questions were excluded from the study, leaving responses from 206 food handlers for statistical analysis (Tables 1, 2). The simple random method was also applied to identify taps, wells, and tanks for water sampling. Milk samples were collected from two localities surrounding Bukavu city.
Collection and transportation of samples for bacteriological analyses
Five hundred and fifty-three (553) samples, consisting of 415 food samples, 104 water samples, and 34 milk samples, were collected and examined (Table 3) from December 2022 to January 2024. Water and milk samples were collected in the morning from 6:00 to 9:00 hours, while food samples were collected from 10:00 AM to 14:00 hours. Approximately 100 g of each food sample was purchased from restaurants; 500 mL of water was sampled from each tap, tank, or well; and 500 mL of each milk sample was collected from dairy farms. Samples were placed in sterile Erlenmeyer flasks and transported in a cooler box within four hours post-sampling to the Microbiology and Biotechnology Laboratory of the “Université Officielle de Bukavu” for bacterial isolation, biochemical tests, and species identification.
Isolation and identification of Salmonella enterica and Escherichia coli from samples
*S. enterica *and *E. coli *were isolated according to Adzitey et al. [19] with modifications. For S. enterica, 25 g of food or 25 mL of water/milk sub-samples were aseptically weighed, pre-enriched in 225 mL of peptone water (PW) (TM Media, India), homogenized, and incubated at 37°C for 24 hours. Subsequently, 1 mL of positive PW culture was transferred into 10 mL of Tryptone Water Broth (TWB) (HiMedia, India) and incubated at 37°C for 24 hours. Next, 1 mL of positive TWB culture was inoculated onto Hektoen Enteric Agar (HEA) (TM Media, India) and incubated at 37°C for 24 hours. Finally, 1-3 presumptive Salmonella colonies from HEA were streaked onto Salmonella-Shigella (SS) agar (TM Media, India) and incubated at 37°C for 24 hours. If no colony grew on SS agar, plates were re-incubated under the same conditions to confirm the true absence of Salmonella. For E. coli, 1 mL of positive PW culture was inoculated onto Eosin Methylene Blue (EMB) agar and incubated at 37°C for 24 hours. Suspected *Escherichia *colonies from EMB were then streaked onto MacConkey agar (MCA) and incubated at 44°C for 24 hours. From SS agar or MCA, 2-3 colonies were streaked onto nutrient agar (Oxoid, England) for purification and incubated at 37°C for 24 hours. Finally, purified *Salmonella *or *Escherichia *isolates underwent morphological characterization through macroscopic observation of colonies grown on selective agar and microscopic observation using Gram staining. For biochemical characterization, isolates were tested for citrate, catalase, indole, urease, glucose and lactose fermentation, H₂S production, and motility according to Rahman et al. [20].
Statistical analysis
Data were analyzed using RStudio 4.4.0 [21]. Descriptive statistics were applied to compute the prevalence of bacteria based on the occurrence of S. enterica or E. coli in positive cultures and to summarize data related to the socio-demographic characteristics of food handlers. Additionally, the number of "yes/presence" (indicating the application of hygiene practices in restaurants) and "no/absence" (indicating non-application of hygiene practices) was recorded for each question in the questionnaire. The distribution of bacteria in each type of food was assessed in relation to the responses (yes or no) to hygiene practices provided by food handlers. Next, a contingency table was created, and the chi-square test was applied to determine the dependence or independence of the occurrence of *S. enterica *and *E. coli *in food samples relative to the application or non-application of hygiene practices by food handlers. The binomial test at a 95% confidence interval (CI) was applied to assess the probability and reliability of bacterial prevalence in food, water, and milk, as well as the proportion of other qualitative variables assessed during the survey. Mean differences in each test were considered significant at p-value ≤ 0.05.
Ethical considerations
Prior to conducting this study, the proposal was presented during a special postgraduate seminar and approved by the Postgraduate Committee of the University of Nairobi in Kenya and the Université Officielle de Bukavu in DR Congo. During the field activity, participation in the survey was voluntary. Each food handler was informed about the questionnaire and the purpose of the study, provided with verbal assurance of the strict confidentiality of the information collected, and asked for verbal consent before participating in the study.
Results
Demographics of food handlers
Out of the 206 food handlers, 90.8% were under 50 years old, 54.9% were male, and 64.6% had a literacy level up to secondary school. The distribution of food handlers by age, marital status, and literacy level was significantly different (p < 0.05), but no significant difference was observed based on gender (p = 0.29) (Table 4).
Hygiene practices and types of foods sold in Bukavu restaurants
After analyzing responses to each questionnaire, the survey revealed that most of the 206 food handlers followed hygiene practices that did not ensure sufficient food safety conditions. In particular, many restaurants lacked hand sanitizers and washrooms, were surrounded by garbage, and sold food exposed to dust. Most restaurants also lacked refrigerators for food storage. Despite this, they served food cooked the day before, and some did not reheat food before serving customers. Waitresses did not wear a hat or appropriate uniform during food service. The majority of restaurants used water supplied by the state company but did not boil it before serving customers (Table 5). Additionally, 12 types of food were commonly sold and consumed in Bukavu restaurants, including ugali, vegetables, beans, bread, potatoes, rice, fish, beef, pork, sausage, samosas, and peanuts (Table 6).
Prevalence of Salmonella enterica and Escherichia coli in food, water, and milk
Table 6 presents the distribution of *S. enterica *and *E. coli *strains in food, water, and milk samples. The prevalence of *S. enterica *was high in pork (38.2%, n = 34), sausage (38.2%, n = 34), ugali (38.2%, n = 34), bread (35.3%, n = 34), beef (32.4%, n = 34), potatoes (32.4%, n = 34), and beans (24.4%, n = 41). While *E. coli *was not isolated from beans, beef, potatoes, sausage, or vegetable samples, the bacterium was most prevalent in fish (11.8%, n = 34) (Figure 2). Water from wells (n = 28) tested positive for S. enterica (57.1%) and *E. coli *(35.7%) (Figure 3). Milk samples from Nyangezi (farms 2 and 3) were positive for *S. enterica *(23.8%, n = 21), while none tested positive for E. coli. Contamination by *S. enterica *and *E. coli *did not significantly differ between food (p = 0.15) and water samples (p = 0.58), suggesting that the occurrence of both bacteria was independent of the type of food and water analyzed. The presence of Salmonella in milk samples was also independent (p > 0.05) of the location of the dairy farms (Ciriri or Nyangezi).
Distribution of S. enterica and E. coli isolated from 12 types of food most consumed in restaurants of Bukavu city. This figure summarizes the number of positive samples for S. enterica and E. coli in each food sample.
Distribution of S. enterica and E. coli isolated from three types of water analyzed in Bukavu city.This figure summarizes the number of positive samples for S. enterica and E. coli in each water sample. Water from taps and tanks is treated and distributed by the state company. Wells are natural or artificial excavations in the ground with flowing water.
Distribution of *Salmonella enterica *and *Escherichia coli *in food samples in relation to hygiene practices in Bukavu restaurants
There was a significant (p ≤ 0.05) relationship between the distribution of *S. enterica *and *E. coli *strains in food and the hygiene practices of "heating food before serving customers," "frequency of cooking food," and "type of water used in the restaurant." Statistical analysis showed that other hygiene practices, such as "availability of hand sanitizer," "availability of a handwashing device," "availability of washrooms," "presence of garbage around restaurants," "exposure of food to dust," "state of food preservation before serving," and "refrigeration of food in restaurants," also contributed to bacterial contamination in food but with a non-significant probability (p > 0.05). The distribution of *S. enterica *and *E. coli *in food was not associated with the "location of restaurants" (Bagira, Ibanda, Kadutu), "type of restaurant" (formal or informal), or the "price of meals" (cheap or expensive) (p > 0.05) (Table 7).
Discussion
Prevalence of Salmonella enterica and Escherichia coli in food, water, and milk samples
The findings from the current study revealed a notable prevalence of S. enterica and E. coli across different food, water, and milk samples collected in Bukavu city, which could be attributed to various environmental and hygiene-related factors. The study noted a prevalence of 29.4% for S. enterica and 3.4% for *E. coli *among 415 food samples. Among water samples (n = 104), 23.1% tested positive for S. enterica and 12.5% for *E. coli. *Out of 34 milk samples, 17.6% tested positive for S. enterica. These findings highlight the public health risks associated with these pathogenic contaminants in Bukavu city.
The contamination levels observed in this study are consistent with findings from other regions where poor sanitation and waste management systems have been identified as contributing factors to bacterial contamination. A study conducted in Bukavu city confirmed that all street-vended food samples (n = 80) tested positive for S. enterica (100%) and E. coli (100%), which could increase the risk of infectious diseases and pose a health burden for low-income populations [14]. Other studies have reported that Bukavu city continues to struggle with waste and sanitation issues [9,13]. Consequently, food and water sold under such environmental conditions remain highly susceptible to contamination by pathogens, including *S. enterica *and E. coli.
Focusing on the bacterial prevalence in each of the 12 analyzed food types, S. enterica ranged from 17.6% (n = 34) in samosas to 38.2% (n = 34) in pork, sausage, and ugali. The prevalence of E. coli ranged from 2.9% (n = 34) in pork and rice to 11.8% (n = 34) in fish. These results align with those reported by Ombeni et al. [14], who found that all street-vended foods (sausage, boiled meat, fish) were contaminated with S. enterica and E. coli.
Moreover, a study conducted in Kinshasa, DR Congo, reported that the prevalence of S. enterica was 11.1% (n = 72) in fish, 14.4% (n = 84) in meat sampled from slaughterhouses, 18.3% (n = 120) in meat from public markets, and 27.5% (n = 40) in beef carcasses from public abattoirs [22]. In Motta town, Ethiopia, Yasigat et al. [23] reported a *Salmonella *prevalence of 2.5% (n = 255) among food handlers. In Assiut, Egypt, El-Mohsen et al. [24] reported a prevalence of 11.4% (n = 220) for S. enterica in chicken.
In related studies, S. enterica was detected in vegetable salads (8.5%, n = 246) and in raw mixed salads (2.6%, n = 306) [25], in 47.5% (n = 225) of meat samples [19], and in poultry (13.9%), pig (13.1%), and cattle fecal samples (5.3%) [26]. The high prevalence of S. enterica and E. coli in food could be attributed to several factors, including improper food handling. Additionally, the health status of waiters and waitresses may influence food contamination, particularly among those who do not undergo regular medical check-ups [23].
Similar to the findings of the current study regarding food and water, results from other studies indicate a high prevalence of *S. enterica *in human and animal samples in the DRC. The prevalence of S. enterica was reported in human stool samples (4.4%, n = 98) and blood samples (30.4%, n = 299) [10,11], as well as in rats (8.1%, n = 566) [27]. This suggests that food and water remain a neglected niche for S. enterica and E. coli, from which humans and animals could become infected. The study underscored the role of hygiene practices in food safety, particularly in restaurant environments and during food service stages. Therefore, there is a need to establish strong control measures and countermeasures to mitigate the spread of pathogenic bacteria and reduce cases of infectious diseases in low-income settings such as the DR Congo.
Water samples from wells (n = 28) were more contaminated with S. enterica (57.1%) and *E. coli *(35.7%) than water from taps and tanks. A previous study reported a high prevalence of parasites (57%-77%) in rivers crossing Bukavu city [9], while Mbuyi-Kalonji et al. [28] found that the prevalence of parasites in the environment was correlated with the presence of non-typhoidal *Salmonella *(NTS) in co-infection with Schistosoma mansoni. In Butembo city, DR Congo, 40% of the water distributed by the state company did not meet World Health Organization standards for human consumption due to bacterial contamination, including *E. coli *and *S. enterica *[8]. However, the current study differs from the findings of Nieniea et al. [29], who did not isolate *E. coli *from well water samples collected in Kikwit city, DR Congo. Milk samples from Nyangezi (farm 3) were more contaminated (30%, n = 10) with *S. enterica *than those from Ciriri (farm 1, n = 13) and Nyangezi (farm 2, n = 11). These findings are consistent with those of Bacigale et al. [16], who reported a high prevalence of *S. enterica *(66.7%, n = 302), while *E. coli *was not detected in milk samples.
The current study suggests that water sources, particularly wells, pose a greater contamination risk for *S. enterica *and E. coli. Milk contamination may result from inadequate hygiene practices during collection and storage, compromising the bacterial quality of milk sold in Bukavu city. Poor water and milk quality pose a health risk to humans and animals. Addressing this issue requires strengthening existing water treatment plants with enhanced microbiological treatment protocols, improving sanitation around wells, and enforcing better hygiene practices during milk collection.
Distribution of S. enterica and *E. coli *strains in food samples in relation to hygiene practices
This study assessed the distribution of *S. enterica *and *E. coli *strains in food samples in relation to hygiene practices applied in restaurants to determine the probable origin of bacterial contamination in ready-to-eat food sold in Bukavu restaurants. The results revealed that *S. enterica *and *E. coli *were present in food samples collected from restaurants, indicating inadequate hygiene practices that make food unsafe for consumers. Ombeni et al. [14] and Yasigat et al. [23] reported similar findings, showing that the occurrence of pathogenic bacteria in street-vended foods was strongly influenced by poor hygiene among food handlers. Additionally, food contamination was associated with poor personal hygiene, including untrimmed and unclean fingernails, Salmonella carriers among food handlers, the absence of proper clothing or footwear during service, and improper utensil cleaning practices.
The association between poor hygiene and the presence of these pathogens is evident. Combined with inadequate food handling and poor personal cleanliness among food handlers, the risk of food contamination in Bukavu restaurants remains difficult to control. This underscores the need for improved sanitation and hygiene protocols, particularly in public food establishments and markets where food is often exposed to contamination.
This study did not account for seasonal variations in the contamination of milk, food, and water samples by *Salmonella *and *Escherichia *species. However, Tack et al. [30] reported that non-typhoidal *Salmonella *(NTS) occurrence in the DR Congo was associated with rainfall. This suggests that environmental factors and climate change may contribute to the spread of NTS. Therefore, the findings highlight the necessity of controlling environmental dimensions of food safety to limit the spread of *Salmonella *and *Escherichia *species in Bukavu city. Moreover, it is essential to train farmers and food handlers on proper handling of milk, food, and water. In addition, the Public Health Authority must enhance surveillance and reinforce routine checks of food, water, and milk quality before public consumption.
Socio-demographic profiles of food handlers in Bukavu restaurants
Regarding the socio-demographic profiles of food handlers, the study found that the majority were under 50 years old, male, married, and had a secondary school education. These findings corroborate studies conducted in Bukavu city [14] and Motta town, Ethiopia [23], regarding the education level and age of food handlers and their limited training in food safety. In contrast, 84% (n = 80) of food sellers were women from villages surrounding Bukavu city [14], while in Motta town, 82.7% (n = 243) of food handlers were women [23]. Despite these differences, the distribution of food handlers in the current study based on gender was not statistically significant (54.9% versus 45.1%, p = 0.29). Regardless of these factors, hygiene practices remain below acceptable standards, emphasizing the need for food safety training and capacity-building programs.
Additionally, the study revealed that the distribution of S. enterica and *E. coli *was independent of restaurant type, food price, or location. This suggests that all food establishments are at risk of contamination, particularly when raw materials are sourced from public markets with potentially compromised hygiene standards. If hygiene practices are neglected during food preparation and handling, contaminants can survive these stages, posing serious health risks to consumers. Furthermore, the unregulated construction in Bukavu city and the lack of an adequate waste management system contribute to severe sanitation challenges, resulting in direct environmental contamination and indirect contamination of food and water.
Limitations of the study
The results of this study highlighted some realities of Bukavu city and its hinterlands. Foodborne and waterborne diseases being a countrywide challenge, other studies in Bukavu city and data from other regions or cities of DR Congo should be collected and analyzed before generalizing these findings. Another limitation of this study was the absence of molecular analysis of the isolated bacteria. Molecular analysis could have allowed the study of genomic sequences. This would open up further investigations on pathogenic bacteria isolated from food, water, and milk samples, to compare them with those isolated from human and animal samples in DR Congo. Also, the prevalence of pathogenic bacterial genes in food and water samples should have been determined. Furthermore, this study did not consider seasonal variations linked to the presence of bacteria in food and water samples. This could have revealed another factor in the prevalence of these pathogens. In addition, there is a need for future studies to develop a model for qualitative and quantitative microbiological risk assessment to improve food and water checking in Bukavu city, DR Congo.
Conclusions
This study has revealed significant concerns regarding hygiene practices in Bukavu restaurants, which operate under insufficient hygiene measures that compromise food safety. The high prevalence of S. enterica and *E. coli *in food, milk, and water samples indicates a considerable risk of infectious diseases to consumers. This study underscores that food and water are often neglected environmental sources that silently harbor pathogenic bacteria, contributing to their spread throughout Bukavu city. This represents a significant public health challenge. Public Health Authorities in Bukavu must, therefore, prioritize enhanced surveillance and stricter monitoring of food and water quality. Developing clear guidelines and countermeasures aligned with national standards and adopting a comprehensive approach, such as One Health, is essential. Additionally, more focus should be placed on minimizing bacterial contamination during food handling and serving stages, particularly in street-vended and ready-to-eat foods. This study calls for improved sanitation practices, better waste management, and the implementation of stronger regulatory frameworks for food safety and water treatment. Educating food handlers and the public could significantly reduce the health burden of foodborne and waterborne diseases in Bukavu city.
The reference list from the paper itself. Each links out to its DOI / PubMed record.
- 1Salmonellosis outbreak archive in China: data collection and assembly Sci Data Wang Z Huang C Liu Y 2441120243841359610.1038/s 41597-024-03085-7PMC 10899168 · doi ↗ · pubmed ↗
- 2Enterobacteria responsible of urinary infections in Benin: pathogenicity, epidemiology, virulence factors, and multi-resistance J Appl Biol Biotech Dougnon V Assogba P Anago E 11712482020
- 3Epidemiology, clinical presentation, laboratory diagnosis, antimicrobial resistance, and antimicrobial management of invasive Salmonella infections Clin Microbiol Rev Crump JA Sjölund-Karlsson M Gordon MA Parry CM 9019372820152618006310.1128/CMR.00002-15PMC 4503790 · doi ↗ · pubmed ↗
- 4World Bank. Countries classification according to economy income 1 2024 2023 https://datahelpdesk.worldbank.org/378834-how-does-the-world-bank-classify-countries.
- 5Current status of resistance to antibiotics in the Democratic Republic of the Congo: a review J Glob Antimicrob Resist Lupande-Mwenebitu D Baron SA Nabti LZ Lunguya-Metila O Lavigne JP Rolain JM Diene SM 8188252220203268800710.1016/j.jgar.2020.07.008 · doi ↗ · pubmed ↗
- 6Urban water access and use in the Kivus: evaluating behavioural outcomes following an integrated wash intervention in Goma and Bukavu, Democratic Republic of Congo Int J Environ Res Public Health Legge H Fedele S Preusser F Stys P Muzuri P Schuberth M Dreibelbis R 19202210.3390/ijerph 19031065 PMC 883463635162089 · doi ↗ · pubmed ↗
- 7Ebola in the Eastern Democratic Republic of Congo: One Health approach to infectious disease control One Health Sikakulya FK Mulisya O Munyambalu DK Bunduki GK 100117920203199347510.1016/j.onehlt.2019.100117 PMC 6976930 · doi ↗ · pubmed ↗
- 8Spatiotemporal portrait of the quality of water supplied by REGIDESO, DR Congo Adv Microbiol Katswangene PK Oleko WR Kazadi ZA 225242112021