An exposure–safety analysis to support the dosage of the novel AKT inhibitor capivasertib
Carlos Fernandez Teruel, Marie Cullberg, Ignacio González-García, Gaia Schiavon, Diansong Zhou

TL;DR
This study analyzed how capivasertib dosage affects safety in cancer patients, finding that an intermittent schedule reduces side effects compared to continuous dosing.
Contribution
The study identifies exposure–response relationships for capivasertib safety endpoints and recommends an intermittent dosing schedule for better tolerability.
Findings
Intermittent [4/3] dosing reduces the probability of safety events compared to continuous dosing.
Total weekly exposure drives most safety endpoints, while glucose elevations depend on exposure within a dosing interval.
Exposure–response relationships were found for all safety endpoints except AE grade ≥ 1.
Abstract
This study aimed to evaluate capivasertib exposure–response relationships for clinical safety events to support dosage selection. Data from 277 patients with solid tumors participating in three phase 1 studies were analyzed. Capivasertib 80–800 mg was administered as monotherapy orally twice daily (BID) on continuous or intermittent (4 days on, 3 days off [4/3] or 2 days on, 5 days off [2/5]) schedules. Relationships between exposure related metrics (dose, weekly dose, AUC, AUCPWD, Cmax, and Cmin) and probability of safety endpoints (adverse event [AE] leading to dose discontinuation, AE leading to dose modification, serious AE [SAE], AE grade ≥ 3, AE grade ≥ 1, diarrhea AE grade ≥ 2, rash AE grade ≥ 2, hyperglycemia AE grade ≥ 3 and increased blood glucose > 13.9 mmol/L) were evaluated by logistic regression. Significant exposure–response relationships were identified for all safety…
Genes, proteins, chemicals, diseases, species, mutations and cell lines named across the full text — each resolved to its canonical identifier and authoritative record.
Click any figure to enlarge with its caption.
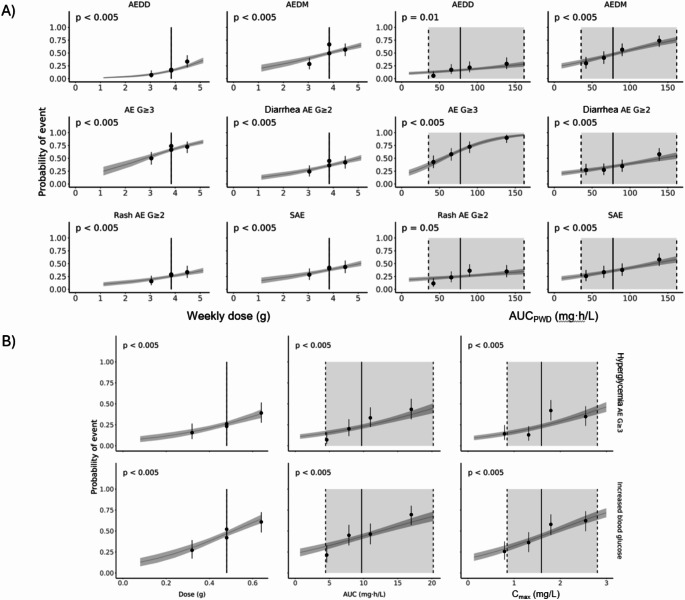 Figure 1
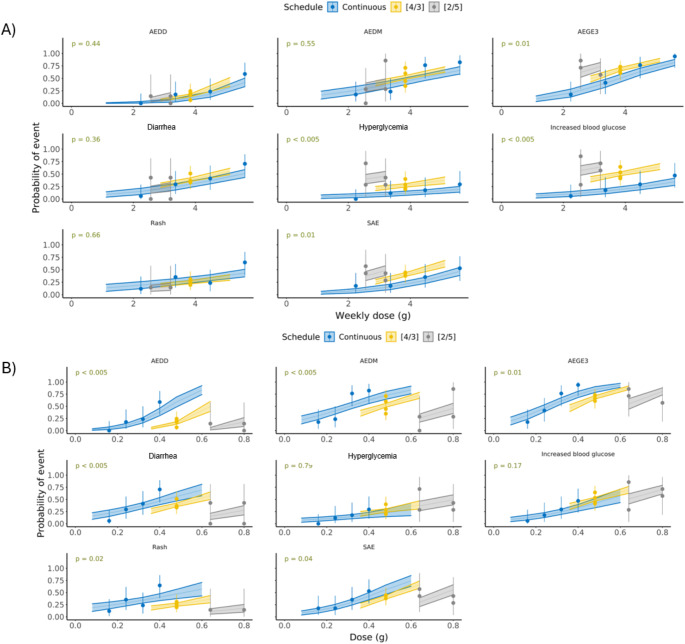 Figure 2
Peer Reviews
No public reviews on file for this paper yet. If you reviewed it on a platform where reviews are public (OpenReview, ICLR, NeurIPS, ICML), you can paste yours below so the community can read it here.
Videos
No videos yet. Explain this paper in a talk, walkthrough, or lecture? Add one.
Taxonomy
TopicsPI3K/AKT/mTOR signaling in cancer · Chronic Myeloid Leukemia Treatments · Chronic Lymphocytic Leukemia Research
Introduction
The phosphatidylinositol 3-kinase (PI3K)/Akt serine/threonine kinase (AKT) signaling pathway is an important signaling pathway regulating cell proliferation and survival [1, 2]. Hyperactivation of the pathway due to PTEN deficiency or activating mutations in the catalytic subunit alpha of phosphatidylinositol-3-kinase (PIK3CA) and in AKT1 is implicated in tumor growth across cancer indications [3]; hence, the PI3K/AKT pathway has been a target of oncology drug discovery [1, 2, 4].
Capivasertib, a potent, selective inhibitor of all AKT isoforms (AKT1/2/3) [5, 6], demonstrated efficacy in combination with fulvestrant for the treatment of hormone receptor (HR)-positive/human epidermal growth factor receptor 2 (HER2)-negative breast cancer and with paclitaxel for the treatment of triple-negative breast cancer (TNBC) in clinical phase 2 trials with an intermittent capivasertib dose regimen of 400 mg twice daily (BID) given 4 days on, 3 days off [4/3] [7, 8]. The [4/3] schedule of capivasertib administration has been used in all subsequent phase 3 trials. The phase 3 CAPItello-291 trial in patients with aromatase inhibitor-resistant, HR-positive/HER2-negative advanced breast cancer showed statistically significant and clinically meaningful improvement in progression-free survival in the overall population and in the population of patients with PIK3CA/AKT1/PTEN-altered tumors [9]. These data led to approval of capivasertib–fulvestrant in several markets [10–15] and the inclusion of the combination as a treatment option in clinical guidelines [16, 17].
Earlier on during clinical development, the first-in-human study of capivasertib explored a range of oral doses (80–800 mg BID) and schedules (continuous, intermittent [4/3], and intermittent 2 days on, 5 days off [2/5]) for capivasertib given as monotherapy to patients with solid tumors [18, 19]. The recommended phase 2 doses were determined at 320 mg BID, 480 mg BID, and 640 mg BID for the continuous, [4/3], and [2/5] schedules, respectively, and were primarily based on empirical evaluation of dose-limiting toxicities (DLTs). The DLTs were diarrhea, rash, and hyperglycemia [18, 19], which were broadly consistent with observations from studies of other AKT inhibitors (ipatasertib and MK2206) [20, 21] and other drugs affecting the PI3K/AKT pathway [22]. Based on the combination of tolerability, pharmacokinetic (PK), and pharmacodynamic considerations, capivasertib 480 mg BID [4/3] was selected as the recommended phase 2 dose for capivasertib monotherapy [18]. There was also evidence of greater target engagement in tumor tissue with 480 mg BID on a [4/3] schedule than with 320 mg continuous dosing [18], further supporting dose and schedule selection. Findings from phase 1/2 trials reinforced selection of a slightly lower dose of 400 mg BID [4/3] when capivasertib is used in combination with fulvestrant or paclitaxel [7, 8, 23–25].
The PK of capivasertib have been characterized in studies of patients with solid tumors [18, 19, 23, 26, 27], in healthy volunteer studies [28–30] and in a population PK (PopPK) analysis of pooled studies [31]. Capivasertib plasma exposure was approximately dose proportional in the dose range of 80–480 mg, with a half-life of approximately 8 h [31]. Capivasertib PK showed moderate between-subject variability, and no patient covariate (including race, gender, body weight, renal or hepatic function) was predicted to impact exposure to capivasertib by > 20% [31]. Therefore, no a priori dose adjustment is required for intrinsic patient factors [10].
Information collected from early phase clinical trials is used for initial assessment of drug safety profile over a wide dose range and estimation of a maximum tolerated dose. Uncertainty in safety evaluations, however, is a common problem in oncology drug development due to the small sample size and use of adaptive or complex study designs [32]. This may complicate the analysis of exposure–response for adverse events (AEs) and, therefore, the selection of the optimal therapeutic regimen for further clinical trials. In addition, interpretation of safety information generated in oncology trials is often confounded by differences in baseline patient characteristics, the between-subject variability of drug exposure, complex treatment schedules, toxicity-mediated dose reductions and extensive use of co-medications [32]. Multivariate exposure–safety analyses of individual patient data allow to delineate the impact of various factors on the observed safety profiles across clinical studies with different designs and various patient populations, guiding the selection of the therapeutic regimen for future trials. Such an approach was used for risk–benefit analyses of treatment with the AKT inhibitor ipatasertib in prostate cancer [33, 34], the programmed cell death ligand 1 antibody atezolizumab [35], the programmed cell death (PD-1) antibody nivolumab [36], and hypofractionated radiotherapy regimens [37], a model-based analysis was also applied to evaluate factors affecting the probability of immune-related AEs associated with the PD-1 antibody pembrolizumab [38].
The aim of the analysis reported here was to evaluate exposure–response relationships for the following safety endpoints of capivasertib when given as monotherapy to patients with solid tumors: AE leading to dose discontinuation, AE leading to dose modification (interruption and/or reduction), serious AE (SAE), AE grade ≥ 3, AE grade ≥ 1, diarrhea AE grade ≥ 2, rash AE grade ≥ 2, hyperglycemia AE grade ≥ 3 and increased blood glucose > 13.9 mmol/L, based on pooled data from three phase 1 clinical trials.
Methods
Experimental data
Safety data from 277 patients participating in three trials of capivasertib given as monotherapy were included in the analysis (Supplementary Table 1).
Study 1 (NCT01226316) was a phase 1 open-label multipart study. Parts A and B were dose-escalation and dose-expansion parts, respectively, to assess tolerability of capivasertib in patients with advanced solid malignancies; parts C and D were expansion cohorts of patients with PIK3CA-mutated breast or gynecologic cancers or AKT1-mutated breast or gynecologic cancers or other solid tumors to assess safety and efficacy of the selected dosing regimen [18, 25, 39]. The duration of the treatment cycles was 21 days. For parts A and B, the treatment was started with a single capivasertib administration, followed by a 3- to 7-day washout (Cycle 0). Patients received capivasertib 80–800 mg BID on a continuous or intermittent schedule [4/3] and [2/5] [18]. For parts C and D, capivasertib monotherapy was given at 480 mg [4/3] [18, 25, 39]. Part D also included patients receiving capivasertib in combination with fulvestrant [25], but only patients receiving capivasertib as monotherapy have been included in the present analysis.
Study 4 (NCT01353781) was a phase 1 dose-escalation study in Japanese patients with advanced solid malignancies [19]. The treatment was started with single capivasertib administration, followed by a 3- to 7-day washout (Cycle 0); duration of subsequent cycles was 21 days. Patients received capivasertib 80–640 mg BID on a continuous or intermittent schedule [4/3] and [2/5].
The OAK study (NCT01895946) was a phase 1 open-label study aimed to compare tablet and capsule capivasertib formulations and to explore the impact of food intake on drug exposure [26]. Patients received 480 mg capivasertib BID on an intermittent schedule [4/3].
Dose and systemic exposure calculations
Blood samples for characterizing capivasertib PK were collected and analyzed using a PopPK approach [31], which was used to project the individual exposure metrics. The exposure–response analyses were conducted using a subset of patients from the PopPK analysis where capivasertib was used as monotherapy. The capivasertib dose, planned weekly dose (PWD), area under the curve (AUC) at steady-state (SS), AUC based on planned weekly dose (AUC_PWD_) at SS, maximum concentration (C_max_) at SS and minimum concentration (C_min_) at SS were selected as the exposure metrics for the exposure–response analyses. As different schedules were assessed between and within studies, the exposure metrics were derived for the last dose of the last dosing day in the second week of treatment (i.e. on days 14, 11, and 9 for the continuous, [4/3] and [2/5] schedules, respectively), to ensure SS conditions, using the planned dose. C_max_ was the maximum concentration, C_min_ was the 12 h post-dose concentration and AUC was calculated from dose/apparent clearance (CL/F). The relative dose intensity (RDI) was calculated as the percentage of the average weekly dose relative to the PWD to examine the tolerability of capivasertib monotherapy at the given dosing schedules.
Safety endpoints
AEs were collected throughout the trials, graded using Common Terminology Criteria for Adverse Events v4. Treatment-emergent AEs (TEAEs), defined as any AE that started after the first dose of study treatment or that started prior to dosing and worsened during on treatment period (by investigator report of a change in intensity) following exposure to treatment, were included in the analysis.
The following safety endpoints were evaluated: AE leading to dose discontinuation, AE leading to dose modification (interruption and/or reduction), SAE, AE grade ≥ 3, AE grade ≥ 1, diarrhea AE grade ≥ 2, rash AE grade ≥ 2, hyperglycemia AE grade ≥ 3 and increased blood glucose > 13.9 mmol/L. An SAE was defined as any AE that resulted in death, was life-threatening, required inpatient hospitalization or prolongation of existing hospitalization, or resulted in a significant, persistent or permanent disability, or a congenital anomaly or birth defect in any subsequent children. Increased blood glucose was defined as > 13.9 mmol/L based on the Common Terminology Criteria for Adverse Events version 4 (CTCAE v4) criteria for grade 3 hyperglycemia used in the studies included in this analysis. These analyses were confined to hyperglycemia AE grade ≥ 3 and were not designed to assess the use of comedications during the treatment, such as hypoglycemic agents. The absolute value or percentage change to blood glucose were not included in the analyses. The rash AE endpoint pooled the following Medical Dictionary for Regulatory Activities (MedDRA) preferred terms: rash maculo-papular, rash macular, rash, rash generalized, rash papular and rash pruritic, while the diarrhea AE and hyperglycemia AE included the MedDRA preferred terms diarrhea and hyperglycemia, respectively.
The grade selection for diarrhea and rash was based on clinical relevance in terms of limiting quality of life; for hyperglycemia the grade was higher considering this is a pharmacodynamic effect of AKT inhibition and often seen as asymptomatic change of laboratory value only.
Exposure–response analysis
Logistic regression models were used to establish associations between the probability of the safety endpoints with the exposure metrics at a statistically significant level of 0.005.
Software
Dataset preparation was performed using Statistical Analysis Software (SAS^®^) version 9.4 (SAS Institute, NC, USA) and R Project for Statistical Computing, Version 4.0.2 (Comprehensive R Archive Network, http://cran.r-project.org) according to the data specifications. The analysis was performed using NONMEM Version 7.3.0 (ICON, Ellicot City, MD, USA), entimICE version 4.4 (Entimo AG, Berlin, Germany) and R Project for Statistical Computing.
Results
Patient characteristics and planned Capivasertib dose
Patient baseline characteristics are described in Table 1. Overall, the dataset comprised 277 subjects; 67.5% were females and 76.9% identified as White. The median (range) for weight was 70 (32–129) kg and 76.2% of the patients were < 65 years of age. All patients had advanced solid tumors and were classified as either 0 or 1 for WHO performance status. Primary tumor sites included breast, lung, cervix, uterus, pleura, ovary, liver, colorectal, or colon [18, 19, 26].
Table 1. Baseline patient characteristicsCharacteristicStudy 1(N = 206)Study 4(N = 41)OAK(N = 30)Total(N = 277)Age, years; n (%)≥ 65< 6552 (25.2)154 (74.8)4 (9.8)37 (90.2)10 (33.3)20 (66.7)66 (23.8)211 (76.2)Sex; n (%)FemaleMale148 (71.8)58 (28.2)24 (58.5)17 (41.5)15 (50.0)15 (50.0)187 (67.5)90 (32.5)RaceWhiteAsian Japanese Other AsianBlackOtherMissing185 (89.8)9 (4.4)3 (1.5)6 (2.9)5 (2.4)5 (2.4)2 (1.0)041 (100)41 (100)000028 (93.3)0001 (3.3)1 (3.3)0213 (76.9)50 (18.1)44 (15.9)6 (2.2)6 (2.2)6 (2.2)2 (0.7)Body weight, kg; median (range)72(32–129)57(40–97)78(53–115)70(32–129)Hepatic functionNormal150 (72.8)32 (78.0)22 (73.3)204 (73.6)Mild impairment53 (25.7)9 (22.0)8 (26.7)70 (25.3)Moderate impairment3 (1.5)0 (0.0)0 (0.0)3 (1.1)Renal functionNormal119 (57.8)28 (68.3)20 (66.7)167 (60.3)Mild impairment70 (34.0)9 (22.0)10 (33.3)89 (32.1)Moderate impairment17 (8.3)4 (9.8)0 (0.0)21 (7.6)Blood glucose, mmol/L; median (range)5.3(3.7–8.1)5.2(4.6–7.2)5.4(3.7–6.5)5.3(3.7–8.1)^a^HbA1c, mmol/mol; median (range)37.0(25.0–49.0)46.0(35.0–56.0)36.0(24.0–49.0)37.0(24.0–56.0)^b^HbA1c, glycated hemoglobin^a^Missing: 9 patients (3.2%); ^b^Missing: 49 patients (17.7%)
Capivasertib was administered as monotherapy at 80–800 mg BID, where 480 mg BID was the most common dose level (61.0% of patients; Supplementary Table 2), as it was the selected recommended phase 2 dose (given [4/3]) in the expansion phases of the dose-escalation studies and for the formulation/food study. The recommended doses of 320 mg for the continuous and 640 mg BID for the [2/5] schedule were less frequently used (6.5% and 8.7% of patients, respectively; Supplementary Table 2).
Summary of exposure metrics and safety endpoints
The summary of the exposure metrics and safety endpoints by schedule and dose level are given in Tables 2 and 3, respectively.
The RDI was predominantly decreased with increasing dose for the continuous schedule and was ≤ 80% for the 400 and 480 mg doses. On the other hand, the RDI was > 90% for the [4/3] and [2/5] schedules at all dose levels, suggesting better tolerability with the intermittent schedules in patients enrolled in these early-phase studies (Table 2). In total, across all doses and schedules, 18.4% of patients had AEs leading to dose discontinuation, 50.2% AEs leading to dose modification, 38.6% SAEs, 65.7% AEs grade ≥ 3, 98.9% AE grade ≥ 1, 36.8% diarrhea AE grade ≥ 2, 26.4% rash AE grade ≥ 2, 26.0% hyperglycemia grade ≥ 3, and 45.5% increased blood glucose > 13.9 mmol/L (Table 3).
Table 2. Summary of exposure metrics by study, schedule, and dose levelStudyScheduleDose (mg)PWD (mg) N Exposure metrics; median (range)RDI (%)AUC_ss(0–12 h)_ (mg∙h/L)AUC_PWD_ (mg∙h/L)C_max_ (mg/L)C_min_ (mg/L)Study 1Continuous8011205100.0 (95.9–100.6)0.87 (0.69–1.70)12.16 (9.71–23.78)0.15 (0.13–0.26)0.03 (0.02–0.09)1602240597.6 (83.5–102.3)2.99 (1.94–4.80)41.79 (27.09–67.27)0.42 (0.37–0.83)0.11 (0.07–0.19)24033606100.3 (98.8–100.9)3.19 (2.15–4.68)44.70 (30.11–65.50)0.53 (0.31–0.97)0.11 (0.08–0.16)32044801298.1 (37.2–102.4)5.86 (3.51–10.74)82.01 (49.12–150.34)0.87 (0.58–1.62)0.20 (0.10–0.38)40056001180.3 (55.4–102.1)5.79 (4.28–13.70)81.04 (59.96–191.78)0.90 (0.52–2.26)0.19 (0.14–0.55)4806720650.2 (45.3–83.3)9.98 (7.24–18.06)139.62 (101.36–252.63)1.62 (1.12–2.33)0.37 (0.16–0.77)60084002103.1 (100–106.2)14.27 (12.74–15.79)199.70 (178.34–221.05)2.52 (2.04–3.00)0.46 (0.43–0.50)[4/3]480384012797.9 (26.4–138.9)9.69 (3.97–26.5)77.42 (31.74–212.16)1.59 (0.60–3.91)0.33 (0.11–1.07)640512010100.0 (70.5–122.2)15.92 (9.62–28.95)127.41 (76.99–231.67)2.43 (1.41–5.27)0.55 (0.24–1.30)[2/5]6402560894.0 (80.9–109.1)14.96 (8.18–26.83)59.82 (32.70–107.11)2.08 (1.35–3.90)0.57 (0.28–0.95)800320014101.1 (42.5–133.3)26.44 (11.83–70.78)105.81 (47.34–283.19)3.93 (2.34–5.60)1.08 (0.38–3.61)Study 4Continuous8011203100.0 (88.7–102.3)1.48 (1.17–2.40)20.74 (16.33–33.63)0.22 (0.14–0.49)0.06 (0.05–0.08)24033607100.0 (41.9–106.7)5.22 (2.71–10.71)73.04 (37.97–150.00)0.82 (0.56–1.67)0.17 (0.08–0.46)3204480691.5 (59.3–101.1)6.56 (4.15–28.42)91.79 (58.03–396.46)1.38 (0.74–3.99)0.15 (0.12–1.40)4005600572.1 (51.4–85.7)7.75 (6.91–13.91)108.53 (96.72–194.44)1.24 (1.06–2.35)0.27 (0.21–0.55)[4/3]36028808107.9 (91.4–112)6.10 (3.95–11.18)48.80 (31.58–89.44)0.96 (0.53–1.84)0.21 (0.10–0.47)48038406107.9 (79.1–108.6)10.85 (7.97–12.05)86.78 (63.79–96.48)1.88 (1.55–2.78)0.29 (0.19–0.42)[2/5]64025606111.2 (100–119)15.24 (13.39–34.02)60.97 (53.56–136.17)2.48 (1.61–3.40)0.57 (0.40–1.65)OAK[4/3]480384030100 (45.6–115.4)9.75 (4.43–26.60)77.97 (35.49–213.33)1.58 (0.90–4.63)0.33 (0.12–1.51)AUC_ss(0–12 h), area under the curve during a dose interval (0–12 h) at steady-state; AUC_PWD, area under the curve based on planned weekly dose; C_max_, maximum plasma concentration; C_min_, minimum plasma concentration; PWD, planned weekly dose; RDI, relative dose intensity
Table 3. Summary of safety endpoints by dosing schedule and dose levelScheduleDose (mg) N Safety endpoint; n (%)AEDDAEDMAE grade ≥ 1AE grade ≥ 3Diarrhea AE grade ≥ 2Increased BG > 13.9 mmol/LHyperglycemia AE grade ≥ 3Rash AE grade ≥ 2SAEContinuous80802 (25.0)8 (100)2 (25.0)0001 (12.5)2 (25.0)160501 (20.0)5 (100)00001 (20.0)1 (20.0)240131 (7.7)2 (15.4)12 (92.3)4 (30.8)4 (30.8)4 (30.8)2 (15.4)3 (23.1)0320183 (16.7)8 (44.4)18 (100)10 (55.6)5 (27.8)3 (16.7)2 (11.1)5 (27.8)4 (22.2)400167 (43.8)15 (93.8)16 (100)15 (93.8)10 (62.5)7 (43.8)4 (25.0)8 (50.0)6 (37.5)48064 (66.7)5 (83.3)6 (100)6 (100)5 (83.3)2 (33.3)2 (33.3)3 (50.0)6 (100)60022 (100)1 (50.0)2 (100)2 (100)1 (50.0)1 (50.0)02 (100)2 (100)[4/3]360803 (37.5)6 (75.0)3 (37.5)4 (50.0)3 (37.5)1 (12.5)1 (12.5)048016327 (16.6)90 (55.2)163 (100)114 (69.9)64 (39.3)82 (50.3)45 (27.6)45 (27.6)68 (41.7)640104 (40)2 (20.0)10 (100)7 (70.0)3 (30.0)7 (70.0)4 (40.0)06 (60.0)[2/5]640142 (14.3)2 (14.3)14 (100)11 (78.6)3 (21.4)8 (57.1)7 (50.0)2 (14.3)7 (50.0)800141 (7.1)8 (57.1)14 (100)8 (57.1)3 (21.4)9 (64.3)5 (35.7)2 (14.3)5 (35.7)Total27751 (18.4)139 (50.2)274 (98.9)182 (65.7)102 (36.8)126 (45.5)72 (26.0)73 (26.4)107 (38.6)AE, adverse event; AEDD, adverse event leading to dose discontinuation; AEDM, adverse event leading to dose modification (interruption and/or reduction); BG, blood glucose; SAE, serious AE
Exposure–response relationships
Detailed exposure–response analysis was carried out to identify statistically significant relationships between exposure metrics and safety endpoints (Supplementary Fig. 1). No significant relationships were observed for AE grade ≥ 1. Significant relationships for the remaining safety endpoints are summarized below. The exposure metric that showed the most significant (lowest p-value) association with each safety endpoint (by univariate logistic regression) are highlighted below in bold:
- AE leading to dose discontinuation: PWD.
- AE leading to dose modification: PWD, AUC, AUCPWD, C_max_, and C_min_.
- AE grade ≥ 3: dose, PWD, AUC, AUCPWD, C_max_, and C_min_.
- SAE: dose, PWD, AUC, AUCPWD, C_max_, and C_min_.
- Hyperglycemia AE grade ≥ 3: dose, AUC, AUC_PWD_, C_max_, and C_min_.
- Increased blood glucose > 13.9 mmol/L: dose, AUC, AUC_PWD_, Cmax, and C_min_.
- Diarrhea AE grade ≥ 2: PWD, AUCPWD.
- Rash AE grade ≥ 2: PWD.
Hence, the total weekly exposure constituted the main driver for most safety endpoints (Fig. 1A), whereas hyperglycemia and increased blood glucose were primarily driven by the exposure achieved within the 12 h dosing interval (Fig. 1B).
At a given dose, there was a statistically significant effect of schedule for AE leading to dose discontinuation, AE leading to dose modification, and diarrhea AE grade ≥ 2 with intermittent schedules associated with lower probability of events compared with the continuous schedule, whereas the probabilities of hyperglycemia AE grade ≥ 3 and increased blood glucose > 13.9 mmol/L did not depend on the schedule (Fig. 2A). However, at a given weekly dose, the effect of schedule was statistically significant for hyperglycemia AE grade ≥ 3 and increased blood glucose > 13.9 mmol/L only, with intermittent schedules associated with higher probability of events compared with the continuous schedule; the [2/5] schedule was inferior, i.e. associated with higher probability of events, to the [4/3] schedule (Fig. 2B). Given the higher weekly dose on the 320 mg continuous schedule (4480 mg) compared with the intermittent schedule [4/3] at 480 mg (3840 mg), the probability of hyperglycemia AE grade ≥ 3 and increased blood glucose > 13.9 mmol/L is not expected to be significant between the continuous and intermittent 480 mg [4/3] schedules.
Fig. 1. Relationship between exposure metrics and probability of event by (A) weekly dose and AUC_PWD_ and (B) Dose, AUC, and C_max_. Dots and solid black vertical lines: quartile of exposure metric with 95% CI; gray horizontal lines and dark gray areas: exposure–response relationship with 95% CI; solid and slashed gray vertical lines: 2.5th, 50th, and 97.5th percentiles of exposure metric at 480 mg [4/3]; light gray area: 95% prediction interval of exposure metric at 480 mg [4/3]; p-value represents the significance level of the exposure metric. AUC, area under the curve; AUC_PWD_, area under the curve based on planned weekly dose; AE, adverse event; AEDD, adverse event leading to dose discontinuation; AEDM, adverse event leading to dose modification (interruption and/or reduction); CI, confidence interval; C_max_, maximum plasma concentration; G, grade; SAE, serious adverse event
Fig. 2. Relationship, according to administration schedule, between dose and probability of event by (A) dose and (B) weekly dose. Dots and vertical lines: quartile of exposure metric with 95% CI; horizontal lines and colored areas: exposure–response relationship with 95% CI; p-value represents the significance level of the schedule. AE, adverse event; AEDD, adverse event leading to dose discontinuation; AEDM, adverse event leading to dose modification (interruption and/or reduction); AEGE3, adverse event grade ≥ 3; CI, confidence interval; SAE, serious adverse event
Discussion
This safety analysis has characterized the exposure–response relationships for capivasertib monotherapy for AE leading to dose discontinuation, AE leading to dose modification, SAE, AE grade ≥ 3, diarrhea AE grade ≥ 2, rash AE grade ≥ 2, hyperglycemia AE grade ≥ 3, and increased blood glucose > 13.9 mmol/L with several exposure metrics. We focused on diarrhea, rash, and hyperglycemia in terms of AEs of special interest, as all three were DLTs as well as the most common AEs grade ≥ 3 in the first-in-human study of capivasertib (hyperglycemia was the most common, followed by diarrhea and then, maculopapular rash) [18]. The exposure–response models were able to establish relationships for all safety endpoints evaluated based on linear logistic regressions, except for AE grade ≥ 1, which occurred in almost all patients.
The exposure metrics were projected using the planned starting dose and proved to be adequate predictors for the incidence of the safety endpoints. Although other approaches, such as using the average exposure metric until the time of event, were considered, estimating different exposure metrics for each safety endpoint would complicate the subsequent interpretation as this may have led to biased analyses. Instead, the current analysis employed exposure metrics at SS, which are recommended as they do not depend on the outcome [40].
Hyperglycemia AE of grade ≥ 3 and increased blood glucose (> 13.9 mmol/L) were influenced by capivasertib exposure during a dosing interval, showing a stronger correlation with dose, AUC, and C_max_ than with the weekly exposure. Conversely, all other safety endpoints were predominantly associated with cumulative capivasertib exposure, demonstrating a stronger correlation with weekly dose and/or AUC_PWD_. Consequently, the likelihood of AE leading to dose discontinuation, AE leading to dose modification, SAE, AE of grade ≥ 3, diarrhea of grade ≥ 2, and rash of grade ≥ 2 is predicted to be lower with the [4/3] intermittent schedule compared with the continuous schedule at a given dose. However, the probability of hyperglycemia AE of grade ≥ 3 and increased blood glucose > 13.9 mmol/L is predicted to increase with the dose, regardless of the dosing schedule. While hyperglycemia is a known pharmacodynamic effect of AKT inhibition and often seen as asymptomatic change to blood glucose, oral hypoglycemic drugs are indicated in the clinical management of hyperglycemia AE grade ≥ 2. Use of metformin was explored at baseline, but usage was too low in the study population to allow meaningful inferences about combination therapy of capivasertib with hypoglycemic agents.
The probability of rash AE grade ≥ 2, AE leading to dose discontinuation, AE leading to dose modification, AE grade ≥ 3, SAE and diarrhea AE grade ≥ 2 was higher with the continuous schedule at 320 mg (4480 mg weekly) compared with the intermittent schedule [4/3] at 480 mg (3840 mg weekly) due to the lower total weekly exposure, while the [2/5] schedule at 640 mg presented higher probability of hyperglycemia AE grade ≥ 3 and increased blood glucose > 13.9 mmol/L than the [4/3] schedule at 480 mg. Therefore, our results further reinforce the selection of 480 mg BID on a [4/3] schedule as a recommended monotherapy dose based on safety outcomes.
Conclusion
In patients with solid tumors who were administered capivasertib as monotherapy, significant relationships were identified between the total weekly exposure (weekly dose and AUC_PWD_) and the probability of experiencing AE leading to dose discontinuation, AE leading to dose modification (interruption and/or reduction), SAE, AE grade ≥ 3, diarrhea AE grade ≥ 2, and rash AE grade ≥ 2. The probabilities of experiencing hyperglycemia AE grade ≥ 3 and increased blood glucose > 13.9 mmol/L were more closely related to the exposure during a dosing interval (dose, AUC, and C_max_).
Overall, the analyses suggest that the 4/3 intermittent schedule was better tolerated, except for hyperglycemia AE grade ≥ 3 and increased blood glucose > 13.9 mmol/L events, compared with a continuous schedule due to the generally lower total weekly exposure.
Electronic supplementary material
Below is the link to the electronic supplementary material.
Supplementary Material 1
Supplementary Material 2
The reference list from the paper itself. Each links out to its DOI / PubMed record.
- 1Astra Zeneca Pharmaceuticals LP (2023) Highlights of prescribing information. TRUQAP™ (capivasertib) tablets, for oral use. https://www.accessdata.fda.gov/drugsatfda_docs/label/2023/218197 s 000lbl.pdf. Accessed December 18, 2024
- 2European Commission (2024) Union Register of medicinal products for human use. Truqap. https://ec.europa.eu/health/documents/community-register/html/h 1820.htm. Accessed 2 September, 2024
- 3Astra Zeneca Canada Inc (2024) Product monograph. Truqap, capivasertib tablets. https://pdf.hres.ca/dpd_pm/00074395.PDF. Accessed 2 September, 2024
- 4Astra Zeneca AG (2024) Truqap, Filmtabletten. 2024. https://www.swissmedicinfo.ch/View Monographie. Accessed 2 September, 2024
- 5Pharmaceuticals and Medical Devices Agency (2024) New Drugs Approved in FY 2023. https://www.pmda.go.jp/files/000269225.pdf. Accessed 2 September, 2024