Identification of biomarkers associated with programmed cell death in liver ischemia–reperfusion injury: insights from machine learning frameworks and molecular docking in multiple cohorts
Jifeng Liu, Yeheng Jin, Fengchen Lv, Yao Yang, Junchen Li, Yunshu Zhang, Lei Zhong, Wei Liu

TL;DR
This study uses machine learning and molecular docking to identify biomarkers and potential treatments for liver injury caused by ischemia-reperfusion.
Contribution
The study introduces a novel combination of machine learning and molecular docking to identify PCD-related biomarkers and therapeutic agents for liver ischemia-reperfusion injury.
Findings
Forty-seven PCD-related genes were identified in liver ischemia-reperfusion injury.
Eleven model genes were selected using machine learning with strong diagnostic value across six cohorts.
MYC was identified as a key PCD-related target, and two potential drugs (BMS-536924 and PF-431396) were suggested for treatment.
Abstract
Liver ischemia-reperfusion injury (LIRI) is a major reason for liver injury that occurs during surgical procedures such as hepatectomy and liver transplantation and is a major cause of graft dysfunction after transplantation. Programmed cell death (PCD) has been found to correlate with the degree of LIRI injury and plays an important role in the treatment of LIRI. We aim to comprehensively explore the expression patterns and mechanism of action of PCD-related genes in LIRI and to find novel molecular targets for early prevention and treatment of LIRI. We first compared the expression profiles, immune profiles, and biological function profiles of LIRI and control samples. Then, the potential mechanisms of PCD-related differentially expressed genes in LIRI were explored by functional enrichment analysis. The hub genes for LIRI were further screened by applying multiple machine learning…
Genes, proteins, chemicals, diseases, species, mutations and cell lines named across the full text — each resolved to its canonical identifier and authoritative record.
Click any figure to enlarge with its caption.
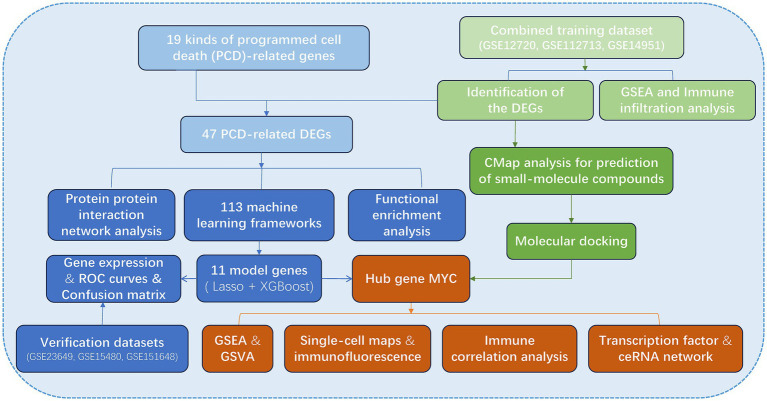 Figure 1
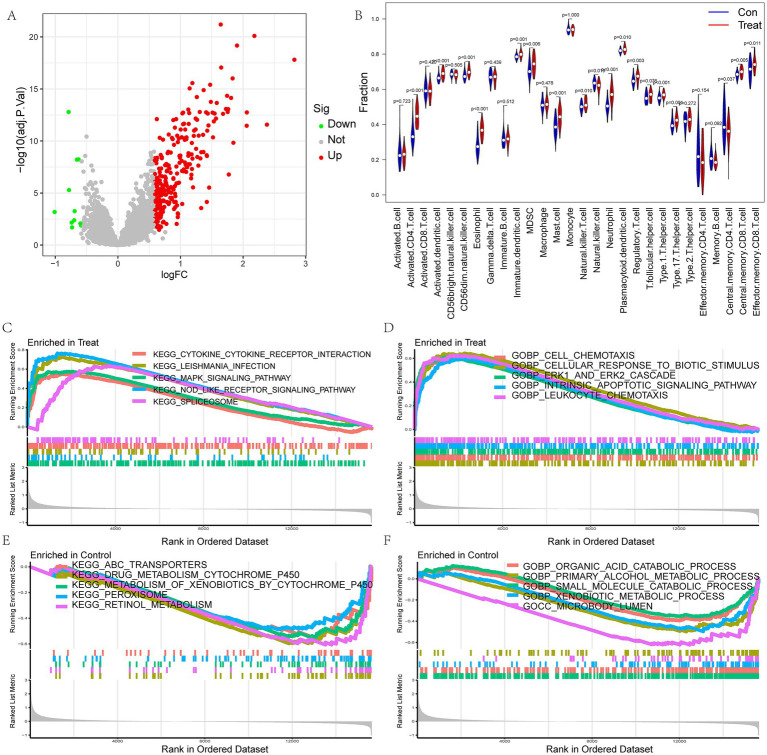 Figure 2
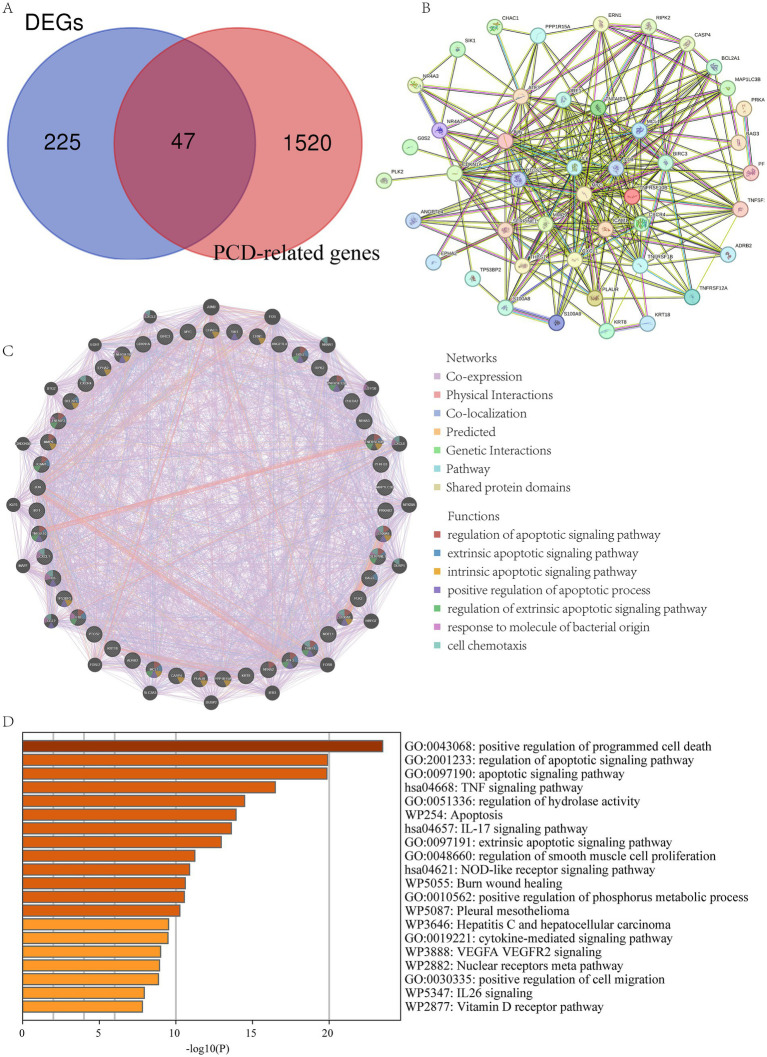 Figure 3
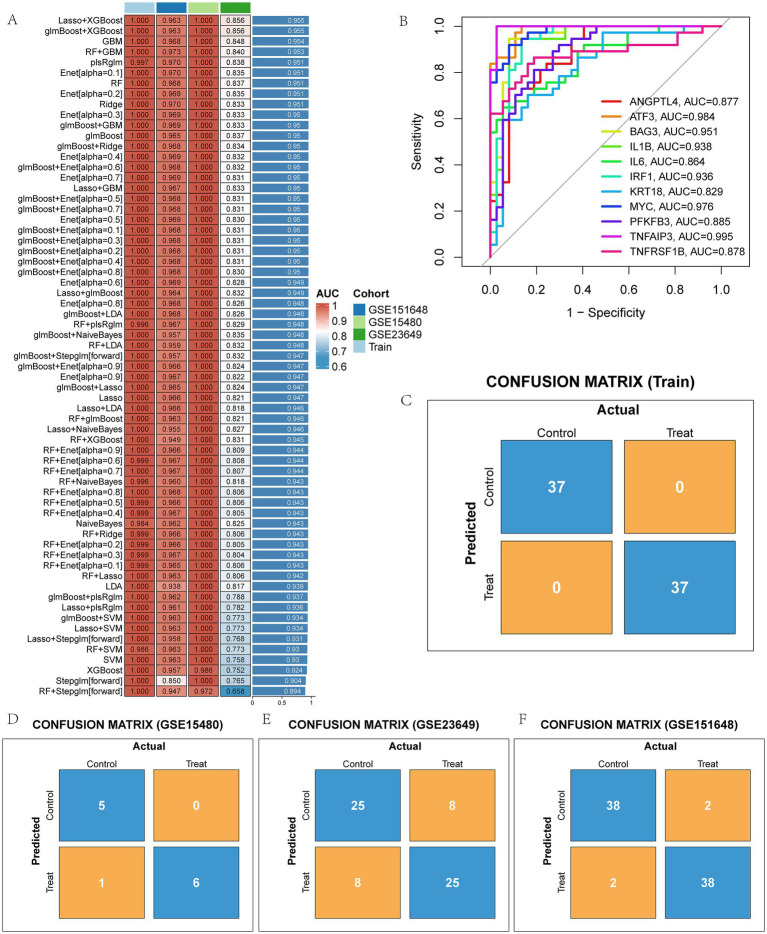 Figure 4
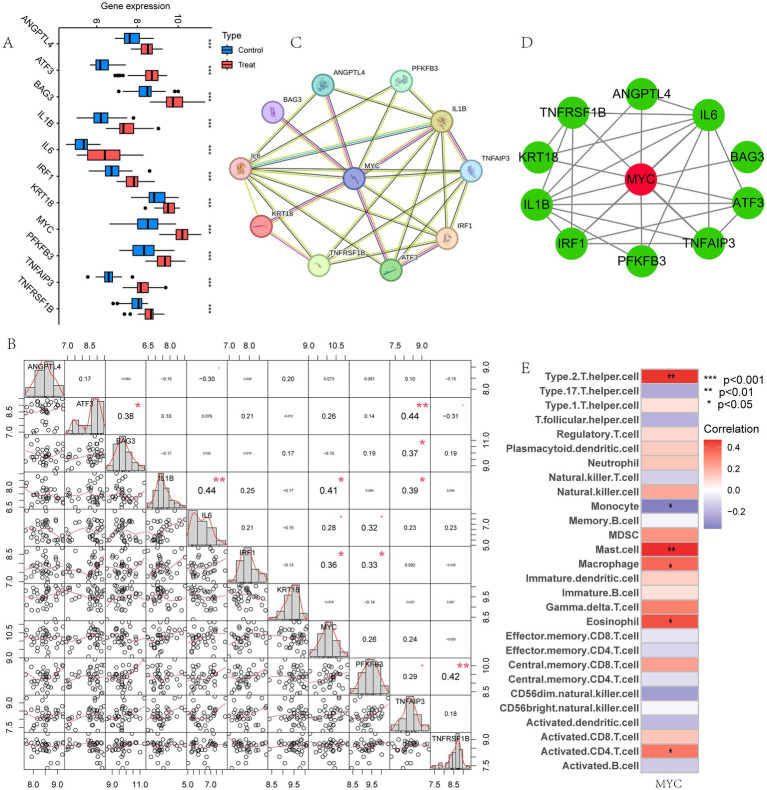 Figure 5
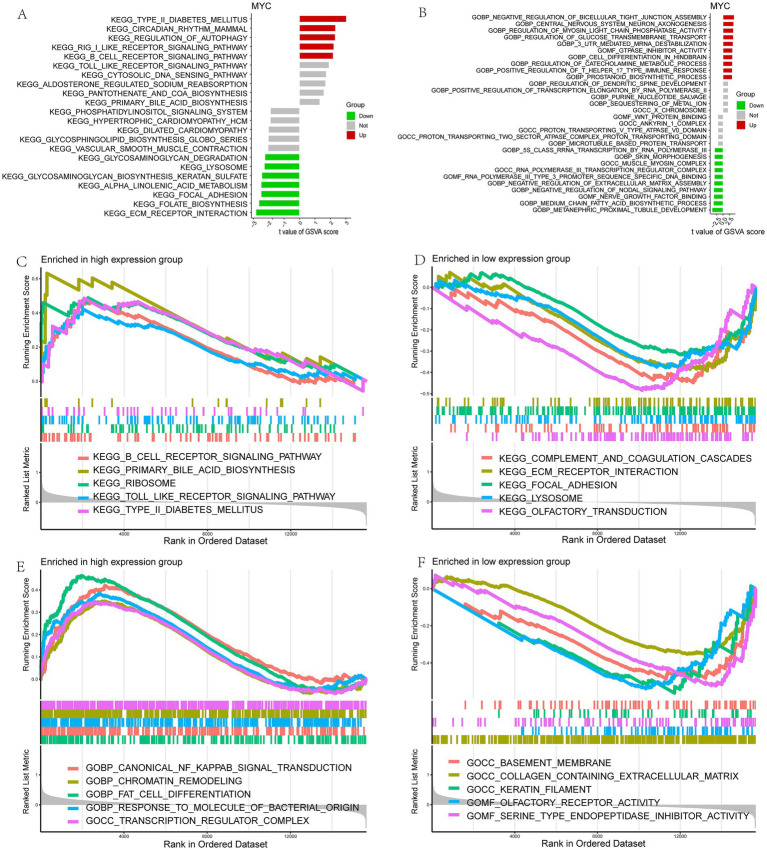 Figure 6
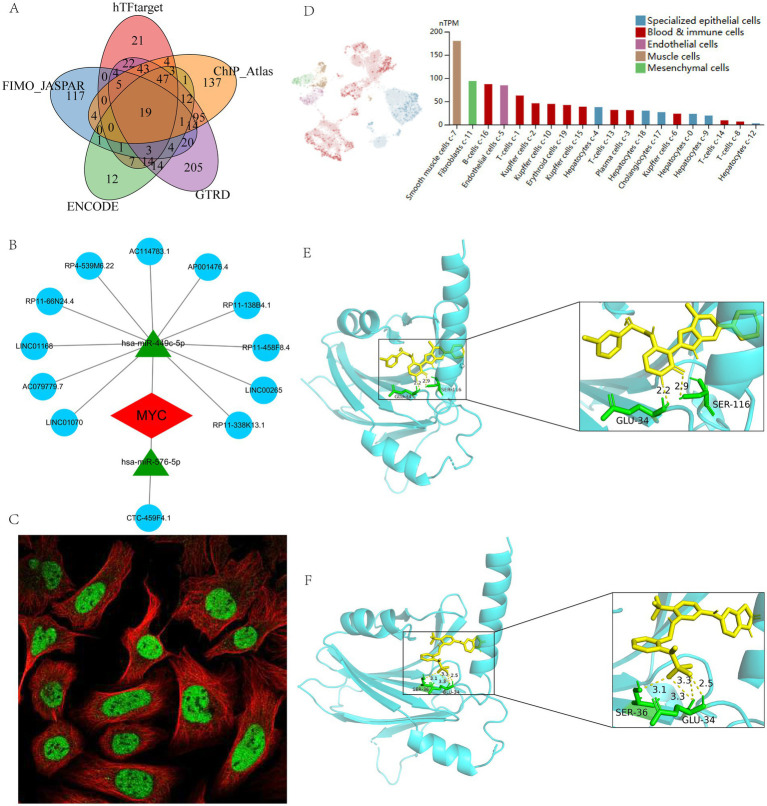 Figure 7
| pert_iname | moa | target_name | raw_cs | fdr_q_nlog10 | norm_cs | Free binding energy (kcal/mol) |
|---|---|---|---|---|---|---|
| Alvocidib | CDK inhibitor | CDK2|CDK4|CDK1|CDK6|CDK7|CDK9|CDK5|CDK8|EGFR|PYGM|BCL2|BIRC5|CCNT1|MCL1|XIAP | −0.79 | 15.6536 | −2.9083 | −8.7 |
| TWS-119 | GSK inhibitor | GSK3B|JUN|MYC | −0.707 | 15.6536 | −2.603 | −9.1 |
| Lapatinib | EGFR inhibitor|ERBB2 inhibitor | EGFR|ERBB2|CYP3A5 | −0.6816 | 15.6536 | −2.5093 | −9.1 |
| PF-431396 | Focal adhesion kinase inhibitor | PTK2|PTK2B | −0.6809 | 15.6536 | −2.5069 | −9.4 |
| BMS-536924 | IGF-1 inhibitor | IGF1R|INSR|AKT1|CCNE1|CDK2|CYP3A4|ERBB2|KDR|LCK|MAPK1|MET|PDGFRA|PDGFRB | −0.6756 | 15.6536 | −2.4874 | −9.8 |
| U-0126 | MEK inhibitor | MAP2K1|MAP2K2|JAK2|AKT1|CHEK1|GSK3B|LCK|MAP2K7|MAPK1|MAPK11|MAPK12|MAPK14|MAPK8|PRKCA|RAF1|ROCK1|RPS6KB1|SGK1 | −0.6751 | 15.6536 | −2.4854 | −7.6 |
| Selumetinib | MEK inhibitor | MAP2K1|MAP2K2 | −0.674 | 15.6536 | −2.4814 | −8.2 |
| ER-27319 | Syk inhibitor | SYK | −0.6708 | 15.6536 | −2.4695 | −8.0 |
| WZ-3146 | EGFR inhibitor | EGFR | −0.6683 | 15.6536 | −2.4603 | −9.1 |
| A-443654 | AKT inhibitor | AKT1|AKT2 | −0.6499 | 15.6536 | −2.3925 | −8.8 |
Peer Reviews
No public reviews on file for this paper yet. If you reviewed it on a platform where reviews are public (OpenReview, ICLR, NeurIPS, ICML), you can paste yours below so the community can read it here.
Videos
No videos yet. Explain this paper in a talk, walkthrough, or lecture? Add one.
Taxonomy
TopicsLiver Disease Diagnosis and Treatment · MicroRNA in disease regulation · Mitochondrial Function and Pathology
Introduction
1
Liver ischemia–reperfusion injury (LIRI) is a major reason for liver injury in surgical procedures such as hepatectomy and liver transplantation (LT) (1). LIRI involves two phases: localized ischemic injury and reperfusion injury, which are interrelated (2). In addition, LIRI can be categorized into warm LIRI and cold LIRI. Warm LIRI occurs in cases of transplantation, trauma, shock, and elective liver surgery, where the liver blood supply is temporarily interrupted. Cold LIRI occurs during the organ preservation period prior to transplantation. Several factors contribute to LIRI, including activation of Kupffer cells, oxidative stress, and upregulation of pro-inflammatory cytokine signaling (3). LIRI involves a wide range of cellular and biochemical processes, including dysregulation of the normal phenotype of every liver cellular component (1). However, a large proportion of these processes remain unknown or unclear. LIRI is an unavoidable process in LT, which may not only lead to early graft dysfunction and chronic rejection but also increase the risk of liver tumor recurrence and fibrosis (4–6). Despite considerable efforts in therapeutic strategies for LIRI, prevention is the primary strategy for reducing LIRI (7). Therefore, it is imperative to investigate novel molecular mechanisms and key targets for LIRI.
Programmed cell death (PCD), also known as regulated cell death, is a specified form of cell death that could be controlled by different biomolecules (8). PCD is crucial for preserving tissue homeostasis and getting rid of unhealthy or superfluous cells. It has become a crucial disorder phenotype and has received a lot of attention in many disorders (9–11). Numerous studies have indicated that cell death is the main potential mechanism of LIRI (1, 12). In the past decades, it was believed that necrosis and apoptosis occurred mainly in LIRI (13). Numerous novel forms of PCD, like ferroptosis, cuproptosis, disulfidptosis, and pyroptosis, have been identified in recent years. LIRI can initiate a variety of cellular processes that are related to multiple types of PCD (14). For example, it was found that the iron death marker Ptgs2 was significantly upregulated in the mouse LIRI model (15). Meanwhile, chronic exposure to excess Cu leads to an increase in ROS and promotes apoptosis in mouse liver (16). It was also found that pyroptosis and NLRP3 targeting can reduce LIRI (17). In addition, PCD is strongly correlated with the severity of LIRI injury, which also implies that PCD has an important role in the treatment of LIRI (14). However, how to effectively inhibit PCD and reduce the cascade of cell death in LIRI remains a challenge, and a deeper understanding of these cell death patterns is needed to identify more precise targets and therapeutic agents.
Recently, the emergence of bioinformatics, machine learning, and molecular docking technologies has accelerated the processing and analysis of large-scale data to efficiently identify hub molecules and potential therapeutic agents of diseases (18, 19). The study will utilize bioinformatics, machine learning and molecular docking techniques to comprehensively explore the expression and mechanism of PCD-related genes in LIRI and provide a theoretical basis for future studies of PCD in LIRI.
Methods
2
Data collection
2.1
The datasets analyzed in this study were downloaded from the GEO database. The GSE12720 (20) contains 21 preoperative samples and 21 post reperfusion samples, GSE112713 (21) contains 11 preoperative samples and 11 post reperfusion samples, and GSE14951 (22) contains 5 preoperative samples and 5 post reperfusion samples. They were merged as a training set by the “ComBat” function from “sva” package (23). Principal component analysis (PCA) was performed to verify the batch effect before and after the data operation. PCA is a method of data dimensionality reduction, which extracts the feature vectors (components) of data from high latitude data, converts them into low dimensional data, and displays these features using two-dimensional or three-dimensional graphs. The GSE23649 (33 LIRI and 33 control samples), GSE15480 (6 LIRI and 6 control samples), and GSE151648 (24) (40 LIRI and 40 control samples) datasets were used as validation sets for subsequent biomarker validation.
The PCD-related genes were carefully hand-curated from a variety of reliable sources, such as the KEGG database, the MSigDB database, review articles, and manual curation (8, 25–29). A total of 1,567 genes associated with 19 types of PCD were eventually included, as shown in Supplementary Table S1.
Analysis of differences between LIRI and normal samples
2.2
Using the “limma” software, the criteria for detecting differentially expressed genes (DEGs) between LIRI and normal samples were set to |log2 fold change (FC)| > 0.585 and adjust p < 0.05 (18). The expression differences for LIRI were visualized by a volcano plot using the “ggplot2” package in R and a heatmap using the “pheatmap” package in R. The proportions of various immune cell types were evaluated using ssGSEA from the “GSVA” package in order to compare the differences in immunity status between groups (30). Gene Set Enrichment Analysis (GSEA) is a computational method used to determine differences in biological process activity or pathway enrichment across different samples. It evaluates whether predefined sets of genes are statistically significantly associated with a biological state. In this study, all genes were first categorized into two groups based on their positive and negative logFC values. We then performed enrichment analysis on the positive and negative logFC gene groups using the “clusterProfiler” package in R (31).
Functional enrichment analysis of PCD-related DEGs
2.3
The Venn map was applied to select the common genes between DEGs and PCD-related genes. The STRING database1 was used to investigate protein interactions, with the validity of such interactions being determined by a composite score greater than 0.4. The GeneMANIA database2 prioritized genes for functional tests. Finally, the Metascape database3 was used to conduct functional enrichment analysis (32).
Using machine learning to screen characteristic genes
2.4
Different machine learning methods have different characteristics in data processing and pattern recognition, and their combined use can more comprehensively mine the potential information in the data, while avoiding the bias that may be brought by relying on a single method. We used 12 machine learning methods (Lasso, Ridge, Stepglm, XGBoost, Random Forest, Enet, plsRglm, GBM, Naïve Bayes, LDA, glmBoost, and SVM) to build the diagnostic model. 113 combinations of these 12 techniques were investigated through methodical designs for model generation and variable selection utilizing the training dataset (33). Three datasets were then used as external test datasets to validate the model’s performance. We also calculated the AUC values of each model and output the AUC matrix, and then used “ComplexHeatmap” to draw the AUC heatmap for visualizing the performance of each model on the training and testing sets. The best model is the one with the highest average AUC over training and testing cohorts (29).
Potential functions of the hub gene in LIRI
2.5
To identify the hub gene, the cytoHubba plug in Cytoscape was applied (34). GSEA and GSVA were utilized to elucidate the molecular mechanisms between high- and low-hub gene expression samples (35). Meanwhile, the ssGSEA was also used to assess the correlation between significantly different enriched immune cell types and the hub gene. These gene sets used in these analyses were obtained from MSigDB.
Construction of the transcription factor (TF) and ceRNA networks of hub gene
2.6
We utilize TFTF online (36) to predict the hub gene for TFs based on the integration of five major TF-Target online tools, namely hTFtarget (37), ENCODE (38), JASPAR (39), GTRD (40), and ChIP_Atlas (41). In addition, the TargetScan, miRDB, and miRanda databases were used to anticipate miRNA-mRNA pairs in order to identify the ceRNA network that might be influenced by model genes (42). Genes that were simultaneously listed in three databases were the only ones that were thought to be possible mRNA targets for further research (43). To predict miRNA-lncRNA pairs, the spongeScan database was used. At last, the ceRNA network could be seen using Cytoscape (44). Meanwhile, the Human Protein Atlas (HPA4) was utilized to examine the hub gene’ immunofluorescence and single-cell type atlases.
Identifying potential small-molecule compounds for the treatment of LIRI
2.7
The CMap database5 can link diseases, genes, and drugs based on gene expression profiles. The upregulated DEGs of LIRI were entered into the CMap database to identify potential small-molecule compounds for the treatment of LIRI (43). Then, the protein structures of the feature genes were obtained from the PDB database, and the AutoDock tool was utilized to compute the hydrogenation and charge of proteins. PubChemdatabase to download the chemical structure of the drug’s active ingredient. The AutoDock is used to examine the rotatable bonds and charge balance of small molecules. Finally, PyMol software was used to check the docking complex.
Results
3
Gene expression and biological characteristics of patients with LIRI
3.1
The flow chart of the research is presented in Figure 1. Initially, we merged three datasets of LIRI and corrected batch effects using the “sva” software package. As can be seen from Supplementary Figures S1A–D, after data normalization, the difference between batches is effectively eliminated, and the three datasets can be merged. The volcano map and heatmap showed the DEGs for the LIRI (Figure 2A and Supplementary Figure S1E). Given the important role of immune cells in LIRI, differences in immune cell infiltration were subsequently compared between LIRI patients and controls. It was found that LIRI patients had a higher percentage of activated CD4 T cells, dendritic cells, eosinophils, MDSC, mast cells, NK T cells, neutrophils, T helper cells, and CD8 T cells, while central memory CD4 T cells and NK cells were in contrast (Figure 2B). Further GSEA analysis was then performed to explore the differences in biological function between LIRI patients and controls. The results showed that relevant pathways and functions such as apoptotic and cytokines were significantly upregulated in the LIRI group (Figures 2C,D), while metabolism-related pathways and functions were significantly upregulated in the control group (Figures 2E,F).
The process of data analyzing in this study.
Analysis of differences between LIRI and control samples. (A) The volcano plot for DEGs in LIRI; (B) Differences in immune cells between LIRI and controls; (C–F) GSEA analysis of KEGG and GO between LIRI and controls.
PPI network and functional enrichment analysis for PCD-related DEGs
3.2
To further explore the role of PCD in LIRI, we collected PCD-related genes from 19 types of PCD. Using the Venn diagram, the DEGs and PCD-related genes were crossed, and 47 PCD-related DEGs were obtained (Figure 3A). The PPI network complex was constructed by importing 47 PCD-related DEGs into the STRING database. PPI analysis shows tight junctions between these genes (Figure 3B). Then, we used GeneMANIA to predict correlations between colocalization, pathways, shared protein domains, co-expression, and prediction. The network showed that these genes were mainly enriched in the regulation of apoptotic signaling pathway, response to molecules of bacterial origin, and cell chemotaxis (Figure 3C). Finally, the Metascape database was used to explore the biological activities and pathways of PCD-related DEGs. The result showed that they were involved in the regulation of PCD, the TNF signaling pathway, and the regulation of hydrolase activity (Figure 3D).
Functional enrichment analysis of PCD-related DEGs. (A) The intersection of DEGs and PCD-related gene; (B) PPI of the PCD-related DEGs; (C) GeneMANIA analysis of PCD-related DEGs; (D) Functional enrichment analyses by the Metascape database.
Selection of characteristic genes via machine learning algorithms
3.3
A total of 12 machine learning algorithms were combined to identify the most robust diagnostic model based on 47 PCD-related DEGs. Among them, the Lasso + XGBoost machine learning method has the highest average AUC value in the training set and the three validation sets, so the Lasso + XGBoost model is chosen as the final prediction model (Figure 4A and Supplementary Figures S2A–D). We identified 11 model genes: ANGPTL4, ATF3, BAG3, IL1B, IL6, IRF1, KRT18, MYC, PFKFB3, TNFAIP3, and TNFRSF1B. ROC curves of 11 model genes were shown in Figure 4B. The confusion matrix shows that our diagnostic model has high sensitivity, specificity and accuracy (Figure 4C), and it was confirmed in the verification sets (Figures 4D–F).
The model genes of LIRI were screened by machine learning method. (A) AUC values of 113 machine learning models; (B) ROC curves of diagnostic performance of 11 model genes for LIRI; (C–F) Confusion matrix of the model in training and three test sets.
Selection of the hub gene by the Cytoscape
3.4
We then performed gene expression analysis for these 11 model genes in the training set and validation sets, respectively. Analysis in the training set showed that these 11 model genes were all highly expressed in LIRI patients (Figure 5A). The gene expression analysis of the validation set was shown in Supplementary Figures S3A–C, which was consistent with the training set. Figure 5B demonstrated the correlation between these 11 model genes. To further explore the most critical of these genes, we examined the PPI networks of model genes using the STRING tool (Figure 5C) and inserted the results into Cytoscape. MYC was detected as the hub gene for these model genes using the Cytohubba plugin (Figure 5D).
Identification of the hub gene. (A) Box plot showed the expression difference of model genes between LIRI and control samples in training set. (B) Correlation analysis of 11 model genes; (C) PPI of the model genes; (D) The hub gene MYC was identified from 11 genes using Cytoscape; (E) Immune cell correlation analysis of MYC.
Immunological characteristics and biological function of the MYC in LIRI samples
3.5
Next, the relationship between MYC and the different immune cells was further studied. It showed that MYC was significantly positively correlated with Type 2 T helper cells, mast cells, macrophages, eosinophils and activated CD4 T cells, while oppositely in monocytes (Figure 5E). Then we performed GSVA analysis to further explore the biological functions of hub genes in LIRI. MYC was significantly positively associated with circadian rhythm, regulation of autophagy, and regulation of immune response-related pathways and functions in LIRI samples (Figures 6A,B). Subsequently, GSEA analysis was utilized to further explore the possible mechanism of action of MYC in LIRI samples. It showed that MYC was significantly positively associated with B cell receptor, Toll like receptor, and transcription regulator complex-related pathways and functions, while oppositely in ECM receptor interaction, complement and coagulation cascades, and basement membrane-related pathways and functions (Figures 6C–F).
Functional enrichment analysis of MYC in LIRI. (A,B) Enrichment biological functions and pathways of MYC identified by GSVA; (C–F) Enrichment biological functions and pathways of MYC identified by GSEA.
The transcription factors (TFs), ceRNA networks, single-cell maps, and immunofluorescence analysis of MYC
3.6
TFs are critical in regulating gene expression and shaping cellular and organismal phenotypes. We therefore combined five databases to characterize TFs in MYC and identified a total of 19 reliable TFs: CTCF, BATF, EGR1, MAZ, PAX5, SP1, TCF12, E2F6, FOS, JUND, TEAD4, NFIC, PBX3, STAT3, TFAP2A, TFAP2C, TCF7L2, FOSL2, and RELA (Figure 7A). In addition, the ceRNA network of MYC was built using various public databases. Ultimately, we were able to identify 2 objective miRNAs and 12 objective lncRNAs of MYC (Figure 7B). The network disclosed transcriptional regulatory mechanisms for MYC. The cellular location of MYC was then investigated. It can be found that MYC is mainly expressed in the nucleoplasm, where green represents the target protein and red represents microtubules (Figure 7C). In addition, we evaluated MYC expression at the single-cell data level using the HPA database. It was found that MYC was mainly distributed in smooth muscle cells and fibroblasts (Figure 7D).
Regulatory network, single-cell mapping and immunofluorescence analysis of MYC. (A) Prediction of TFs based on different databases; (B) The ceRNA network of MYC; (C) The immunofluorescence of MYC based on HPA database; (D) The single-cell mapping of MYC based on HPA database; (E) Molecular docking of BMS-536924 and MYC; (F) Molecular docking of PF-431396 and MYC.
Identification of potential small-molecule compounds for the treatment of LIRI
3.7
In addition, to search for potential drugs to treat LIRI, we entered upregulated DEGs in LIRI into the CMap database for analysis. The top 10 small-molecule compounds are shown in Table 1 and are considered potential therapeutic drugs for LIRI. Then we conducted molecular docking analysis of these 10 small-molecule compounds with MYC. The minimum binding energy between the hub gene and each small-molecule compound is shown in Table 1. The results showed that the minimum binding energy between the ligand and the receptor was less than −7.0 kcal/mol, so the target proteins had a good affinity for the active ingredient, suggesting that these small-molecule drugs could act on MYC to treat LIRI. Among them, BMS-536924 (−9.8 kcal/mol) and PF-431396 (−9.4 kcal/mol) have the lowest free binding energy for MYC and are most likely to be potential therapeutic agents for LIRI (Figures 7E,F).
Discussion
4
LIRI is one of the serious complications and a major risk factor for early allograft failure after LT, which has led to a shortage of transplanted organs (45). LIRI is a self-amplifying process involving two interrelated phases of ischemic and reperfusion injury (46). The ischemic insult is characterized by a dysfunction of the mitochondrial respiratory chain, activation of cell death programs, and alterations in expression of genes (47, 48). The field of LT has prioritized research to develop effective strategies to minimize IRI because LIRI is linked to increased short- and long-term morbidity and death (49). PCD is a specified form of cell death that could be controlled by different biomolecules. Numerous studies have demonstrated that PCD is closely correlated with the severity of LIRI injury, which also implies that PCD has an important role in the treatment of LIRI (14). The aim of this study was to conduct a preliminary exploration of PCD patterns in LIRI using integrated bioinformatics analysis and molecular docking techniques to identify central genes and potential therapeutic agents to enhance early prevention and treatment of LIRI.
In the current study, we comprehensively searched for LIRI-related datasets and eventually included a total of six cohorts of LIRI samples. To understand the underlying mechanisms of LIRI occurrence, we first compared the differences in biological function between LIRI and controls by GSEA analysis. The results showed that the intrinsic apoptotic signaling pathway was significantly upregulated in the samples of the LIRI group. Given that different forms of PCD are widely cross-talked and play important roles in LIRI, we collected a total of 1,567 genes for 19 types of PCD to further comprehensively explore the potential mechanisms and therapeutic targets of PCD in LIRI. Among them, 47 PCD-related genes were differentially expressed in LIRI, and these PCD-related DEGs were used to follow up further studies. In order to explore the potential mechanism of these genes in LIRI, we performed functional enrichment analyses of 47 PCD-related DEGs. The result showed that the DEGs were involved in the positive regulation of PCD, apoptotic signaling pathway, and TNF signaling pathway. These genes may contribute to the development of LIRI by regulating PCD, TNF signaling pathways, and other pathways.
Then, we applied 113 machine learning combinations to screen out 11 characteristic genes as diagnostic model. We used multiple analytical methods to further evaluate the value of our diagnostic model in LIRI, which showed specific expression and a high degree of prediction power. The average AUC value of the model was 0.955 in the training set and in three different external validation sets. Although this may be related to the small sample size, and the validation of multiple cohorts is sufficient to illustrate the excellent performance of the model, suggesting that these 11 genes can be used as diagnostic biomarkers for LIRI patients.
Subsequently, Cytoscape was utilized to further screen these 11 genes for the hub gene MYC, which is considered a hub PCD-related target in LIRI. MYC is a pleiotropic transcription factor involved in multiple cellular processes. MYC is thought to regulate more than 15% of human genes and is sometimes described as a “master gene regulator.” It is involved in the regulation of a variety of cellular processes, including cell growth, cell cycle, differentiation, apoptosis, angiogenesis, DNA repair, and stem cell formation (50). Recent studies have shown that MYC promotes renal tubular cell apoptosis in ischemia–reperfusion-induced kidney injury by regulating the apoptotic pathway (51). In addition, Xiao et al. (52) found that inhibition of the MYC/PTEN axis attenuates cerebral ischemia–reperfusion injury in the rat. Sun et al. (53) found that MYC may regulate NDRG2 expression in cardiomyocytes and promote apoptosis in rat cardiomyocytes after ischemia–reperfusion. These studies suggest that MYC may play an important role in ischemia–reperfusion injury; however, the role of MYC in LIRI has not been reported.
To further explore the potential mechanisms of MYC action in LIRI, we conducted a comprehensive analysis. MYC was found to be significantly positively correlated with Type 2 T helper cells, mast cells, macrophages, eosinophils and activated CD4 T cells. Enrichment analysis showed that B cell receptor, Toll like receptor, and transcription regulator complex-related pathways and functions were significantly upregulated in high-MYC patients. Previous studies have shown that MYC expression in immune cells is tightly regulated during development and in response to immune stimulation (54). MYC plays a crucial role in governing the development, differentiation, and activation of immune cells. By driving the expression of a broad range of metabolic genes, MYC orchestrates metabolic programs that support immune function. For example, research has demonstrated that MYC is involved in regulating T cell development, activation, and differentiation, thereby facilitating adaptive immune responses (55). Our results suggested that MYC may contribute to LIRI by regulating these immune cells and pathways. Subsequent TF prediction and construction of the ceRNA network further revealed the potential regulatory network of MYC, providing a scientific basis for further studies of MYC in LIRI in the future.
In addition, MYC expression was significantly up-regulated in LIRI, so it may be new therapeutic targets for LIRI. We molecularly docked the top ten predicted small-molecule compounds with MYC, respectively, and found that BMS-536924 and PF-431396 had the strongest binding ability to the MYC, suggesting that BMS-536924 and PF-431396 could be used to treat LIRI by binding to MYC. BMS-536924 is an effective IGF-I small molecule inhibitor, while PF-431396 is a FAK small molecule inhibitor. Previous research has demonstrated that IGF-II knockdown can suppress MYC expression in hepatocellular carcinoma cells via the FAK/PI3K/AKT signaling pathway (56). In line with this, Zhang et al. (57) found that FAK inhibitors can inhibit MYC expression by disrupting the PI3K/AKT axis. Additionally, studies have shown that IGF-1 overexpression can enhance MYC expression (58), and MYC also can promote tumor cell growth through paracrine signaling mediated by the IGF-1/IGF-1R axis (59). These studies provide strong theoretical support for the possibility that both BMS-536924 (IGF-1 inhibitor) and PF-431396 (FAK inhibitor) could treat LIRI by modulating MYC, suggesting that targeting MYC with these small molecules may offer a promising therapeutic strategy for LIRI.
This is the first bioinformatics study to uncover the potential role of PCD in LIRI. However, our study has some limitations. First, although we included multiple datasets for analysis and validation, clinical studies are needed in the future to support our conclusions. In addition, further in vivo and in vitro experiments are needed to verify the mechanisms of action of MYC and the therapeutic effects of BMS-536924 and PF-431396 in LIRI in the future.
Conclusion
5
In conclusion, by integrating a series of bioinformatics approaches, we identified MYC as reliable diagnostic and therapeutic targets for LIRI and comprehensively analyzed its mechanisms of action in the LIRI. More importantly, we found BMS-536924 and PF-431396 may be potential drugs for the treatment of LIRI by acting on MYC.
The reference list from the paper itself. Each links out to its DOI / PubMed record.
- 1Peralta C Jimenez-Castro MB Gracia-Sancho J. Hepatic ischemia and reperfusion injury: effects on the liver sinusoidal milieu. J Hepatol. (2013) 59:1094–106. doi: 10.1016/j.jhep.2013.06.017, PMID: 23811302 · doi ↗ · pubmed ↗
- 2Hirao H Nakamura K Kupiec-Weglinski JW. Liver ischaemia-reperfusion injury: a new understanding of the role of innate immunity. Nat Rev Gastroenterol Hepatol. (2022) 19:239–56. doi: 10.1038/s 41575-021-00549-834837066 · doi ↗ · pubmed ↗
- 3Papadopoulos D Siempis T Theodorakou E Tsoulfas G. Hepatic ischemia and reperfusion injury and trauma: current concepts. Arch Trauma Res. (2013) 2:63–70. doi: 10.5812/atr.12501, PMID: 24396796 PMC 3876547 · doi ↗ · pubmed ↗
- 4Liu J Man K. Mechanistic insight and clinical implications of ischemia/reperfusion injury post liver transplantation. Cell Mol Gastroenterol Hepatol. (2023) 15:1463–74. doi: 10.1016/j.jcmgh.2023.03.003, PMID: 36940849 PMC 10160787 · doi ↗ · pubmed ↗
- 5Liu XB Lo CM Cheng Q Ng KT Shao Y Li CX. Oval cells contribute to fibrogenesis of marginal liver grafts under stepwise regulation of aldose reductase and notch signaling. Theranostics. (2017) 7:4879–93. doi: 10.7150/thno.20085, PMID: 29187911 PMC 5706107 · doi ↗ · pubmed ↗
- 6Wu K Ma L Xu T Cao J Zhou C Yu X. Transcription factor YY 1 ameliorates liver ischemia-reperfusion injury through modulating the mir-181a-5p/ESR 1/ERBB 2 axis. Transplantation. (2023) 107:878–89. doi: 10.1097/TP.0000000000004356, PMID: 36413144 · doi ↗ · pubmed ↗
- 7Zhu S Wang X Chen H Zhu W Li X Cui R. Hippo (YAP)-autophagy axis protects against hepatic ischemia-reperfusion injury through JNK signaling. Chin Med J. (2024) 137:657–68. doi: 10.1097/CM 9.0000000000002727, PMID: 37232477 PMC 10950187 · doi ↗ · pubmed ↗
- 8Tang D Kang R Berghe TV Vandenabeele P Kroemer G. The molecular machinery of regulated cell death. Cell Res. (2019) 29:347–64. doi: 10.1038/s 41422-019-0164-5, PMID: 30948788 PMC 6796845 · doi ↗ · pubmed ↗