The Kinetics of Mesophyll Conductance and Photorespiration During Light Induction
Ningyu Liu, Jianxin Cao, Mingying Yang, Yiyun Li, Wei Huang

TL;DR
This study explores how mesophyll conductance and photorespiration change in two tree species during light exposure under different humidity conditions.
Contribution
The study reveals species-specific responses of mesophyll conductance and photorespiration to vapor pressure deficit during light induction.
Findings
Coordination of mesophyll and stomatal conductance occurs in Catalpa fargesii but not in Pterocarya stenoptera during light induction.
High vapor pressure deficit affects mesophyll and stomatal conductance differently in the two species.
Photorespiration plays a key role in regulating photosynthetic electron flow during light induction.
Abstract
Mesophyll conductance to CO2 (gm) act as a significant limiting factor influencing the CO2 assimilation rate (AN) during photosynthetic induction. However, the effect of vapor pressure deficit (VPD) on gm kinetics during light induction is not well clarified. We combined gas exchange with chlorophyll fluorescence measurements to assess the induction kinetics of gm during light induction under contrasting vapor pressure deficit (VPD) in two tree species with different stomatal conductance (gs) behavior, Catalpa fargesii and Pterocarya stenoptera. Our results revealed three key findings: (1) the coordination of gm and gs kinetics during light induction occurred in C. fargesii but not in P. stenoptera, and the model of gs kinetics largely determines whether the coordination of gs and gm exist in a given species; (2) a high VPD induced simultaneous changes in gs and gm kinetics in C.…
Genes, proteins, chemicals, diseases, species, mutations and cell lines named across the full text — each resolved to its canonical identifier and authoritative record.
Click any figure to enlarge with its caption.
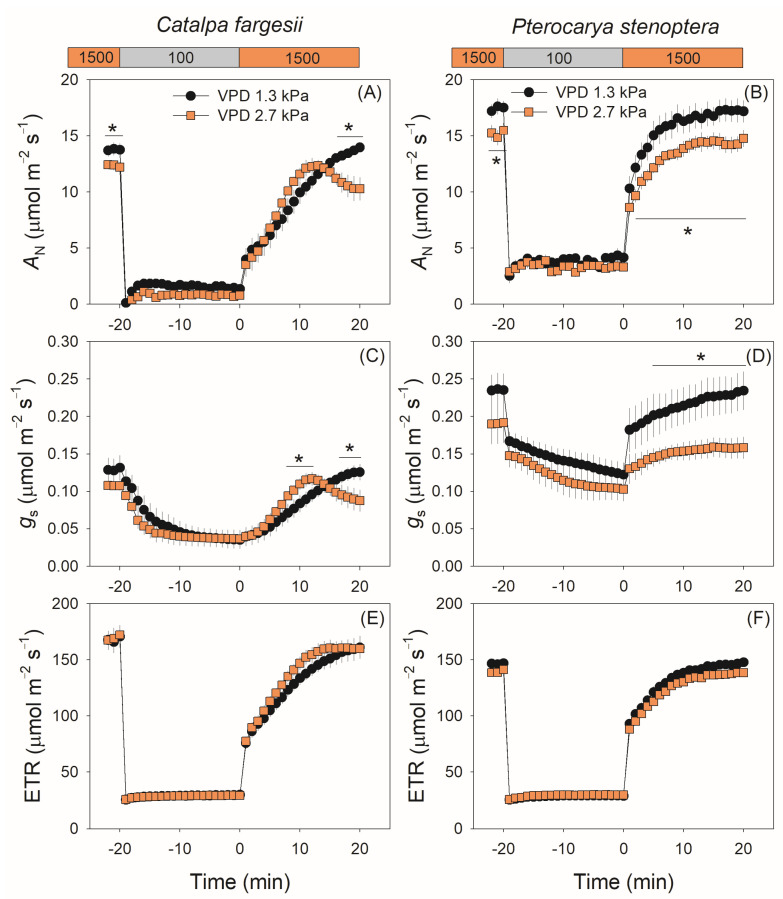 Figure 1
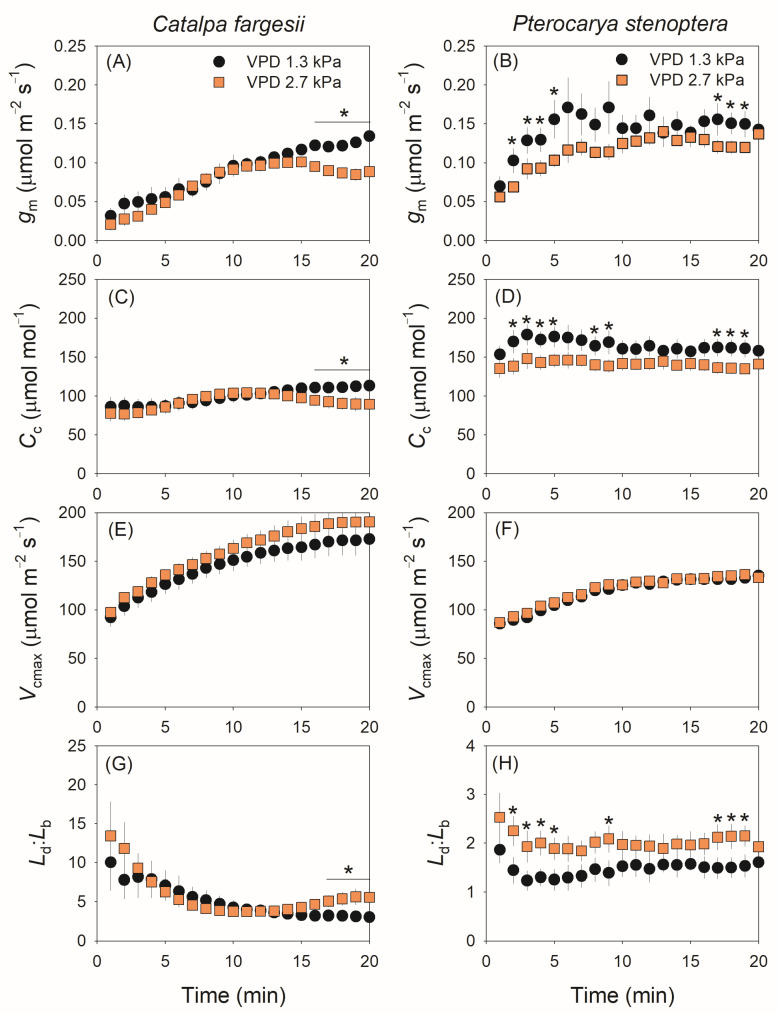 Figure 2
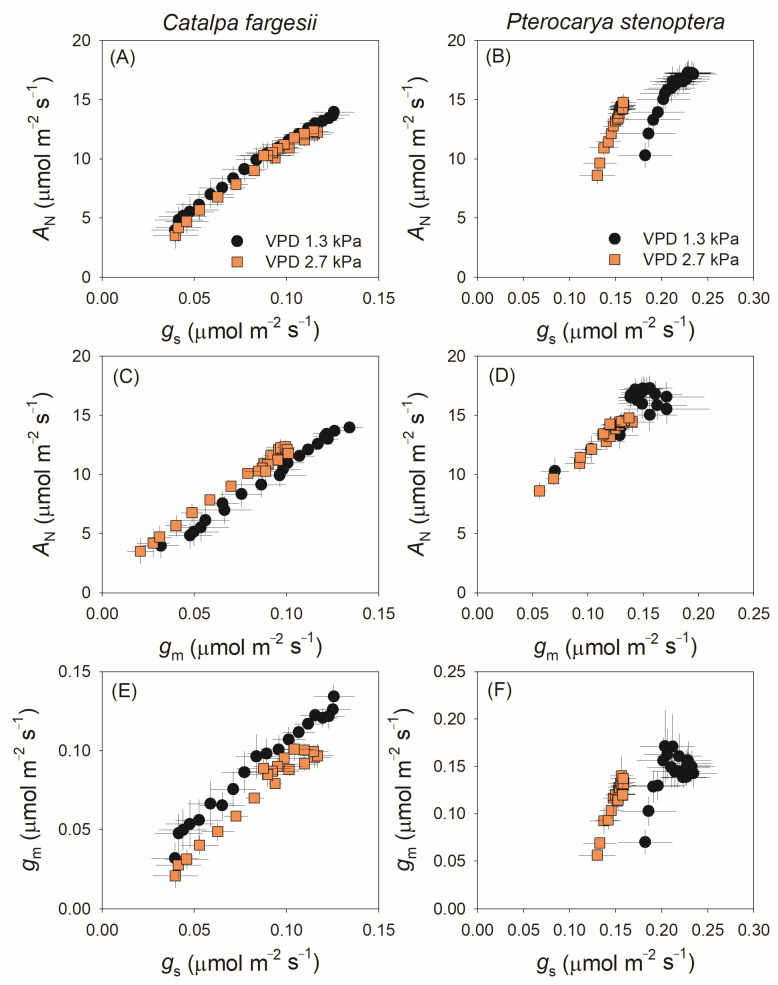 Figure 3
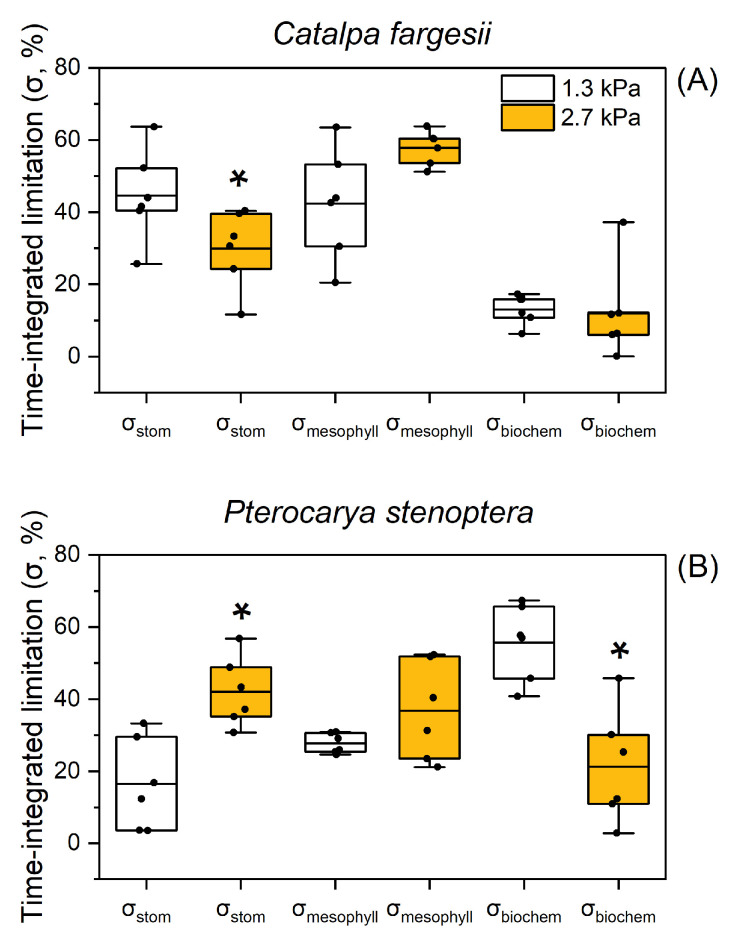 Figure 4
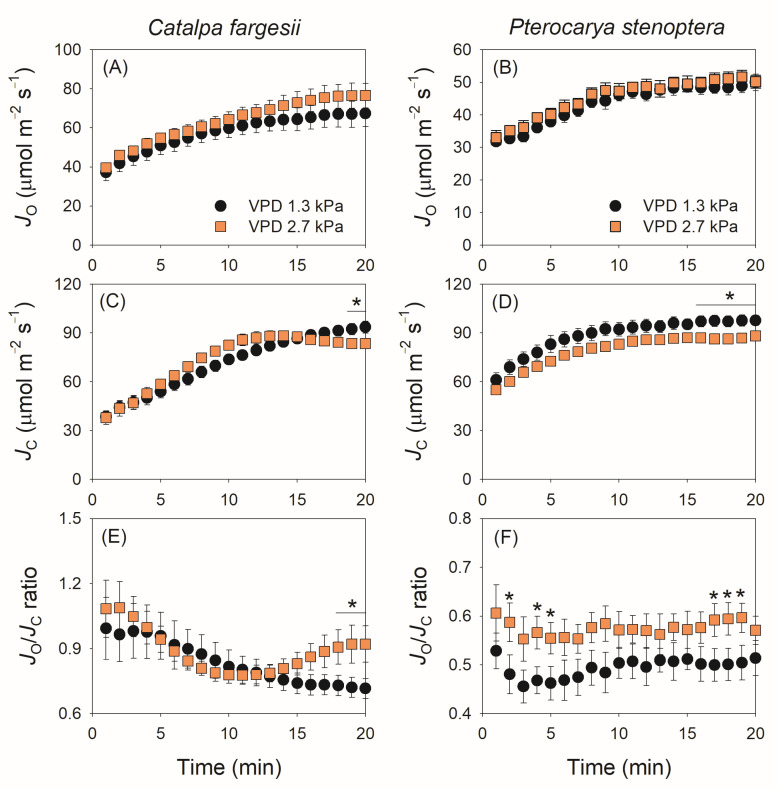 Figure 5
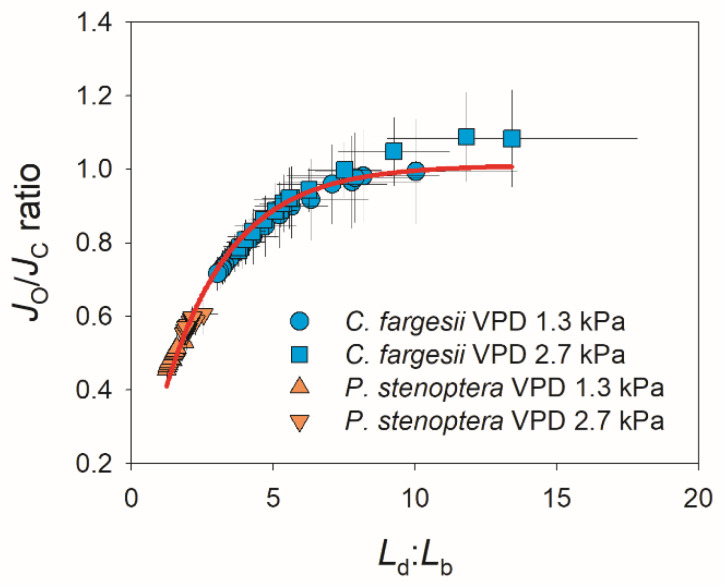 Figure 6
- —Major Science and Technology Projects in Yunnan Province
- —National Natural Science Foundation of China
- —West Light Foundation of the Chinese Academy of Sciences
Peer Reviews
No public reviews on file for this paper yet. If you reviewed it on a platform where reviews are public (OpenReview, ICLR, NeurIPS, ICML), you can paste yours below so the community can read it here.
Videos
No videos yet. Explain this paper in a talk, walkthrough, or lecture? Add one.
Taxonomy
TopicsPlant Water Relations and Carbon Dynamics · Plant responses to elevated CO2 · Photosynthetic Processes and Mechanisms
1. Introduction
In natural environments, plants experience rapid fluctuations in light intensity on their leaves due to various factors such as shading by neighboring vegetation, cloud cover, and wind-induced changes in leaf orientation. These fluctuations can occur within seconds to minutes and significantly impact photosynthetic processes [1,2,3]. When plants transition from shade to direct sunlight, photosynthesis enters an induction phase, characterized by a gradual increase in the rate of photosynthesis until a new steady state is achieved [4,5,6]. The duration of this induction period, which can range from a few minutes to several tens of minutes, is influenced by plant species, prior light exposure, and environmental conditions [7]. This dynamic response in photosynthesis is crucial for carbon fixation and, ultimately, plant growth [8,9,10,11].
Many previous studies have demonstrated that in fluctuating light environments, the induction phase of photosynthesis can significantly reduce daily carbon assimilation in many crop species compared to an ideal scenario where photosynthetic rates achieve a steady state immediately following a change in light intensity [3,8,12,13]. This highlights the critical importance of understanding the physiological mechanisms underlying photosynthetic induction to potentially improve crop yield [14,15,16,17,18]. The induction process, particularly following a transition from low to high light, is primarily governed by three key physiological processes: the induction rate of photosynthetic electron transport in the thylakoid membrane, the activation of Calvin–Benson cycle enzymes (notably Rubisco), and CO_2_ diffusion conductance.
Photosynthetic electron transport induction is a rapid process that significantly limits photosynthetic efficiency only within the first 1–2 min after the onset of light induction [19]. In contrast, Rubisco activity limits photosynthetic efficiency over a longer period, as it takes 5–20 min for Rubisco to reach its maximum activity level after illumination [20,21]. CO_2_ diffusion conductance involves two sequential components along the CO_2_ diffusion pathway: stomatal conductance (gs) from the leaf surface to the intercellular spaces and mesophyll conductance (gm), from the intercellular spaces to the carboxylation sites within the chloroplasts [22]. Over the past decade, research has focused on stomatal kinetics and their impact on photosynthetic induction, revealing significant variations in stomatal opening speeds among and within species [5,23,24,25]. Stomatal conductance typically takes much longer to reach a steady state (from tens of minutes to over an hour) compared to the activation of Rubisco [26,27,28,29]. The slow induction of g_s_ imposes a significant limitation on photosynthesis in some crops, such as African cassava germplasm and tomato species [17].
Compared to the well-studied stomatal limitation, the impact of gm on photosynthetic induction is less understood. Studies measuring gm at different light levels suggest that gm generally increases in response to short-term irradiance increases in a range of plant species, with some exceptions [25,30,31,32,33,34]. However, the response of gm to a light shift is not equivalent to its induction kinetics. Only a few studies have attempted to track the time course of gm during light induction in model herbaceous species such as Arabidopsis [4,20], tobacco [4,20], and tomato [35,36,37]. These results indicated that the full induction of gm requires approximately 7–20 min, which imposes a significant limitation on photosynthesis during light induction. In contrast, the nonsteady-state kinetics of gm in response to light induction remains poorly understood in tree species.
A recent study indicated that in the “open stomata” mutant (ost1) of Arabidopsis, enhanced gs during light induction was accompanied by a more rapid induction rate of gm, leading to higher photosynthetic efficiency under fluctuating light [4]. Conversely, tomato plants with nitrogen deficiency exhibited simultaneous delays in the induction speeds of both g_s_ and gm after transitioning from low to high light [37]. Under drought stress, the decrease in gs is associated with a slower induction rate of gm in tomato plants, thereby restricting photosynthetic efficiency during light induction [35,36]. These results suggest that during light induction, the kinetics of gs significantly influence the induction speed of gm. However, the hypothesis that gs and gm kinetics are coordinated during light induction requires further investigation.
Fluctuating light is often accompanied by variations in vapor pressure deficit (VPD) due to diurnal changes in air temperature and relative humidity. VPD is an important environmental factor that affects steady-state photosynthesis primarily by influencing gs [38,39,40]. Additionally, high VPD conditions can restrict photosynthesis under fluctuating light by decreasing both the absolute value and the induction rate of gs [40,41]. Some studies have reported that elevated VPD induces simultaneous decreases in gs and gm under fluctuating light in species such as tomato and rose [40,41]. However, the effects of changing VPD on gm kinetics in tree species remain poorly understood. Moreover, it is unclear whether the coordination of gs and gm kinetics during light induction can be altered by changes in VPD. Future research should focus on elucidating these interactions to better understand how VPD influences photosynthetic efficiency under dynamic light conditions.
Within the first minutes after transitioning from low to high light, relatively low diffusional conductance results in a reduced chloroplast CO_2_ concentration [20]. This, in turn, leads to a decreased rate of CO_2_ assimilation, which induces a decline in the ADP/ATP ratio. The reduced ADP/ATP ratio can inactivate chloroplast ATP synthase [42]. Concurrently, the low chloroplast CO_2_ concentration makes photorespiration a significant primary metabolic pathway. Photorespiration consumes a substantial fraction of ATP and NADPH, thereby preventing the feedback inhibition of chloroplast ATP synthase [43]. Therefore, photorespiration may play a crucial role in regulating the photosynthetic electron transport rate during light induction [44]. While the response of photorespiration to light intensity has been studied at a steady state, few investigations have examined the temporal dynamics of photorespiration following an immediate transition from low to high light [45,46].
In the present study, we combined measurements of gas exchange and chlorophyll fluorescence to estimate the kinetics of gm during light induction in two tree species with different gs behaviors. The main aims were to (1) examine whether the coordination of gs and gm during light induction is affected by gs behavior; (2) characterize the effect of VPD on gm kinetics during photosynthetic induction; and (3) quantify the relationship between photorespiration and gm kinetics during light induction.
2. Results
2.1. The Response of The Induction Kinetics of CO2 Assimilation, gs and gm to VPD
We first measured the gs kinetics in fluctuating light at a moderate VPD of 1.3 kPa. Upon the transfer from high to low light, gs gradually decreased in C. fargesii with an exponential decline model (Figure 1A). By comparison, in the other species P. stenoptera, gs largely decreased in the first minute and then gradually decreased with a linear model (Figure 1B). After the transition from low to high light, gs gradually increased in C. fargesii with a model of exponential rise to the maximum (Figure 1A), whereas gs largely increased in the first minute and then gradually increased with a linear model (Figure 1B). Therefore, these two tree species showed different gs kinetics model in fluctuating light.
When the vapor pressure deficit (VPD) increased from 1.3 to 2.7 kPa, the gs kinetics during light induction were altered in both species. In C. fargesii, gs first increased to a peak in 10 min and then gradually decreased to a lower steady-state value. By comparison, in P. stenoptera the absolute value of gs was depressed over time. The kinetics of the net CO_2_ assimilation rate (AN) showed similar trends to gs in both species (Figure 1C,D). In C. fargesii, AN gradually increased to the steady-state value at 1.3 kPa VPD but first increased to a peak and then gradually decreased at 2.7 kPa VPD, leading to a lower steady-state AN at 2.7 kPa than at 1.3 kPa. In P. stenoptera, AN gradually increased to the steady-state value during light induction, and the absolute value was substantially depressed by the high VPD condition. However, the increased VPD condition had no significant effect on photosynthetic electron transport rate (ETR) during light induction (Figure 1E,F).
During light induction, the kinetics of gm was altered by the high vapor pressure deficit in both species. In C. fargesii, gm gradually increased in the light induction period (20 min) at 1.3 kPa VPD but first increased to a peak in 15 min and then slightly decreased at 2.7 kPa VPD (Figure 2A). In P. stenoptera, gm gradually increased to its peak in approximately 6 and 13 min at 1.3 and 2.7 kPa VPD conditions, respectively, and then remained stable (Figure 2B). Compared with 1.3 kPa VPD, the steady-state value of gm at 2.7 kPa VPD was depressed in C. fargesii but remained stable in P. stenoptera (Figure 2A,B). The kinetics of chloroplast CO_2_ concentration (Cc) in light induction showed a similar response to VPD as well as gm (Figure 2C,D). By comparison, the rise in VPD hardly affected the kinetics of the Rubisco carboxylation rate (Vcmax) in both species (Figure 2E,F). Owing to the different effects of VPD on CO_2_ diffusion and Vcmax, the ratio between diffusional and biochemical photosynthesis limitations (Ld:Lb) at 2.7 kPa VPD substantially increased at a steady state in C. fargesii (Figure 2G) and increased in P. stenoptera during light induction (Figure 2H).
2.2. Correlation Between gs and gm During Light Induction
The relationships between gs, gm and AN during the induction period are examined in Figure 3. In C. fargesii, AN was positively correlated to gs and gm (Figure 3A,C), and a coordination between gs and gm was observed (Figure 3E). In P. stenoptera, the relationship between AN and gs differed between 1.3 and 2.7 kPa VPD conditions and the same AN was accompanied by a much lower gs at 2.7 kPa VPD (Figure 3B). Similarly to C. fargesii, AN was tightly related to gm in P. stenoptera, especially at 2.7 kPa VPD (Figure 3D). The coordination between gs and gm in P. stenoptera was observed at 2.7 kPa VPD but disappeared at 1.3 kPa VPD, suggesting that the induction of gm was independent of gs in P. stenoptera.
2.3. The Time-Integrated Limitations of AN During Light Induction
At 60% relative humidity, the time-integrated limitations of gs (σ_stom_), gm (σ_mesophyll_), and biochemistry (σ_biochem_) during light induction were 45%, 42%, and 13%, respectively, in C. fargesii (Figure 4A). When the atmospheric VPD increased from 1.3 to 2.7 kPa, σ_stom_, σ_mesophyll_, and σ_biochem_ changed to 30%, 58%, and 12%, respectively (Figure 4A). Therefore, CO_2_ diffusional conductance imposed a major limitation on AN during light induction in C. fargesii. In P. stenoptera, the values for σ_stom_, σ_mesophyll_, and σ_biochem_ at 1.3 kPa VPD were 17%, 28%, and 56%, respectively; and they changed to 42%, 37%, and 21% at 2.7 kPa VPD, respectively. This result suggests that a high VPD shifted the major limitation of AN from biochemistry to CO_2_ diffusional conductance in P. stenoptera.
2.4. Induction Kinetics of Photorespiration
The kinetics of photorespiration is shown in Figure 5. Photosynthetic electron flow to Rubisco oxygenation (JO) gradually increased during light induction in both species, and the changing VPD did not significantly influence the kinetics of JO in them (Figure 5A,B). Similarly, the changing VPD slightly affected the kinetics of photosynthetic electron flow to Rubisco carboxylation (JC). In C. fargesii, JC gradually increased during the induction period (20 min) at 1.3 kPa VPD but reached the maximum in 12 min at 2.7 kPa VPD (Figure 5C). In P. stenoptera, the changing VPD condition did not alter the increase trend in JC but decreased the absolute value (Figure 5D). Owing to the different effects of changing VPD on JO and JC in C. fargesii, the JO/JC ratio gradually decreased at 1.3 kPa VPD but first decreased and then gradually increased at 2.7 kPa VPD (Figure 5E). As a result, after light induction for 20 min, the JO/JC ratio at 2.7 kPa VPD was substantially higher than that at 1.3 kPa VPD (Figure 5E). By comparison, in P. stenoptera, the JO/JC ratio remained stable at 0.5 and 0.6 during light induction under 1.3 and 2.7 kPa VPD conditions, respectively (Figure 5F). Plotting the data of JO/JC ratio and Ld:Lb indicated that a non-linear positive relationship was found (Figure 6). When Ld:Lb was extremely high within the first seconds after the transition to high light, photorespiration acted as a major electron sink to favor the operation of photosynthetic electron flow. When Ld:Lb was lowered at the later phase of light induction, the contribution of photorespiration to the total electron flow was diminished. Therefore, electron flow to photorespiration is flexible according to the change in Ld:Lb.
3. Discussion
3.1. Relationship Between gs and gm During Light Induction Is Species-Dependent
During light induction, gs gradually increases and imposes significant limitations on photosynthesis in model species such as Arabidopsis thaliana, tobacco, tomato and Aferican cassava [4,17,20,35,36]. A few studies have investigated the dynamic kinetics of gm during light induction; the results of these studies proposed a hypothesis that gs and gm coordinated to optimize photosynthesis during light induction [4,20]. We found that the tree species C. fargesii exhibited a fine coordination between gs and gm kinetics during light induction (Figure 3E). However, such a coordination between gs and gm disappeared in the other tree species P. stenoptera (Figure 3F), suggesting that the induction kinetics of gs is independent of that of gm in P. stenoptera. Therefore, coordination between gs and gm kinetics during light induction is not universal in angiosperms.
After the transition from low to high light, all studied angiosperms showed a similar trend of gm kinetics with a model of exponential increase to the maximum, as shown in Arabidopsis thaliana [4,20], tobacco [4,20], tomato [35], and the studied tree species C. fargesii and P. stenoptera (Figure 2A,B). However, the model of gs kinetics during light induction varied between species. Generally, there are three different models of gs kinetics during light induction among angiosperms: (1) an exponential increase to the maximum, as shown in Arabidopsis thaliana [4,20], tobacco [20], and the studied tree species C. fargesii (Figure 1C), (2) a sigmoidal increase to the maximum, as shown in tomato [35,37], and (3) a rapid increase in the first minute and then a gradual increase with a linear model, as shown in the studied tree species P. stenoptera (Figure 1D). Apparently, in P. stenoptera, the different induction models of gs and gm led to the discoordination between gs and gm during light induction. Therefore, the model of gs kinetics largely determines whether the coordination of gs and gm exist in a given species.
3.2. Differential Effects of VPD on gm Kinetics During Light Induction
A high VPD can delay the induction rate of photosynthetic CO_2_ assimilation. One explanation is that a high VPD slows the induction rate of gs [5,40,41], but the effect of VPD on gm kinetics during light induction is not well understood [41]. Here, we found that the response of gm kinetics to VPD was similar to that of gs in C. fargesii (Figure 1C and Figure 2A). In detail, under the high VPD condition, gm first gradually increased to its peak and then gradually decreased to the steady state, with a significantly lower steady-state value than that under the low VPD condition (Figure 2A). By comparison, a high VPD had different effects on the induction kinetics of gs and gm in P. stenoptera (Figure 1D and Figure 2B). Specifically, a high VPD just delayed the induction rate of gm but did not significantly affect the steady-state value (Figure 2B). Therefore, the response of gm kinetics during light induction to VPD differs between species.
In the tree species P. stenoptera, gs imposed a minor limitation on AN during light induction at a low VPD but acted as a major limitation at a high VPD (Figure 4B). By comparison, the limitation of gm imposed on AN just increased slightly under the high VPD condition (Figure 4B). Furthermore, the same value of AN during light induction was accompanied with a lower gs when illuminated at a high VPD (Figure 3B). As a result, the intrinsic water use efficiency (WUEi) was enhanced at a high VPD compared to a low VPD. Concomitantly, the maximum velocity of Rubisco carboxylation (Vcmax) was not altered by the increase in VPD (Figure 2F). Therefore, such an increase in dynamic WUEi under the high VPD condition could not be explained by the change in Vcmax. Alternatively, the dynamic gm was slightly affected by the increase in VPD, which compensated for the large decrease in gs. Consequently, the extent of the decrease in chloroplast CO_2_ concentration (Cc) under the high VPD condition was much lower than that of gs (Figure 1D and Figure 2D), which was accompanied by a slight decrease in AN (Figure 1B). Therefore, the insusceptibility of gm kinetics to VPD has the potential to increase WUEi under high VPD conditions.
3.3. Modulation of Photorespiration in Response to Photosynthetic Limitation
Here, we found that within the first few minutes after the transition to high light, photorespiration was a major alternative electron sink in the C. fargesii, with the JO/JC ratio being approximately 1.0 (Figure 5E). By comparison, the JO/JC ratio was substantially lower in P. stenoptera than in C. fargesii (Figure 5E). Therefore, the contribution of photorespiration to total electron flow during light induction significantly differed between C. fargesii and P. stenoptera. Photorespiration is determined by Rubisco activity and chloroplast CO_2_ concentration (Cc). As shown in Figure 2, the value of Vcmax was higher in C. fargesii than in P. stenoptera, while the value of Cc was lower in C. fargesii than in P. stenoptera. Therefore, the higher JO/JC in C. fargesii than in P. stenoptera was mainly caused by their differences in Rubisco activity and chloroplast CO_2_ concentration.
In addition, we found a non-linear positive relationship between the JO/JC ratio and Ld:Lb in these two studied species (Figure 6), indicating that the relative contribution of photorespiration to total electron flow was flexible in response to the change in relative diffusional and biochemical limitations. When CO_2_ assimilation was limited by the high Ld:Lb within the first few minutes after the transition from low to high light, the restriction of CO_2_ assimilation increased the ATP/ADP and NADPH/NADP^+^ ratios, rendering chloroplast ATP synthase activity and electron transport from photosystem I to NADP^+^ limited [42]. Photorespiration consumes a significant fraction of ATP and NADPH to maintain the regeneration of RuBP [47] and consequently prevents the feedback inhibition of chloroplast ATP synthase activity and facilitates the operation of the electron downstream of photosystem I [43]. Consistently, photorespiration acted as the major electron sink pathway when Ld:Lb was extreme high. Alternatively, when CO_2_ assimilation operated efficiently under low Ld:Lb conditions, the contribution of photorespiration to total electron flow was diminished. Therefore, photorespiration has a significant role in the regulation of photosynthetic electron flow during light induction.
4. Materials and Methods
4.1. Plant Materials and Growing Conditions
In this study, we used the seedlings of two tree species with different stomatal conductance (gs) behavior, Catalpa fargesii and Pterocarya stenoptera. They are deciduous, arboreal trees native to the subtropical regions of southwestern China. The two tree species are light-demanding and typically thrive under full sunlight. Therefore, they have similar light requirements. All plants were cultivated in greenhouses in Kunming, Yunnan, China. The day/night temperature is 30/20 °C, the relative humidity is about 60%, and the maximum light intensity to which leaves are exposed is approximately 1000 μmol photons m^−2^ s^−1^. To avoid any water and nutrient stress, plants were cultivated using a soilless substrate and drip irrigation techniques.
4.2. Gas Exchange and Chlorophyll Fluorescence Measurements
Leaves were exposed to high light (1500 µmol photons m^−2^ s^−1^, composed of 90% red light and 10% blue light) using the chlorophyll fluorescence probe of the LI-6400XT portable photosynthesis system for at least 30 min on a sunny summer morning. Steady-state data for gas exchange and chlorophyll fluorescence were then recorded. Subsequently, the light intensity was reduced to 100 µmol photons m^−2^ s^−1^ to simulate a sun-to-shade transition, lasting for 20 min. The light intensity was then returned to 1500 µmol photons m^−2^ s^−1^ to simulate a shade-to-sun transition, also lasting for 20 min. During both sun-to-shade and shade-to-sun transitions, data were recorded at 1-minute intervals. The air temperature was maintained at 25 °C, and the vapor pressure deficit (VPD) was controlled at 1.3 kPa (relative humidity of 60%) and 2.7 kPa (relative humidity of 15%) for different experimental conditions.
In our study, we utilized the multi-phase flash (MPF) protocol following standard procedures to determine the parameters of chlorophyll fluorescence [48]. The light intensity for the measurement was set at 1 µmol m^−2^ s^−1^, while the maximum flash intensity reached 8000 µmol m^−2^ s^−1^. During the second phase of the MPF, the flash intensity was reduced by 60%, with the three flash phases lasting 0.3 s, 0.7 s, and 0.4 s, respectively. Subsequently, we calculated the effective quantum yield of photochemistry for photosystem II (Φ_PSII_) and the total electron transport rate through photosystem II (ETR) using the following equations [49]:
where PPFD represents the light intensity and 0.45 represents the proportion of light energy absorbed by leaves allocated to photosystem II [50].
4.3. Calculation of the Mesophyll Conductance
Mesophyll conductance (gm) was calculated by combining the gas exchange data and chlorophyll fluorescence data with the following equation [51]:
where AN represents the net photosynthetic rate, Ci represents the intercellular CO_2_ concentration, Γ* represents the CO_2_ compensation point in the absence of mitochondrial respiration, and a typical value of 40 μmol mol^−1^ is used; Rd represents the dark respiration rate measured at night.
The chloroplast CO_2_ concentration (Cc) was calculated as follows [52,53]:
The maximum carboxylation rate of Rubisco (Vcmax) was calculated as follows [54]:
where Kc (404 μmol mol^−1^) and Ko (278 mmol mol^−1^) are the Rubisco Michaelis–Menten constants for CO_2_ and oxygen, respectively; O (210 mmol mol^−1^) is the oxygen concentration in the chloroplasts.
4.4. Quantitative Calculation of Photosynthetic Limitation
The quantitative calculation formula for the photosynthetic limiting factor is as follows [55]:
where Ls, Lm, and Lb represent the degree of the limitation of photosynthesis by gs, gm, and biochemical capacity, respectively, and gtot represents the overall CO_2_ diffusive conductance, with gtot and ∂AN/∂Cc calculated as follows, respectively:
The total CO_2_ diffusional limitation (Ld) was calculated as follows:
The time-integrated relative limitations imposed by Vcmax (σ_biochem_), gm (σ_mesophyll_) and gs (σ_stom_) during the 20 min light induction were calculated according to the detailed method described in [4].
4.5. Calculation of Electron Flow for Photorespiration
The rate of electron flow for photorespiration (JO) and Rubisco carboxylation (JC) were calculated according to the following equations [56]:
4.6. Statistical Analysis
Six independent leaves from six different plants were used for each measurement. One-way ANOVA (the Tukey comparison test) was used to determine whether significant differences (α = 0.05) existed between the low and high VPD treatments. The software SigmaPlot 10.0 was used for graphing and fitting.
5. Conclusions
Our findings indicate that the coordination of gs and gm during light induction is determined by gs kinetics. The effect of VPD on gm kinetics during light induction is species-dependent. Concomitantly, the flexibility of photorespiration plays an important role in the regulation of photosynthetic electron flow in response to the kinetics of gm. Therefore, we call for more studies to investigate the role of photorespiration during light induction with the change in gm kinetics under environmental stresses.
The reference list from the paper itself. Each links out to its DOI / PubMed record.
- 1Slattery R.A. Walker B.J. Weber A.P.M. Ort D.R. The Impacts of Fluctuating Light on Crop Performance Plant Physiol.2018176990100310.1104/pp.17.0123429192028 PMC 5813574 · doi ↗ · pubmed ↗
- 2Roden J.S. Pearcy R.W. Photosynthetic Gas Exchange Response of Poplars to Steady-State and Dynamic Light Environments Oecologia 19939320821410.1007/BF 0031767328313609 · doi ↗ · pubmed ↗
- 3Pearcy R.W. Sunflecks and Photosynthesis in Plant Canopies Annu. Rev. Plant Physiol. Plant Mol. Biol.19904142145310.1146/annurev.pp.41.060190.002225 · doi ↗
- 4Liu T. Barbour M.M. Yu D. Rao S. Song X. Mesophyll Conductance Exerts a Significant Limitation on Photosynthesis during Light Induction New Phytol.202223336037210.1111/nph.1775734601732 · doi ↗ · pubmed ↗
- 5Kaiser E. Kromdijk J. Harbinson J. Heuvelink E. Marcelis L.F.M. Photosynthetic Induction and Its Diffusional, Carboxylation and Electron Transport Processes as Affected by CO 2 Partial Pressure, Temperature, Air Humidity and Blue Irradiance Ann. Bot.201711919120510.1093/aob/mcw 22628025286 PMC 5218377 · doi ↗ · pubmed ↗
- 6Kaiser E. Morales A. Harbinson J. Fluctuating Light Takes Crop Photosynthesis on a Rollercoaster Ride Plant Physiol.201817697798910.1104/pp.17.0125029046421 PMC 5813579 · doi ↗ · pubmed ↗
- 7Way D.A. Pearcy R.W. Sunflecks in Trees and Forests: From Photosynthetic Physiology to Global Change Biology Tree Physiol.2012321066108110.1093/treephys/tps 06422887371 · doi ↗ · pubmed ↗
- 8Kimura H. Hashimoto-Sugimoto M. Iba K. Terashima I. Yamori W. Improved Stomatal Opening Enhances Photosynthetic Rate and Biomass Production in Fluctuating Light J. Exp. Bot.2020712339235010.1093/jxb/eraa 09032095822 · doi ↗ · pubmed ↗