Population Genetics, Demographic History, and Potential Distributions of the New Important Pests Monolepta signata (Coleoptera: Chrysomelidae) on Corn in China
Yang Liu, Yacong Ge, Liming Wang, Jingao Dong, Zhenying Wang, Yuyu Wang

TL;DR
This study explores the genetic diversity, population history, and future distribution of the corn pest Monolepta signata in China to aid in its management.
Contribution
The study provides new insights into the population genetics and potential future distribution of Monolepta signata in China.
Findings
M. signata populations show high genetic differentiation and weak gene flow between most populations.
The pest's population has undergone rapid expansion in recent history.
Northeast and north China are predicted to remain high suitability areas for M. signata in the future.
Abstract
The adults of Monolepta signata mainly feed on corn silks, anther and kernels at the filling stage, which result in great loss of yield and quality. Herein, we studied the population genetics and demographic history of M. signata based on mitochondrial genes (COI) and nuclear genes (ITS2, EF-1α). Based on the data of environmental factors and known sample points, the fitness of M. signata was also analyzed according to mathematical statistics and ecological niche theory. The distribution of the suitable habitat of M. signata in China and center-of-mass transfer under different climatic scenarios in the present and future time periods were predicted. The areas of potential serious damage in the future were also predicted. The population of M. signata has also experienced rapid expansion. The damage caused by M. signata in Xinjiang will be worse and more attention should be paid on.…
Genes, proteins, chemicals, diseases, species, mutations and cell lines named across the full text — each resolved to its canonical identifier and authoritative record.
Click any figure to enlarge with its caption.
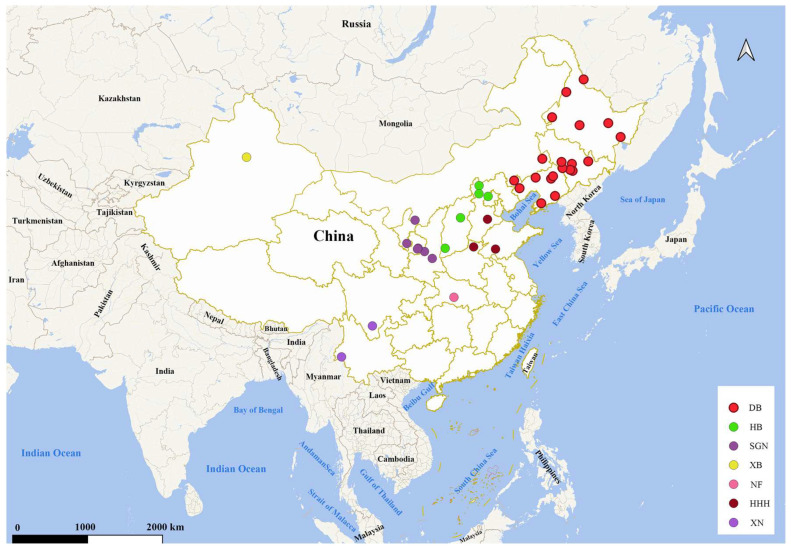 Figure 1
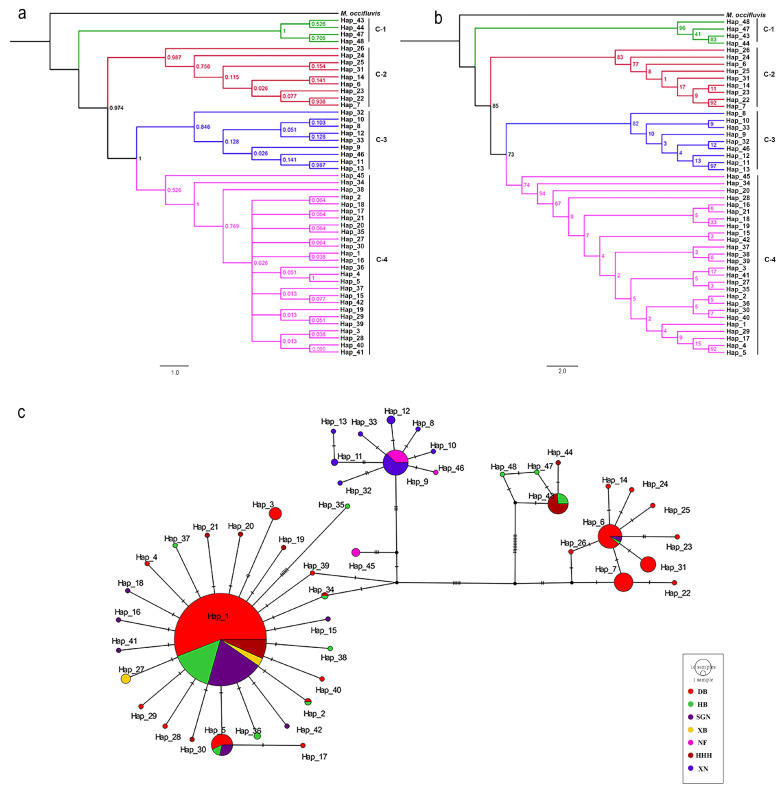 Figure 2
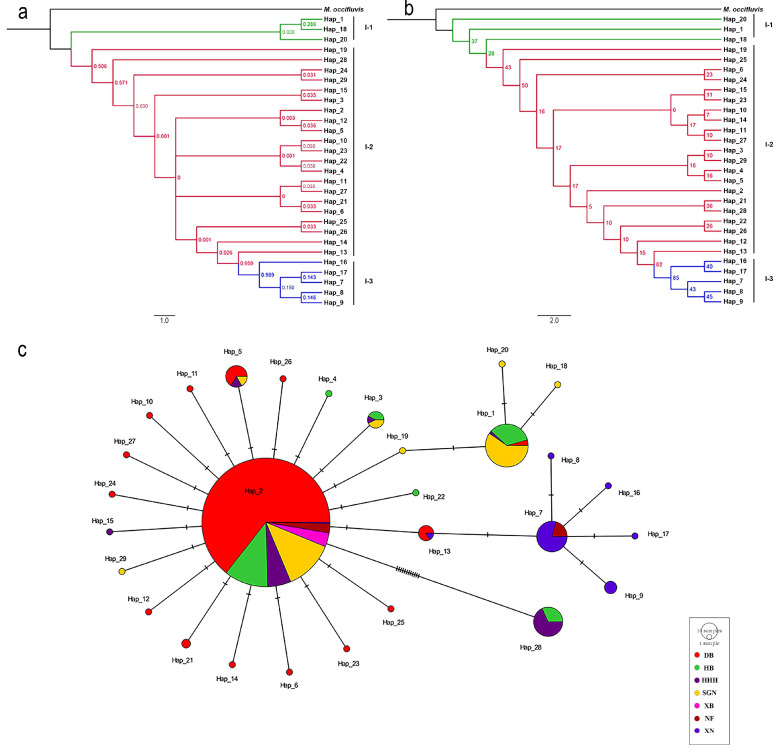 Figure 3
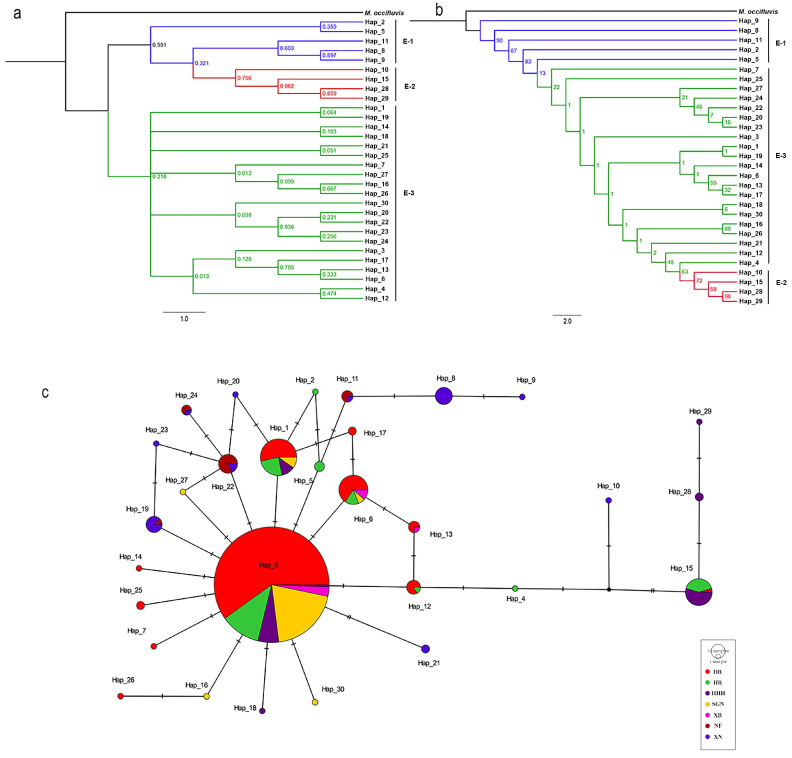 Figure 4
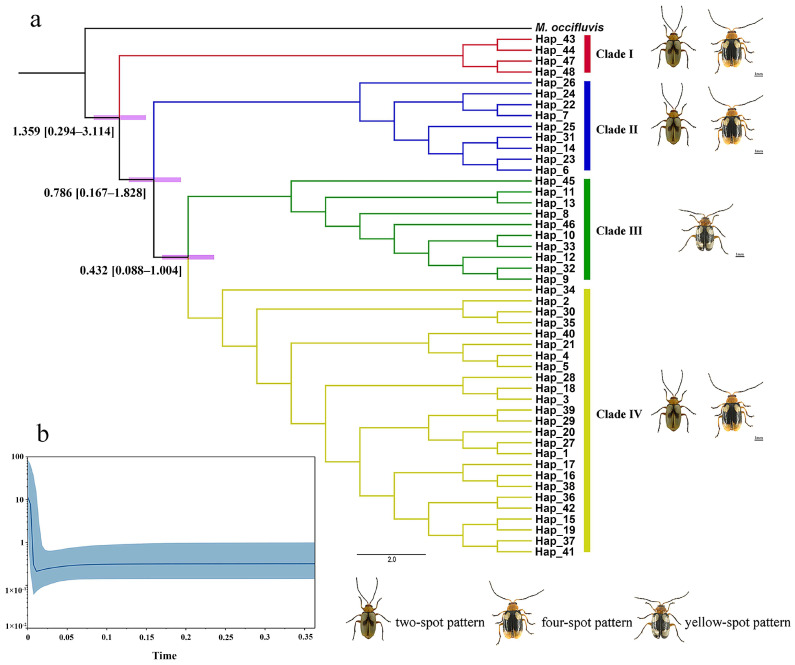 Figure 5
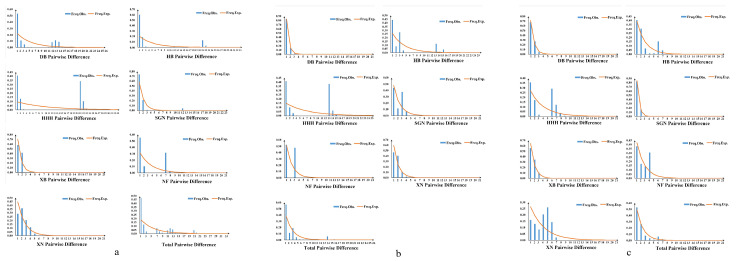 Figure 6
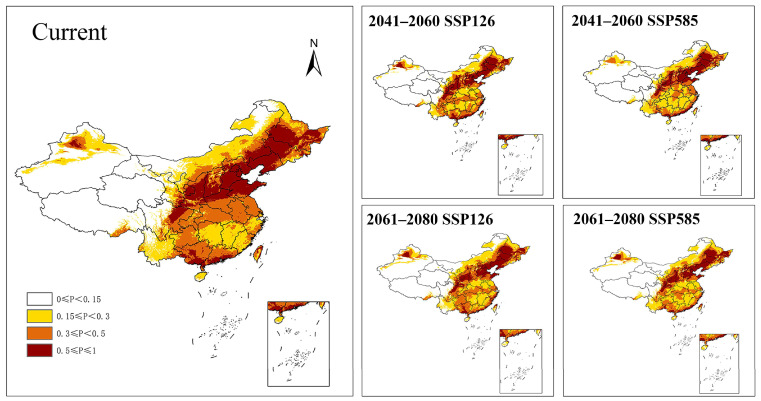 Figure 7
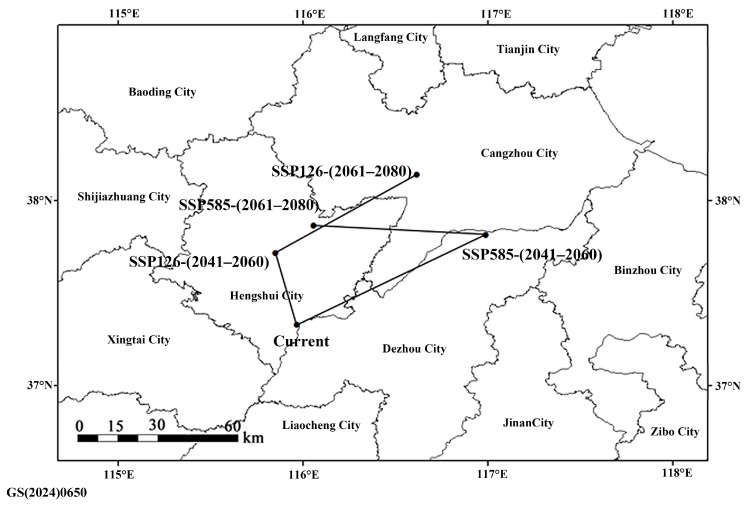 Figure 8
- —National Natural Science Foundation of China
- —Basic Research Project of Shijiazhuang for the University in Hebei Province
- —Science and Technology Planning Project of Baoding
- —China Agriculture Research System of MOF and MARA
Peer Reviews
No public reviews on file for this paper yet. If you reviewed it on a platform where reviews are public (OpenReview, ICLR, NeurIPS, ICML), you can paste yours below so the community can read it here.
Videos
No videos yet. Explain this paper in a talk, walkthrough, or lecture? Add one.
Taxonomy
TopicsInsect Resistance and Genetics · Insect-Plant Interactions and Control · Forest Insect Ecology and Management
1. Introduction
Monolepta signata (Coleoptera, Chrysomelidae) (Oliver 1808) are polyphagous pest widely distributed in China, whose hosts include ferns, dicotyledons and monocotyledons, with a total of 218 species (including subspecies and varieties) in 45 families of three classes [1]. Monolepta signata has a long damage period and strong adaptability to high temperatures [2]. Adults mainly feed on corn silks, anthers and kernels during the grain-filling stage, causing significant yield and quality losses. Feeding damage also facilitates fungal infections (e.g., Fusarium spp.), leading to corn ear rot [3,4,5,6,7,8]. M. signata damages cotton bracts and corollas, resulting in incomplete corolla and stamen exposure, which could affect cotton production and quality, particularly under heavy infestation [9]. M. signata can also infest vegetable leaves, meristems, and other plant parts [10]. M. signata was not only distributed in China, Russia (Siberia), Korea, Japan [11] but also in Bangladesh, Nepal and India [12,13,14,15,16,17]. The original distribution area of M. signata includes East Asia and Southeast Asia, specifically in regions such as Russia (Siberia), China, South Korea, Japan, the Philippines, Indonesia, Singapore, Malaysia, northern Vietnam, Myanmar, and eastern India [18,19]. Over time, the distribution range of M. signata has significantly expanded, spreading across nearly 30 provinces, autonomous regions, and municipalities in China, with particular severe damage reported in northern regions of China [20,21].
Due to changes in climate and cultivation practices, the reports of damage caused by M. signata have been increasing since 2000. In 2008, M. signata caused severe damage in Chencang District, Baoji City, Shaanxi Province, affecting 75.3% of the farmland, with the infestation rate reaching 100% in summer cornfields [22]. The corn silks were completely gnawed off, resulting in a yield loss of approximately 15% in the damaged fields in the most severely affected areas [22]. In 2010, cornfields in Qiqihar City, Heilongjiang Province, were severely damaged by M. signata, with the total affected area across the city reaching 303,000 hectares [23]. In 2014, large-scale damage caused by M. signata occurred in Xinxiang County, Henan Province, where 70% of the farmland was affected and the damaged plant rate reached 27% [24]. The occurrence regions of this pest have also expanded, resulting in an escalating economic loss of many crops such as soybeans, corn, peanuts, cotton, millet, and vegetables [25,26]. In recent years, the occurrence acreage of M. signata on corn has been increasing in China. M. signata has become an important pest on spring corn in north China and irrigated corn in northwest China as well as summer corn in the HuangHuaiHai region [27]. In particular, the northern part of China has suffered severe damage. Currently, most of the studies on M. signata are focused on the pattern of occurrence and effective control [3,4,28,29,30]. However, there are few studies on population genetics and demographic history of M. signata [31,32,33].
Phylogeography is an integrative field of science linking micro and macro evolutionary processes, contributing to the inference of vicariance, dispersal, speciation, and other population-level processes [18]. Phylogeography can provide strong support for addressing the relationships between current distribution patterns of species and climate change, geographic isolation, as well as clarify the timing of divergence of clades, origins and diffusion paths of species [21,34,35,36]. The maximum entropy model (MaxEnt) [37] is based on the maximum entropy theory, with species distribution data and climate variables as the foundation, and simulates the potential geographical distribution range of species through mathematical models [10]. The study of genetic diversity and population dynamics of pest populations not only clarifies scientific issues such as pest occurrence, gene exchange, genetic evolution and pesticide resistance, but also provides a scientific basis for optimizing ecological management and developing integrated pest management (IPM) [38,39].
Molecular markers, due to their advantages such as the independence from gene expression status, high reproducibility, and excellent stability, have been extensively utilized in multiple disciplines, including genetic structure analysis, assessments of population genetic diversity, species identification, phylogeography, and phylogenetic relationship investigations [40,41,42,43]. Among various molecular markers, mitochondrial DNA (mtDNA) is widely used in phylogenetic studies due to its structural simplicity, ease of amplification, and higher evolutionary rate, which enhances resolution in closely related species [44,45,46,47]. Nuclear gene sequences are widely used in phylogenetic reconstruction, gene loss analysis, population genetic structure, and biogeographic studies [48]. The Internal Transcribed Spacer (ITS) regions within nuclear rDNA are characterized by low selection pressure and rapid evolutionary rates, making them suitable for identifying closely related insect species, reconstructing phylogenetic relationships, and conducting population-level studies [49,50]. Notably, ITS2 has been widely applied in species typing [51,52] and phylogeographic investigations [53]. The eukaryotic elongation factor EF-1α plays a critical role in protein translation [54]. Numerous studies have employed EF-1α in conjunction with mitochondrial genes to explore insect genetic diversity and phylogeographic patterns [55,56]. The combination of mitochondrial and nuclear genes, which exhibit distinct inheritance patterns and evolutionary rates, offers a more reliable approach for investigating population genetic structure and inferring population dynamics [57].
Herein, we studied the population genetics and demographic history of M. signata based on mitochondrial genes (COI) and nuclear genes (ITS2, EF-1α). Based on the data of environmental factors and known sample points, the suitability areas of M. signata were also analyzed according to mathematical statistics and ecological niche modeling. The distribution of suitability areas of M. signata in China and geographic distribution shifts under different climatic scenarios in the present and future time periods were predicted. The areas of potential serious damage in the future were also predicted.
2. Materials and Methods
2.1. Sample Collection
The specimens used in this study were collected from Heilongjiang, Jilin, Liaoning, Inner Mongolia, Xinjiang, Hebei, Shaanxi, Yunnan, Sichuan, etc. (Table S1). A total of 568 specimens of M. signata from 38 localities were collected, and their coordinates were plotted using QGIS v.3.28 [58] (Figure 1). The administrative division map of China was downloaded from the National Geomatics Center of China (http://ngcc.cn/, accessed on 25 February 2025). Adult specimens of M. signata were sampled during 2020 and 2021 from almost all major corn planting areas in China, to comprehensively represent the current distribution of M. signata. The M. occifluvis specimens collected in 2018 were used as the outgroup for phylogenetic analyses (Table S1). All specimens were preserved in 95% ethanol and stored at −20 °C at Hebei Agricultural University, Baoding, China.
2.2. DNA Extraction and Sequencing
Genomic DNA was extracted from the thoracic muscle tissue using the Rapid Genomic DNA Kit (Biomed Biological Technology Co., Ltd., Beijing, China) following the instructions. The DNA concentration was measured using a nucleic acid protein analyzer (Thermo Scientific, Waltham, MA, USA) and preserved at −20 °C. The PCR primers used in this study were synthesized by Biomed (Beijing, China). COI and ITS2 were amplified using the 25 μL system: 2× Taq PCR Mix 12.5 μL, Forward primer 1 μL, Reverse primer 1 μL, template DNA 1 μL, and ddH_2_O 9.5 μL. The PCR conditions were: initial denaturation at 95 °C for 30 s; 40 cycles of denaturation at 95 °C for 10 s, annealing (COI: 48 °C, ITS2: 58 °C) for 50 s, and extension at 65 °C for 1 min; followed by a final extension at 65 °C for 10 min. The barcoding region of COI was amplified using the primers S-jerry (5′-CAACATYTATTYTGATTYTT-3′) and S-pat (5′-GCACTAWTCTGCCATATTAGA-3′) [59]. And ITS2 was amplified using the primers ITS-J-5.8S (5′-TGGRTCGATGGAGAACGCAGC-3′) and ITS2-N-610 (5′-TCTCACCTGCTCTGAGGTCGATAT-3′) [60]. The nested PCR procedure of EF-1α gene fragment was conducted with reference to two pairs of primers, i.e., EFS149 (5′-GARAARGARGCNCARGARATGGG-3′) and EFA1106 (5′-GTATATCCATTGGAAATTTGACCNGGRTGRTT-3′), EF1a-SN (5′-TGGGAAAAGGYYCCTTCAAATATGC-3′) and EF1a-AN (5′-CRTRACCACGACGYAATTCTTTGACAG-3′) [61]. PCR products were examined using 1% agarose gels with ethidium bromide following electrophoresis and sent to Biomed (Beijing, China) for sequencing in both directions.
Bidirectional sequencing reads were assembled in Cexpress [62]. COI and EF-1α sequences were validated by translating to amino acids in DNAMAN v.6.0 (Lynnon Biosoft, San Ramon, CA, USA) and then blasting with sequences on NCBI (https://www.ncbi.nlm.nih.gov/, accessed 6 May 2024) while the ITS2 sequences were verified by blasting with sequences on NCBI directly.
2.3. Genetic Diversity and Historical Dynamics Analysis
Single-nucleotide polymorphism (SNPs) and parsimony-information-sites were calculated using MEGA v7.0 [63]. The extent of haplotype diversity (Hd) and nucleotide diversity (π) of each population were calculated using DnaSP v5.0 [64]. The haplotype network was constructed using PopART v1.7 [65] based on the median-joining algorithm. The genetic differentiation indices and analysis of molecular variance (AMOVA) of different M. signata geographical populations were analyzed by Arlequin v3.5 [66]. The genetic distances within and among populations were calculated using MEGA v7.0 [63] based on the Kimura 2-parameter genetic distance model.
Mismatch distribution analysis was conducted in DnaSP v5.0 [64] to test whether the population of M. signata had undergone recent demographic expansion. Tajima’s D [67] and Fu’s Fs [68] neutrality tests were performed using Arlequin v.3.5 [66]. The Bayesian Skyline Plot (BSP) was plotted using BEAST v1.8 [69] based on COI gene under the GTR + G model. A Coleoptera-specific COI substitution rate of 1.77% per million years [70] was applied to calibrate the molecular clock in BEAST v1.8 [69]. The BSP was visualized in Tracer v1.4 [71] using the posterior tree distribution from BEAST v1.8 [69].
2.4. Phylogenetic Analysis
Phylogenetic trees were constructed based on COI, ITS2 and EF-1α genes of M. signata based on maximum likelihood (ML) and Bayesian inference (BI) methods using PhyloSuite v1.16 [72] with M. occifluvis as the outgroup. The best models of ML analyses were selected by ModelFinder [73], i.e., GTR + T + F for COI, HKY + G + F for ITS2 and K80 + I for EF-1α. ML trees were inferred using IQ-TREE v.1.6.10 [74] with 1000 ultrafast bootstraps. BI analyses were conducted using MrBayes v.3.2.2 [75] under the best substitution models selected by ModelFinder [73], i.e., TIM2 + I + F for COI, HKY + G4 + F for ITS2 and TNe + R2 for EF-1α. Bayesian Markov chain Monte Carlo (MCMC) simulations were run for 1 × 10^8^ generations, sampling every 5000 generations and stopped when the average standard deviation of split frequencies < 0.01. The first 25% trees were discarded as burn-in. Finally, the resulting trees were visualized by Figtree v.1.4.1 [76].
2.5. Divergence Time Analysis
Molecular calibration of evolutionary rates for COI gene in Coleoptera (1.77% bases per million years) [70] was used to estimate the divergence time since lack of appropriate fossil records. The divergence times among M. signata haplotypes and its geographic populations were estimated using BEAST v1.8 [69] under the GTR + G model with strict molecular clock. Two independent MCMC runs were performed for 1 × 10^8^ generations with sampling at every 5000 generations. The first 10% trees were removed as burn-in. Finally, the tree was visualized by Figtree v1.4.1 [74].
2.6. Potential Distribution of M. signata
There were 144 distribution points of M. signata in China used in this study, including field collection points and data points according to related literature and the Global Biodiversity Information Facility (GBIF) database.
To reduce the bias in the amount of occurrence data on the area, the localities were selected using ENMtool 1.3 [77], keeping only one average data for multiple distribution points located within the same raster (~1.5 km × ~1.5 km) (Table S3). There were 19 bioclimatic variables (BIO) in WorldClim (https://www.worldclim.org/data/v1.4/worldclim14.html, accessed on 15 May 2024) cited to model the distribution of M. signata. Pearson correlation analysis of the 19 variables was performed using R package v.3.4.2 [78], selecting variable factors with correlation coefficients |R| < 0.8. The spatial resolutions used for climate variable data were 2.5 arc-minutes. In order to investigate the changes in the distribution pattern and range of M. signata under different climate scenarios, the latest Coupled Model Intercomparison Project Phase 6 (CMIP6) Shared Socioeconomic Pathways (SSP) data were used in this study. Two climate scenarios (SSP126 and SSP585) for the present (1970–2000) and future (2041–2060 and 2061–2080) were selected.
The suitable geographic distribution of M. signata in China was analyzed using MaxEnt v 3.4.1 [79]. The maximum training sensitivity plus specificity logistic threshold (MTSS) was considered to be the most accurate method that predicted the presence or absence of species. The average of 10 replicates of the MTSS was used as a reference. The suitability zone of M. signata was classified into four classes according to the Natural Breaks in ArcToolbox of ArcGIS [80], with 0 ≤ p < 0.15 (non-suitability zone), 0.15 ≤ p < 0.3 (low suitable zone), 0.3 ≤ p < 0.5 (medium suitable zone), and 0.5 ≤ p ≤ 1 (high suitable zone) [81]. The spatial changes in overall suitable habitats were analyzed through the changes in centroid position at different periods of M. signata, taking their suitability areas as a whole. The direction and distance changes in fitness zone of M. signata were analyzed using the SDMtoolbox of ArcGIS [80].
3. Results
3.1. Genetic Structure
According to the geographical distribution, all samples were divided into seven geographical populations, namely DongBei population (DB), HuaBei population (HB), HuangHuaiHai population (HHH), ShanGanNing population (SGN), XiBei population (XB), NanFang population (NF) and XiNan population (XN).
Comparative analysis of mitochondrial (COI) and nuclear (ITS2, EF-1α) markers revealed distinct diversity patterns (Table 1). Geographic heterogeneity was evident in the genetic diversity patterns of the studied populations. The XB population exhibited the lowest diversity values (COI: π = 0.003; ITS2: π = 0.002), suggesting long-term isolation likely driven by the arid environmental conditions and geographic barriers in China’s northwestern regions. In contrast, the SGN population displayed a nuclear-specific reduction in diversity (EF-1α: π = 0.0008). The mitochondrial COI exhibited the highest haplotype diversity (Hd = 0.526) and nucleotide diversity (π = 0.006), consistent with its rapid evolutionary rate and maternal inheritance mode, whereas nuclear markers showed reduced variation (ITS2: Hd = 0.433, π = 0.004; EF-1α: Hd = 0.472, π = 0.002). Notably, haplotype sharing was limited across populations, with only 15% (7/48) of COI haplotypes distributed in multiple regions, compared to 24–33% shared haplotypes in nuclear loci (7/29 for ITS2; 10/30 for EF-1α), suggesting a stronger phylogeographic structure in the mitochondrial genome (Table S2).
3.2. Phylogenetic Analyses
The haplotype distributions of the three genes are summarized in Table S2, with COI, ITS2, and EF-1α comprising 48, 29, and 30 haplotypes, respectively. Phylogenetic reconstructions based on Bayesian inference (BI) and maximum likelihood (ML) methods yielded congruent topologies for each gene (Figure 2, Figure 3 and Figure 4). Median-joining networks further corroborated these phylogenetic relationships, revealing distinct clustering patterns among markers with COI resolved four major clades, whereas ITS2 and EF-1α grouped samples into three clades, likely reflecting differences in evolutionary rates and inheritance modes. Dominant haplotypes varied across markers. For COI, Hap_1 was the most frequent haplotype, predominantly distributed in northern populations (DB, HB, HHH, SGN, XB). For ITS2, Hap_2 was the most widespread, occurring across all seven geographic groups. For EF-1α, Hap_2 also dominated, presenting in six populations (DB, HB, HHH, SGN, XB, XN). Based on the phylogenetic tree topology and haplotype network structure, mitochondrial genes supported the division of M. signata from different regions of China into four distinct clades, whereas nuclear genes supported three major lineages.
3.3. Population Genetic Analysis
There were significant differences between the HHH population and the other six populations based on the pairwise differentiation coefficient (Table S6). The HHH population showed significant genetic differentiation compared to the DB, SGN, NF and XN populations (Fst > 0.25, p < 0.05) based on COI, to DB, SGN and XN populations (Fst > 0.25, p < 0.05) based on ITS2, and to DB, SGN and NF populations (Fst > 0.25, p < 0.05) based on EF-1α. There are 61.90%, 80.95% and 71.43% of Fst values exhibit high genetic differentiation (Fst > 0.15) in COI, ITS2 and EF-1α, respectively. Analysis of gene flow among different populations showed that there are 61.90%, 71.43% and 61.90% of Nm values smaller than 1 in COI, ITS2 and EF-1α, respectively, indicating that the gene flow of most populations were weak. Results from AMOVA analysis revealed that the main source of genetic variation existed within populations, whereas the remaining came from variation among populations for all these three genes (Table 2).
3.4. Divergence Time and Historical Demographic Reconstruction
The divergence time was estimated based on the phylogeny of the COI gene (Figure 5a). The initial divergence with extant M. signata in China was estimated to occur at 1.359 Ma (95% HPD = 0.294–3.114 Ma). M. signata further separated into Clade I at 1.359 Ma (95% HPD = 0.294–3.114 Ma), which comprised the HB and HHH populations, exhibiting both “two-spot type” and “four-spot type” patterns. Clade II, which also included “two-spot type” and “four-spot type” patterns, including DB, SGN, and HB populations, diverged from Clade III + Clade IV at 0.786 Ma (95% HPD = 0.167–1.828 Ma). Clade III, which included NF and XN populations with “yellow-spot type” patterns, diverged from Clade IV at 0.432 Ma (95% HPD = 0.088–1.004 Ma). Clade IV, including DB, HB, SGN, XB, and HHH populations, had both “two-spot type” and “four-spot type” patterns.
Tajima’s D and Fu’s Fs values of all populations for these three genes were significantly negative (p < 0.05), indicating recent population expansion occurred in M. signata (Table 3). The BSP results showed that the population of M. signata may have experienced three main demographic history periods (Figure 5b). The effective population size of M. signata remained relatively stable before approximately 0.075 Ma. There was a slow contraction trend between 0.075 and 0.010 Ma. The effective population size of M. signata has been experiencing rapid and sustained expansion from 0.010 Ma until now. Meanwhile, the mismatch distribution analysis based on data from geographic populations of M. signata did not display a single-peak curve, indicating that the population has not experienced recent expansion, which is conflicted with the results of the neutrality tests (Figure 6). We have also conducted mismatch distribution analysis using data from each genetically divergent clade instead of data from geographic populations, which is consistent with the results of geographic population (Figure S1).
3.5. Potential Distribution Prediction
A relatively high AUC value was obtained from the current potential distribution (AUC = 0.984), indicating good predictive model performance (Figure S2). Correlation analysis and model contribution screening of 19 climate variables were shown in Figure S2, with nine climate variables with high adaptability selected in this study. The contribution rate of environmental variables to the distribution of M. signata was shown in Table S7.
The climate variables that contributed more than 10% to the prediction of the MaxEnt model were bio18, bio4, and bio10, while the cumulative contribution of the three variables accounted for 66.8%. The replacement significance values that contributed more than 10% were bio4, bio1 and bio5, while the cumulative replacement significance values of the three climate variables accounted for 87.9%. The Jackknife test of the regularized training gains for climate variables in MaxEnt demonstrated that four environmental variable factors, i.e., bio1, bio10, bio18, and bio5, have relatively large gains when used alone (Figure S3). Five variables (bio1, bio4, bio5, bio10 and bio18) dominated the distribution of M. signata in China. The response curve of main environmental variables was shown in Figure S4. The optimal mean annual temperature of M. signata was 5 °C. The optimum value for the variance in temperature change was 1500. The optimal maximum temperature in the hottest month was 28 °C. The optimum average temperature during the warmest season was 22 °C. In the warmest season, the occurrence rate of M. signata increases with the increase in precipitation until the precipitation reaches 2500 mm.
The prediction of the suitability areas of M. signata in China under three different periods is shown in Figure 7. In the current period (1970–2000), Qinghai Province and Xizang Autonomous Region are areas where M. signata is distributed sporadically, while other regions show potential distribution areas. The current optimal habitat of M. signata was mainly concentrated in the Northeast Plain, North China Plain, Middle and Lower Yangtze River Plain, Sichuan Basin, Loess Plateau and Junggar Basin. The high-suitability area of M. signata in China accounted for 15.52%, while the medium-suitability area accounted for 20.42% and the low-suitability area accounted for 20.10%, respectively (Table 4).
The low- suitability areas of M. signata in China under the future climate scenarios SSP126 and SSP585 increased, while the medium-suitability and high-suitability areas decreased, compared to the results of the distribution projections under current climate scenarios (Table 4). The pattern of suitability areas was more variable in the south-central region. There was a gradual shift from high and medium to low-suitability areas especially in Shandong, Henan, Jiangsu, Anhui, Hubei, Hunan, Jiangxi and Fujian Province (Figure 7).
The center of mass of current suitability areas of M. signata was located in Gucheng County, Hengshui City, Hebei Province. From the current to the future (2041–2060 and 2061–2080) periods, the center of gravity distribution will still be in north China. The direction and distance of the center of gravity changed slightly under different climatic conditions (Figure 8). Under the SSP126 scenario, the centroid of the suitability areas shifted slightly to the northwest first and then to the northeast. Under the SSP585 scenario, its centroid tended to shift to the northeast first and then to the northwest. Further, the habitats of M. signata will all shift to the north in the future, indicating that the harm of M. signata will increase in the northern part of China in the future.
4. Discussion
4.1. Mitochondrial–Nuclear Discordance in Phylogenetic Resolution of M. signata
In the phylogenetic results, mitochondrial genes supported the division of M. signata from different regions of China into four distinct clades, whereas nuclear genes resolved three major lineages. The observed mitochondrial–nuclear discordance aligns with theoretical expectations, i.e., mitochondrial genes, due to their haploid and uniparental inheritance, have a smaller effective population size (effective population size ≈ 1/4 of nuclear genes), leading to faster lineage sorting and higher resolution of recent divergence events [82]. In contrast, nuclear genes, with their larger effective population size and biparental inheritance, are more likely to retain ancestral polymorphisms, obscuring finer phylogenetic signals [83].
4.2. Phenotypic Variation and Phylogeographic Patterns
The distribution of “two-spot type” and “four-spot type” across clades I, II, and IV, contrasted with the exclusive presence of the “yellow-spot type” in clade III, suggests a strong association between phenotypic traits and geographic regions (Figure 5a). This pattern likely results from continuous selection pressures along environmental gradients, leading to gradual phenotypic divergence and the formation of distinct ecotypes [84]. The geographic separation of the “four-spot type” and “yellow-spot type” populations, coupled with their genetic differentiation, may indicate ongoing speciation driven by local adaptation [85]. Future studies should focus on validating these patterns through offspring analysis and exploring the genetic basis of phenotypic variation.
4.3. Mitochondrial–Nuclear Discordance and Demographic History
The higher haplotype diversity (Hd > 0.5) and nucleotide diversity (π > 0.005) observed in COI, compared to the lower values in ITS2 and EF-1α (Hd < 0.5, π < 0.005), reflect the faster evolutionary rate and smaller effective population size of mitochondrial DNA [86]. The relatively low nucleotide diversity in nuclear genes, despite moderate haplotype diversity, may indicate historical bottlenecks followed by rapid population expansion [87,88]. During bottlenecks, mitochondrial diversity is more severely reduced due to its haploid nature, whereas nuclear genes retain higher haplotype diversity through recombination [89,90]. Post-bottleneck, mitochondrial diversity recovers more slowly, while nuclear genes rapidly accumulate new haplotypes through mutation and recombination [91]. The observed patterns are consistent with rapid population expansion, during which mitochondrial diversity increased due to its higher mutation rate, while nuclear diversity remained constrained by recombination [92].
4.4. Genetic Differentiation and Gene Flow Barriers
The genetic differentiation analysis based on COI, ITS2 and EF-1α showed significant differences between the HHH population and the other six populations, and significant genetic differentiation with some populations (Fst > 0.25, p < 0.5). The HHH population had a large genetic distance from other geographical populations. There was a negative correlation between gene flow and the genetic differentiation coefficient. The HHH population may have less gene exchange with other populations due to geographical barriers or other reasons, resulting in significant differences in the genetic differentiation coefficient between populations. Geographical isolation is considered an important factor affecting the genetic structure of species [93]. The HuangHuaiHai region is surrounded by mountains on three sides and faces the sea on one side. Coupled with the weak flight ability of M. signata [86], the obstruction of mountains such as the Qinling Mountains and the Taihang Mountains might be the main reasons for the large genetic distance and significant differentiation between the HHH population and other populations in China [94]. In contrast, gene flow between Chinese populations and those in Japan and North Korea may result from the dispersal of adult individuals by air currents. It is necessary to collect additional samples from countries and regions surrounding China to explore the formation causes of the current distribution pattern of M. signata.
4.5. Human Impacts and Host-Associated Differentiation
The lack of clear phylogeographic structure in China, as evidenced by the widespread distribution of haplotypes in the HB population, may reflect human-mediated dispersal through agricultural activities. Similar patterns have been observed in other pests, such as Sitobion avenae, where host crops significantly influence genetic structure [95]. Future studies should expand sampling to include more natural populations and different host crops to better understand the role of host-associated selection in shaping genetic diversity.
4.6. Environmental Constraints and Future Distribution
Temperature and precipitation were identified as the dominant factors limiting the distribution of M. signata, consistent with its known ecological requirements [96,97,98]. Under future climate scenarios (SSP126 and SSP585), northern regions (northeast China, north China, and Xinjiang) are projected to remain highly suitable, likely due to the expansion of corn and cotton cultivation, which are primary host crops [99,100,101,102]. In contrast, central and southern regions may experience reduced suitability, with high and medium suitable areas transitioning to low suitability. The northward shift of the centroid of M. signata’s distribution suggests increasing pest pressure in northern agricultural zones, necessitating targeted monitoring and control strategies.
5. Conclusions
This study provides a comprehensive analysis of the genetic diversity, population historical dynamics, and potential distribution of M. signata. Key findings reveal high genetic differentiation among populations, with larger genetic distances based on COI and ITS2 compared to EF-1α, indicating marker-specific evolutionary patterns driven by differences in effective population sizes and mutation rates. The primary source of genetic differentiation stems from significant intraspecific variation within populations, highlighting the role of local adaptation and geographic isolation in shaping population structure. Future distribution predictions suggest that northeast China, north China, and Xinjiang will remain highly suitable for M. signata, with increasing pest pressure in northern agricultural zones due to the expansion of corn and cotton cultivation. In central and southern China, shifts in suitability patterns are evident, with areas transitioning from low to medium suitability likely emerging as new hotspots for pest outbreaks, necessitating proactive monitoring and control measures.
Our findings have important implications for pest management. The genetic structure of M. signata provides a foundation for understanding its evolutionary history and adaptive potential, while the predicted distribution patterns offer critical insights for developing targeted monitoring and control strategies. Future research should focus on expanding sampling to include more natural populations and additional host crops, investigating the genetic basis of local adaptation and host-associated differentiation, and integrating genomic data to refine predictions of M. signata’s response to climate change.
The reference list from the paper itself. Each links out to its DOI / PubMed record.
- 1Gao Y. Xu W. Shi S.S. Cui J. Xu B. A list of the host plants of the Monolepta hieroglyphica Hubei Agric. Sci.20175686586910.14088/j.cnki.issn 0439-8114.2017.05.018 · doi ↗
- 2Ma X.J. Zhang Z.H. Wang Z. Zhang Y.X. Chen J. Effects of brief exposure to high temperature on free amino acids, total sugar and trehalose of female adult Monolepta hieroglyphica (Motschulsky)Plant Prot.20184411111510.16688/j.zwbh.2017120 · doi ↗
- 3Wang L.R. Liu B.X. Fu H. Occurrence, damage and control measures of the leaf beetle of the long-tarsometatarsus in maize field Shanxi Agric. Sci.20062123131
- 4Wang L.R. Liu B.X. Fu H. Occurrence, damage and control of Monolepta hieroglyphica in maize field China Agric. Technol. Promot.20062244
- 5Zhao Y.M. Zhao W.Q. Analysis the causes and control measures of corn northern leaf blight and Monolepta hieroglyphica (Motschulsky) insect pest China Agric. Inf.201325112
- 6Shi J. Wang Z.Y. He K.L. Occurrence trend and cause analysis of summer corn diseases and insect pests in Huang-Huai-Hai area Plant Prot.200556365
- 7Zheng X.M. Xu Z. Guo J.F. Wang L.D. Luo B.J. Wang L.X. Li Q.C. Liu Y. Han Y.H. Wang Z.Y. Influences of damaged silks by Monolepta hieroglyphica (Motschulsky) on corn yield Plant Prot.20214710911410.16688/j.zwbh.2020491 · doi ↗
- 8Liu J.H. A research on laws of host selection migration and optimum period of chemical to Monolepta hieroglyphica (Motschulsky)Master’s Thesis Jilin Agricultural University Jilin, China 2018