Comparative Analysis of the Mitochondrial Genomes of Three Species of Elmidae (Coleoptera: Dryopoidea)
Zeliang Qin, Na Li, Yaqi Mo, Juping Wang, Yunfei Peng, Fan Song

TL;DR
This study compares the mitochondrial genomes of three elm beetle species to better understand their evolutionary relationships and taxonomy.
Contribution
The paper provides new mitogenomic data for Elmidae and highlights ambiguities in their taxonomic classification.
Findings
The three Elmidae species have similar mitochondrial genome structures but differ from typical Coleoptera gene arrangements.
Phylogenetic analysis shows Elmidae is monophyletic within Dryopoidea but suggests taxonomic revisions at lower levels.
COX1 and nad4L are the most conserved protein-coding genes in the studied species.
Abstract
Elmidae (Coleoptera: Dryopoidea) is a widespread family of aquatic beetles that currently contains about 151 genera with approximately 1500 species. The phylogenetic positions of the intrafamilial taxonomic groups remain ambiguous. To further understand the position of Elmidae within Coleoptera and the relationships among the subfamily, tribe, and genus levels, three complete mitochondrial genomes of Elmidae (Cuspidevia jaechi, Grouvellinus longiusculus, and Stenelmis punctulata) were sequenced, annotated, analyzed, and compared. The nucleotide composition, genome organization, and codon usage of the three species were highly similar. However, their gene arrangement differed from that of typical mitochondrial genomes in Coleoptera. Phylogenetic analysis indicates that the higher taxonomic groups within Elmidae require further supplementation. This study contributes to the mitogenomic…
Genes, proteins, chemicals, diseases, species, mutations and cell lines named across the full text — each resolved to its canonical identifier and authoritative record.
Click any figure to enlarge with its caption.
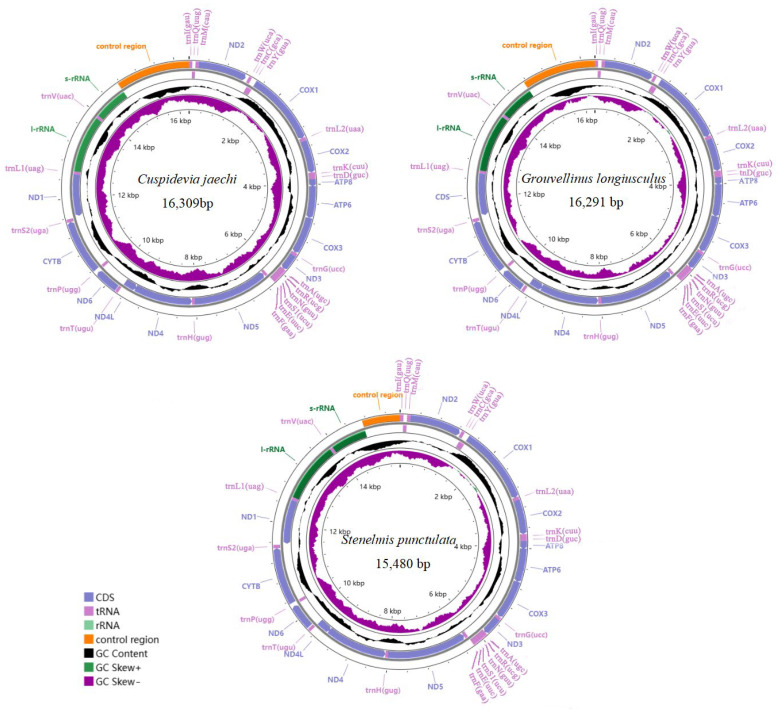 Figure 1
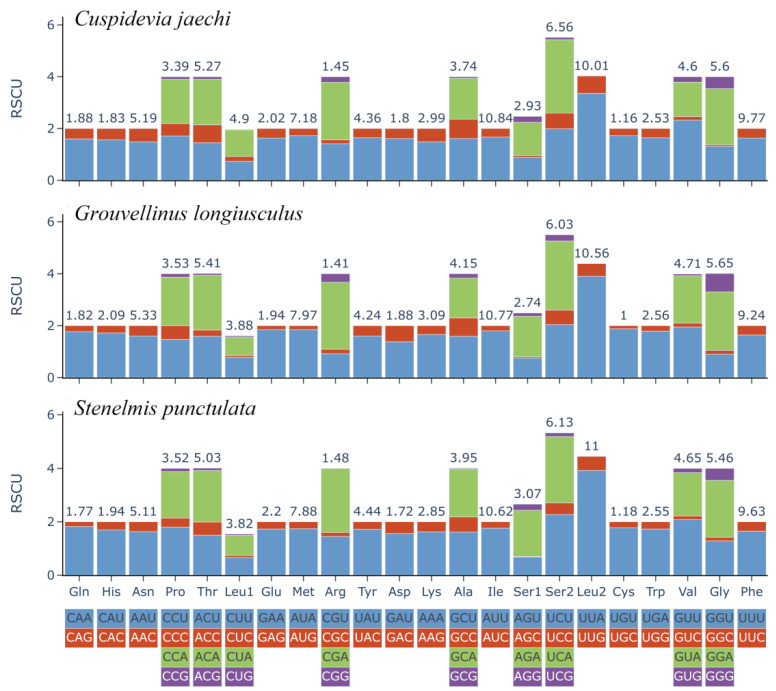 Figure 2
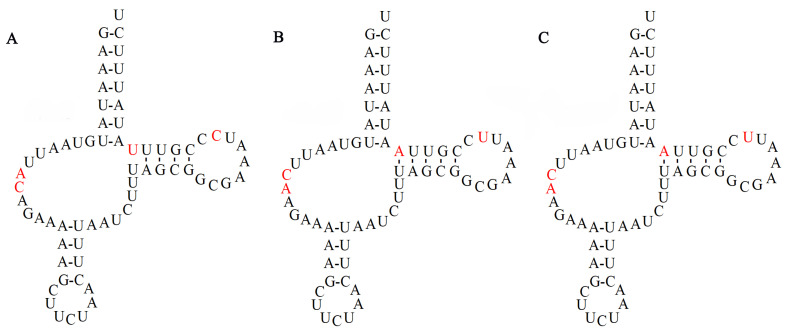 Figure 3
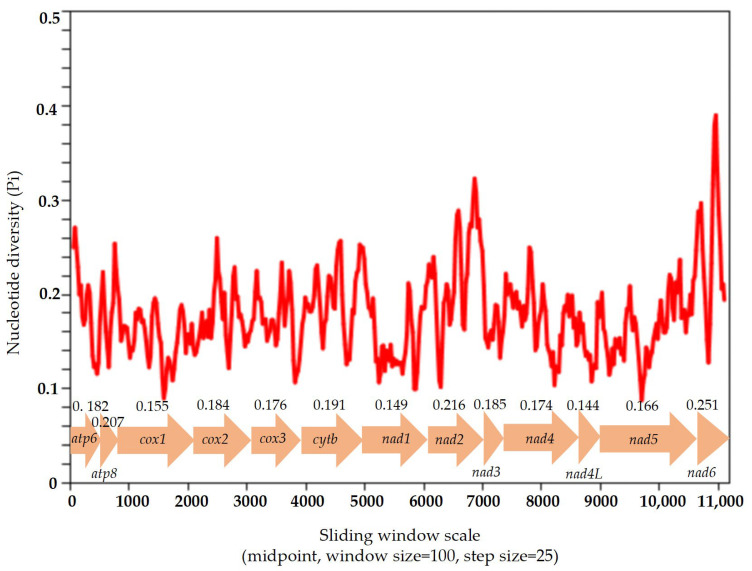 Figure 4
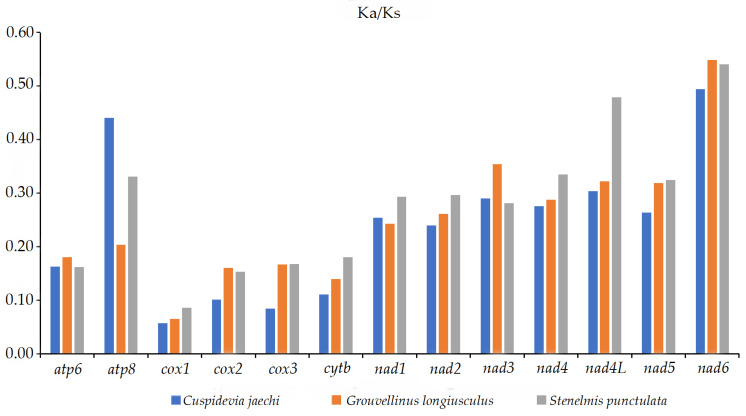 Figure 5
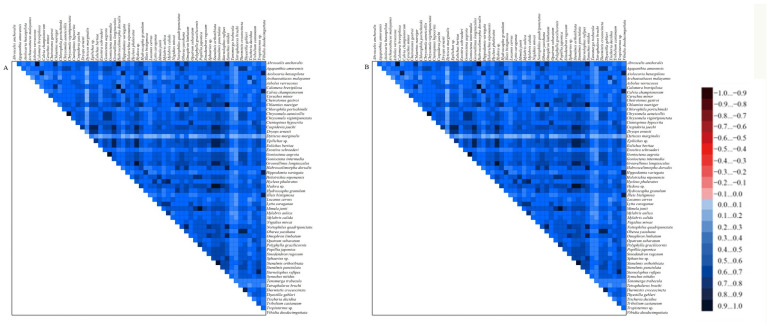 Figure 6
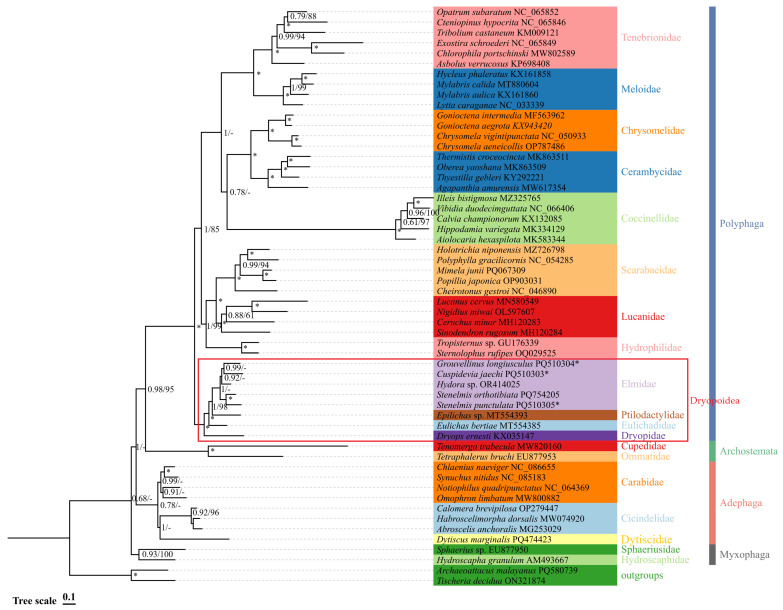 Figure 7
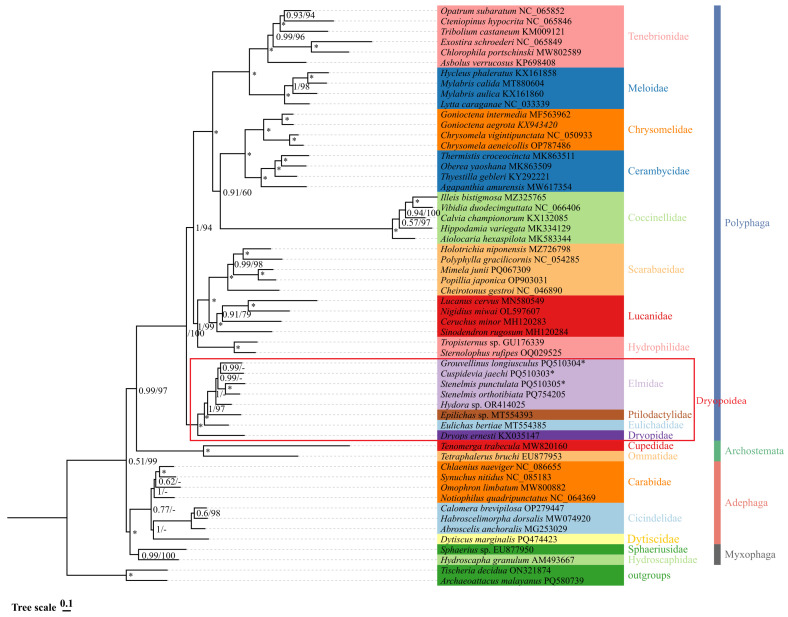 Figure 8
- —Applied Basic Research Projects of Shanxi Province
Peer Reviews
No public reviews on file for this paper yet. If you reviewed it on a platform where reviews are public (OpenReview, ICLR, NeurIPS, ICML), you can paste yours below so the community can read it here.
Videos
No videos yet. Explain this paper in a talk, walkthrough, or lecture? Add one.
Taxonomy
TopicsColeoptera Taxonomy and Distribution · Genomics and Phylogenetic Studies · Microbial Natural Products and Biosynthesis
1. Introduction
Elmidae (riffle beetles) is a diverse group of aquatic Coleoptera, with about 1500 described species [1,2]. Most elmids inhabit running water, with both larvae and adults attaching to submerged wood or stones [3,4]. The elmid is used as an indicator species in water quality monitoring, as many species are particularly sensitive to their aquatic environments [3,4,5,6]. Elmidae currently contains two subfamilies, 151 genera, and five tribes [2,7,8]. Previous studies of Elmidae have mainly focused on the description and identification of morphological characteristics, while the molecular phylogenetic analysis of this family is still limited. Based on COX1 and two nuclear genes, the phylogenetic relationships among 58 species from 17 genera of Elmidae were analyzed [9]. Based on 585 ultraconserved elements (UCEs), a phylogenetic analysis of 73 elmid species was performed [2]. The available data on the complete mitochondrial genome of Elmidae are very limited. Currently, the complete mitochondrial genome of this family consists only of Hydora sp. (OR414025) and Stenelmis orthotibiata (PQ754205), both available in the NCBI database. There is still some controversy over the phylogenetic relationships of higher taxonomic groups within this family [2,9].
The typical insect mitochondrial genome is a double-stranded circular DNA molecule, ranging from 14 to 20 kb in size and containing 37 genes: 13 protein-coding genes (PCGs), 2 rRNAs, and 22 tRNAs [10,11]. In addition, there is a non-coding control region (CR), which is the start site of replication and transcription [12,13]. Owing to their features of fast evolution, low sequence recombination, and conserved genes, mitochondrial genomes have been widely used in the study of species delimitation, phylogenetic analysis, and molecular evolution [14,15,16].
Cuspidevia jaechi Bian & Ji 2010, Grouvellinus longiusculus Bian & Jäch 2019, and Stenelmis punctulata Bollow 1940 are classified within Elminae of Elmidae [17,18]. In this study, the first complete mitogenomes of C. jaechi, G. longiusculus, and S. punctulata were determined and annotated. The genome organization, nucleotide composition, codon usage, tRNA gene secondary structure, and control region were investigated and analyzed. The features of the mitochondrial genomes of the three species were compared. Phylogenetic trees were reconstructed for 56 species (including 54 Coleoptera and 2 outgroups) to verify the phylogenetic position of the family Elmidae within Coleoptera, using the Bayesian inference (BI) and maximum likelihood (ML) methods. This study enriches the mitochondrial database on Elmidae, aiding in the understanding of its mitochondrial genome structure and phylogeny.
2. Materials and Methods
2.1. Sample Collection, Identification, and DNA Extraction
Adult specimens of C. jaechi, G. longiusculus, and S. punctulata were collected using the water net method in China (Table 1). All specimens were preserved in anhydrous ethanol during collection and then stored at −20 °C at the College of Plant Protection, Shanxi Agricultural University. Total genomic DNA was extracted from the whole insect using an Insect DNA Kit (OMEGA, Norcross, GA, USA), following the manufacturer’s protocol. The DNA was stored at −20 °C for further analysis.
2.2. Mitogenome Sequencing, Assembly, and Annotation
The Illumina TruSeq libraries were constructed with an average insert size of 350 bp and sequenced using the Illumina NovaSeq 6000 platform (Berry Genomics, Beijing, China) with 150 bp paired-end reads. Quality control was carried out using Fastp version 0.23.2 [19] on the raw data, and low-quality or short reads were removed. The generated sequence was preliminarily annotated using the MITOS Web Server [20] (http://mitos.bioinf.uni-leipzig.de/index.py, accessed on 10 July 2024) and MitoZ version 3.6 [21] with the invertebrate mitochondrial genetic code for automated annotation. The sequences obtained were annotated in Geneious version 10.3 [22], with the default parameters and the mitogenomes of Hydora sp. (OR414025) and Stenelmis orthotibiata (PQ754205) as the references. Protein-coding genes (PCGs) and ribosomal RNA (rRNA) genes were annotated by aligning the homologous genes of the reference mitogenomes. Transfer RNA (tRNA) genes were confirmed by the online tRNAscan-SE search server [23] (https://lowelab.ucsc.edu/tRNAscan-SE/index.html, accessed on 15 July 2024). The circular mitogenomic maps were visualized using the CGView server [24] (http://stothard.afns.ualberta.ca/cgview_server/, accessed on 16 July 2024).
2.3. Sequence Analyses
According to the annotation of the mitochondrial genome, the gene size and structure were analyzed. The nucleotide composition and relative synonymous codon usage (RSCU) of 13 PCGs were calculated by MEGA version 11.0 [25]. AT-skew and GC-skew were calculated using the formulae AT-skew = (A − T)/(A + T) and GC-skew = (G − C)/(G + C) [26]. The non-synonymous substitution rate (Ka), synonymous substitution rate (Ks), and nucleotide diversity (Pi) of protein-coding genes were calculated by DnaSP v6.12.03 [27]. Secondary structures for tRNAs were manually drawn according to the tRNAscan-SE search server [23] (https://lowelab.ucsc.edu/tRNAscan-SE/index.html, accessed on 15 July 2024) and ARWEN version 1.2 [28]. The tandem repeats in the control region were predicted using the Tandem Repeats Finder [29] (https://tandem.bu.edu/trf/trf.html, accessed on 20 July 2024).
2.4. Phylogenetic Analysis
For the phylogenetic analysis, we employed 19 families and 54 species of Coleoptera, including the three newly determined sequences as ingroups. Meanwhile, Archaeoattacus malayanus and Tischeria decidua from Lepidoptera were selected as outgroups (Table S1). Based on the 13 PCGs and 2 rRNA genes, the phylogenetic analysis of Coleoptera was reconstructed.
The 13 PCGs and 2 rRNA genes of 56 species were aligned using the “G-INS-i” strategy in MAFFT version 7 [30] and trimmed using Gblocks [31] in Phylosuite [32,33]. Then, we concatenated the sequences of the 13 PCGs and 2 rRNA genes to obtain 2 data matrices, (1) PCGs12 + rRNAs and (2) PCGs123 + rRNAs, for phylogenetic analysis. The heterogeneity and substitution saturation were evaluated for each data matrix using AliGROOVE v1.08 and DNAMBE v5 [34,35]. The datasets were partitioned using PartitionFinder 2.1.1 [36] with the “greedy” search algorithm and Bayesian Information Criterion (BIC). Details of the best-fit schemes calculated for each partition are shown in Table S2.
A maximum likelihood (ML) tree was constructed using IQ-TREE v1.6.12 [37] under an edge-linked partition model. Bootstrap support (BS) was assessed using 5000 ultrafast bootstrap (UFB) replicates [38]. We used PhyloBayes MPI v.1.5a [39] for BI analyses under the site-heterogeneous mixture model CAT + GTR with a discrete gamma distribution and four rate categories. Two Markov Monte Carlo chains were run independently until the sampled trees reached satisfactory convergence (maxdiff less than 0.1). After the initial 25% of trees were discarded as burn-in, a consensus tree was computed from the remaining trees combined from two runs. iTOL v6 [40] was used to visualize the phylogenetic trees of ML and BI.
3. Results
3.1. Mitogenome Features of the Three Elmidae Species
The complete mitogenomes of C. jaechi, G. longiusculus, and S. punctulata were 16,309 bp, 16,291 bp, and 15,480 bp in length, respectively (Figure 1). The differences in the lengths of the mitochondrial genomes were mainly due to differences in the lengths of the control regions. The mitochondrial genomes of three Elmidae species contained 37 genes (13 PCGs, 2 rRNAs, and 22 tRNAs) and a non-coding control region (CR). Among these 37 genes, the J-strand encoded 23 genes, including 14 tRNA genes and 9 PCGs. There were 14 genes on the N-strand, including 4 PCGs, 8 tRNA genes, and 2 rRNA genes (Tables S3–S5).
The three species harbor gene overlap regions, with 13 gene overlaps in C. jaechi, 14 in G. longiusculus, and 20 in S. punctulata. The longest gene overlap regions of C. jaechi and G. longiusculus are both located in trnW/trnC and trnY/COX1, which is 8 bp. The longest overlap region of S. punctulata is located in trnY/COX1, with 9 bp. There are intergenic spacers in the three species, with seven intergenic spacers in C. jaechi, nine in G. longiusculus, and six in S. punctulata. The longest intergenic spacer of C. jaechi is located in nad2/trnW, which is 52 bp. The longest intergenic spacers of G. longiusculus and S. punctulata are both located in trnT/nad6, with 24 and 20 bp, respectively (Tables S3–S5).
The nucleotide composition of C. jaechi is A = 42.0%, T = 33.0%, G = 8.8%, and C = 16.3%; that of G. longiusculus is A = 41.9%, T = 34.2%, G = 9.6%, and C = 14.3%; and that of S. punctulata is A = 42.0%, T = 34.1%, G = 9.2%, and C = 14.7% (Table 2). The nucleotide compositions of the three species possess significant AT bias, ranging from 74.9% (C. jaechi) to 76.1% (G. longiusculus and S. punctulata). The A + T content of the control region is the highest; the PCGs have the lowest AT content. The AT content in rRNAs is higher than that in tRNAs and PCGs in the three species (Table 2). The AT bias is positive and the GC bias is negative in the mitogenomes of the three species. The AT and GC biases in protein-coding genes were both negative, while the genes on the J-strand were both negative, and the N-strand had negative AT and positive GC (Table 2).
3.2. Protein-Coding Genes (PCGs) and Codon Usage
The PCGs of C. jaechi, G. longiusculus, and S. punctulata are 11,184 bp, 11,178 bp, and 11,188 bp in size, respectively (Table 2). The nad1 of the three species begins with TTG as the start codon, and the other 12 PCGs start with ATN codons (ATA, ATC, ATG, ATT). Among the 13 PCGs, most of the PCGs used complete stop codons, namely TAA or TAG. A few genes used a single T as an incomplete stop codon. COX2, COX3, and nad5 in C. jaechi and G. longiusculus and COX2, COX3, nad5, and nad4 in S. punctulata used a single T as a stop codon (Tables S3–S5). These incomplete termination codons are presumed to be filled by polyadenylation during the mRNA maturation process [41].
The relative synonymous codon usage (RSCU) of the three species also indicates a strong AT bias in the mitogenome nucleotide composition (Figure 2). TTA, ATT, TTT, ATA, and AAT are the most frequently used codons in these three species. The usage frequency of TTA was the highest in G. longiusculus and S. punctulata, while ATT was used most frequently in C. jaechi. The most common amino acid was Ile, followed by Leu2, Phe, and Met, in C. jaechi and G. longiusculus, while the most used amino acid was Leu2, followed by Ile, Phe, and Met, in S. punctulata (Figure 2).
3.3. Transfer RNAs and Ribosomal RNA Genes
The mitogenomes of the three species contain 22 tRNA genes, which can transport all 20 amino acids. The 14 tRNAs were located on the J-strand, and 8 tRNAs were encoded on the N-strand. The lengths of tRNA genes ranged from 63 bp (trnC, trnL1) to 71 bp (trnK, trnV) in C. jaechi, from 61 bp (trnC) to 71 bp (trnK) in G. longiusculus, and from 61 bp (trnC) to 76 bp (trnQ) in S. punctulata (Tables S3–S5). The secondary structure of trnS1 lacked the dihydrouridine (DHU) arm (Figure 3), which is common in metazoan mitogenomes [14]; the other tRNAs had a typical cloverleaf secondary structure (Figures S1–S3). In addition, the anticodon of trnS1 is UCU (Figure 3), which differs from the common GCU; such a situation was supposed to be a synapomorphy of the Polyphaga [42]. GU, AG, UU, and UC mismatches were found in the three species, and the number of GU mismatches was the highest in all three species. AG mismatches were found in the trnW of the three species, UU mismatches were found in the trnI of C. jaechi and trnL2 of G. longiusculus, and UC mismatches were only found in the trnN of C. jaechi (Figures S1–S3).
The rRNA genes of three mitogenomes were encoded on the N-strand. l-rRNA is located between trnL1 and trnV, and s-rRNA is located between trnV and the control region (Figure 1) (Tables S3–S5). The length of l-rRNA is 1298 bp in C. jaechi, 1306 bp in G. longiusculus, and 1296 bp in S. punctulata. The length of s-rRNA is 778 bp in C. jaechi, 776 bp in G. longiusculus, and 777 bp in S. punctulata. The two rRNAs contain a high AT bias (Table 2).
3.4. Control Region
The control region (CR) is the main non-coding region of the mitogenome and is located between the s-rRNA gene and trnI. This region is associated with the origin of replication and transcription [11,14]. The lengths of the CR were 1553 bp in C. jaechi, 1543 bp in G. longiusculus, and 753 bp in S. punctulata. The AT content of this region was the highest, at 80.9% (C. jaechi), 82.8% (G. longiusculus), and 87.0% (S. punctulata) (Table 2).
Tandem duplication in the CR has been reported in other sequenced insect mitogenomes [43]. The lengths and numbers of the tandem repeats in the three species were different. There were two tandem repeats in the CRs of C. jaechi and G. longiusculus. Three were found in S. punctulata. Moreover, microsatellite-like (AT)n and (CT)n elements were found in the CR. (AT)7, (AT)5, (AT)9, and (CT)6 were found in C. jaechi; (AT)6, (AT)8, and (CT)5 were found in G. longiusculus; and (TA)5 was found in S. punctulata. Additionally, there were some poly-A and poly-T structures in the CRs of the three species. There were three poly-As (6 bp, 9 bp, and 7 bp) and three poly-Ts (7 bp, 10 bp, and 10 bp) in C. jaechi. Four poly-As (7 bp, 8 bp, 7 bp, and 10 bp) and four poly-Ts (14 bp, 7 bp, 10 bp, and 11 bp) were found in G. longiusculus. Two poly-As (7 bp and 9 bp) and one poly-T (10 bp) were found in S. punctulata (Figure S4).
3.5. Nucleotide Diversity and Evolutionary Rate Analysis
Based on the 13 aligned PCGs of five sequenced Elmidae species, the sliding window analysis showed that the nucleotide diversity values ranged from 0.144 (nad4L) to 0.251 (nad6) (Figure 4). The nad6 gene is the most variable region with the highest nucleotide diversity (Pi = 0.251), followed by nad2 (Pi = 0.216) and atp8 (Pi = 0.207). The nad4L gene exhibited the lowest diversity values (Pi = 0.143), followed by COX1 (Pi = 0.155), which indicated that these were relatively conserved genes among the 13 PCGs (Figure 4).
The evolutionary rates of the 13 PCGs were estimated using the ratio of Ka/Ks. A ratio of Ka/Ks of less than 1 shows that the genes are under negative (purifying) selection, a value equal to 1 shows neutral evolution, and a value greater than 1 shows positive (adaptative) selection. The Ka/Ks ratios for the 13 PCGs were less than 1, indicating that these genes evolved under purifying selection. The Ka/Ks ratio of nad6 was the highest, which indicated that the evolutionary rate of nad6 was the fastest among the 13 PCGs, followed by nad4L and atp8. COX1 showed the lowest evolutionary rate, indicating that it was the slowest to evolve and the most conserved gene among the 13 PCGs, followed by COX3 and COX2 (Figure 5).
3.6. Heterogeneity and Substitution Saturation Tests
Pairwise comparisons of the nucleotide divergence within multiple sequence alignment indicated low heterogeneity across the two matrices. The results indicated that the genetic variation was sufficiently uniform to support accurate evolutionary inferences (Figure 6). The analysis of the two datasets revealed that the simple index of substitution saturation (ISS) was less than the critical ISS value (ISS.c), and p < 0.05 (Tables S6 and S7). This suggested that the datasets had not reached saturation in terms of nucleotide substitutions.
3.7. Phylogenetic Relationships
In this study, four phylogenetic trees were constructed via the maximum likelihood (ML) and Bayesian inference (BI) methods using two datasets: PCGs12 + rRNAs and PCGs123 + rRNAs. The four phylogenetic trees exhibited broadly similar topologies (Figure 7 and Figure 8).
The phylogenetic relationships among the suborders within Coleoptera are as follows: except for the Bayesian inference (BI) tree based on PCGs12 + rRNAs, which supports (Myxophaga + (Adephaga + (Archostemata + Polyphaga))), the remaining three trees support (Myxophaga + Adephaga) + (Polyphaga + Archostemata). Each family in this study is consistently supported as a monophyletic group by all four phylogenetic trees, which have high bootstrap support values (Figure 7 and Figure 8).
The four phylogenetic trees consistently support Elmidae belonging to the superfamily Dryopoidea within the suborder Polyphaga, with high support values. The phylogenetic relationship of Polyphaga has two topologies in four phylogenetic trees. Based on the Bayesian inference (BI) tree of PCGs12 + rRNAs, and the BI and maximum likelihood (ML) trees of PCGs123 + rRNAs, the topology was (Dryopidae + (Eulichadidae + (Ptilodactylidae + Elmidae))) + ((Hydrophilidae + (Lucanidae + Scarabaeidae)) + ((Tenebrionidae + Meloidae) + (Coccinellidae + (Cerambycidae + Chrysomelidae)))). The other topology was (Dryopidae + (Eulichadidae + (Ptilodactylidae + Elmidae))) + ((Hydrophilidae + (Lucanidae + Scarabaeidae)) + (Coccinellidae + ((Cerambycidae + Chrysomelidae) + (Tenebrionidae + Meloidae)))), which was based on the ML tree of PCGs12 + rRNAs. Among the two topologies, Coccinellidae was placed in different positions (Figure 7 and Figure 8).
In the four phylogenetic trees, the interspecific relationships of the Elmidae showed variation. The BI tree based on PCGs12 + rRNAs supported (S. orthotibiata + S. punctulata) + (Hydora sp. + (C. jaechi + G. longiusculus)), and the BI tree based on PCGs123 + rRNAs supported Hydora sp. + ((S. orthotibiata + S. punctulata) + (C. jaechi + G. longiusculus)). The ML tree based on PCGs12 + rRNAs supported C. jaechi + ((S. orthotibiata + S. punctulata) + (Hydora sp. + G. longiusculus)), while the ML tree based on PCGs123 + rRNAs supported (G. longiusculus + Hydora sp.) + (C. jaechi + (S. orthotibiata + S. punctulata)). All phylogenetic trees supported the notion that S. orthotibiata and S. punctulata first gathered into a cluster, which is consistent with the traditional taxonomy [44] (Figure 7 and Figure 8).
4. Discussion
The gene directions and arrangements in the three species of Elmidae were found to be consistent with the sequenced species of Dryopoidea (KX035147, MT554385, MT554393), differing notably from most other species of Coleoptera [45]. The primary difference observed was the rearrangement of trnP and nad6. An alteration in the positions between nad6 and trnP was found in the evolutionary branches of Dryopoidea; this rearrangement can be traced back to the Jurassic period [46].
The phylogenetic analysis indicates that the superfamily Dryopoidea may have diverged earlier from within Polyphaga, which is consistent with the results of the studies by McKenna et al. [47] and Cai et al. [48]. Elmidae was a sister group to Ptilodactylidae. This result differs from the research of Bocak et al. [49], which was based on datasets of COX1, l-rRNA, 18S, and 28S rRNA.
Regarding the phylogenetic relationships within the Elmidae, the results of this study are not consistent with the traditional taxonomy [44]. The taxonomic groups at the subfamily, tribe, and genus levels were ambiguous; this result is consistent with the findings of Hayashi et al. [9] and Kobayashi et al. [2]. At the subfamily level, except for the Bayesian inference (BI) tree based on PCGs123 + rRNAs, all trees showed that the subfamily Larainae (Hydora sp.) was nested in the subfamily Elminae group (S. orthotibiata, S. punctulata, C. jaechi, and G. longiusculus). At the tribe level, the three species of Elmini (S. orthotibiata, S. punctulata, and G. longiusculus) did not first form a cluster, as supported by the four trees. At the genus level, the phylogenetic relationship varied across the four phylogenetic trees due to the changing positions of Hydora sp. and C. jaechi.
Currently, molecular research on Elmidae is limited, with only two complete mitochondrial genome sequences available in the NCBI database. This study enhances the information available on Elmidae in the NCBI database and provides a scientific basis for species identification and the evolution of Elmidae insects. The samples and molecular data were limited in this study; future analyses should include more taxa and taxonomic information to facilitate the comprehensive revision of Elmidae.
5. Conclusions
In this study, the complete mitogenomes of C. jaechi, G. longiusculus, and S. punctulata were sequenced, analyzed, and compared. It was found that the gene arrangements of these three mitogenomes were different from those of other typical mitogenomes in Coleoptera. The phylogeny of 54 species of Coleoptera was analyzed using the Bayesian inference and maximum likelihood methods. The phylogenetic analysis indicated that Elmidae subordinate to the superfamily Dryopoidea within the suborder Polyphaga, was monophyletic. However, the taxonomic groups at the subfamily, tribe, and genus levels were unstable. This result initially suggests that the classification within Elmidae needs to be confirmed by increasing the number of taxon samples and incorporating more molecular and morphological information in future research.
The reference list from the paper itself. Each links out to its DOI / PubMed record.
- 1Kodada K. Jäch M.A. Ciampor F.J. Elmidae Handbook of Zoology. Coleoptera, Vol. 1: Morphology & Systematics 2nd ed. Beutel R.G. Leschen R.A.B. De Gruyter Vienna, Austria 2016561598
- 2Kobayashi T. Hayashi M. Kamite Y. Sota T. Molecular phylogeny of Elmidae (Coleoptera: Byrrhoidea) with a focus on Japanese species: Implications for intrafamilial classification Syst. Entomol.20214687088610.1111/syen.12499 · doi ↗
- 3Compin A. Céréghino R. Sensitivity of aquatic insect species richness to disturbance in the Adour–Garonne stream system (France)Ecol. Indic.2003313514210.1016/S 1470-160X(03)00016-5 · doi ↗
- 4Garcia-Criado F. Fernandez-Aláez M. Hydraenidae and Elmidae assemblages (Coleoptera) from a Spanish river basin: Good indicators of coal mining pollution?Arch. Hydrobiol.200115064166010.1127/archiv-hydrobiol/150/2001/641 · doi ↗
- 5Ribera I. Foster G.N. Uso de coleópteros acuáticos como indicadores biológicos (Coleoptera)Elytron 199266175
- 6Ribera I. Biogeography and conservation of Iberian Water Beetles Biol. Conserv.20009213115010.1016/S 0006-3207(99)00048-8 · doi ↗
- 7Bouchard P. Bousquet Y. Davies A.E. Alonso-Zarazaga M.A. Lawrence J.F. Lyal C.H. Newton A.F. Reid C.A. Schmitt M. Slipiński S.A. Family-group names in Coleoptera (Insecta)Zookeys 20114197210.3897/zookeys.88.807PMC 308847221594053 · doi ↗ · pubmed ↗
- 8Jäch M.A. Kodada J. Brojer M. Shepard W.D. Ciampor F. Coleoptera: Elmidae and Protelmidae. World Catalogue of Insects Brill Leiden, The Netherlands 2016 Volume 14