The Combination of Physiological and Transcriptomic Approaches Reveals New Insights into the Molecular Mechanisms of Leymus chinensis Growth Under Different Shading Intensities
Xinru Li, Qianqian Yu, Zhongxu Yao, Shuo Li, Lichao Ma, Kunlong Su, Guofeng Yang

TL;DR
This study explores how two types of Leymus chinensis grass respond to shading stress using physiological and genetic methods.
Contribution
The study identifies key genes and metabolic pathways involved in shading stress resistance in Leymus chinensis.
Findings
Lc3 genotype shows superior growth under shading stress with enhanced photosynthetic parameters.
DEGs are enriched in starch and sucrose metabolism and glycolysis/gluconeogenesis pathways in both genotypes.
LcGolS2 gene is identified as a potential hub gene for shade stress resistance.
Abstract
Leymus chinensis is a grass species in the family Triticeae that is found in the Eurasian grassland region and is known for its outstanding ecological advantages and economic value. However, the increasing adoption of photovoltaic agriculture has modified the light environment for the grass, markedly inhibiting its photosynthesis, growth, and yield. This study used physiological and transcriptomic analyses to investigate the complex response mechanisms of two L. chinensis genotypes (Zhongke No. 3 [Lc3] and Zhongke No. 5 [Lc5]) under shading stress. Growth phenotype analysis revealed the superior growth performance of Lc3 under shading stress, evidenced by enhanced plant height and photosynthetic parameters. Additionally, differentially expressed genes (DEGs) were predominantly enriched in starch and sucrose metabolism and glycolysis/gluconeogenesis pathways, which were the most…
Genes, proteins, chemicals, diseases, species, mutations and cell lines named across the full text — each resolved to its canonical identifier and authoritative record.
Click any figure to enlarge with its caption.
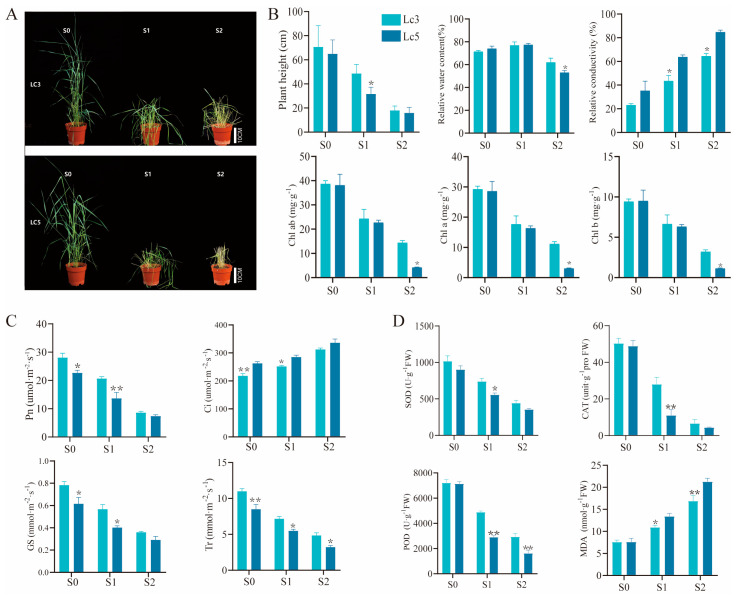 Figure 1
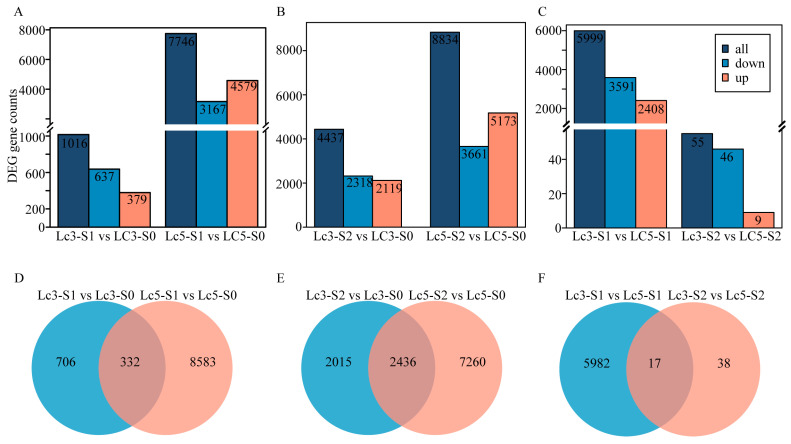 Figure 2
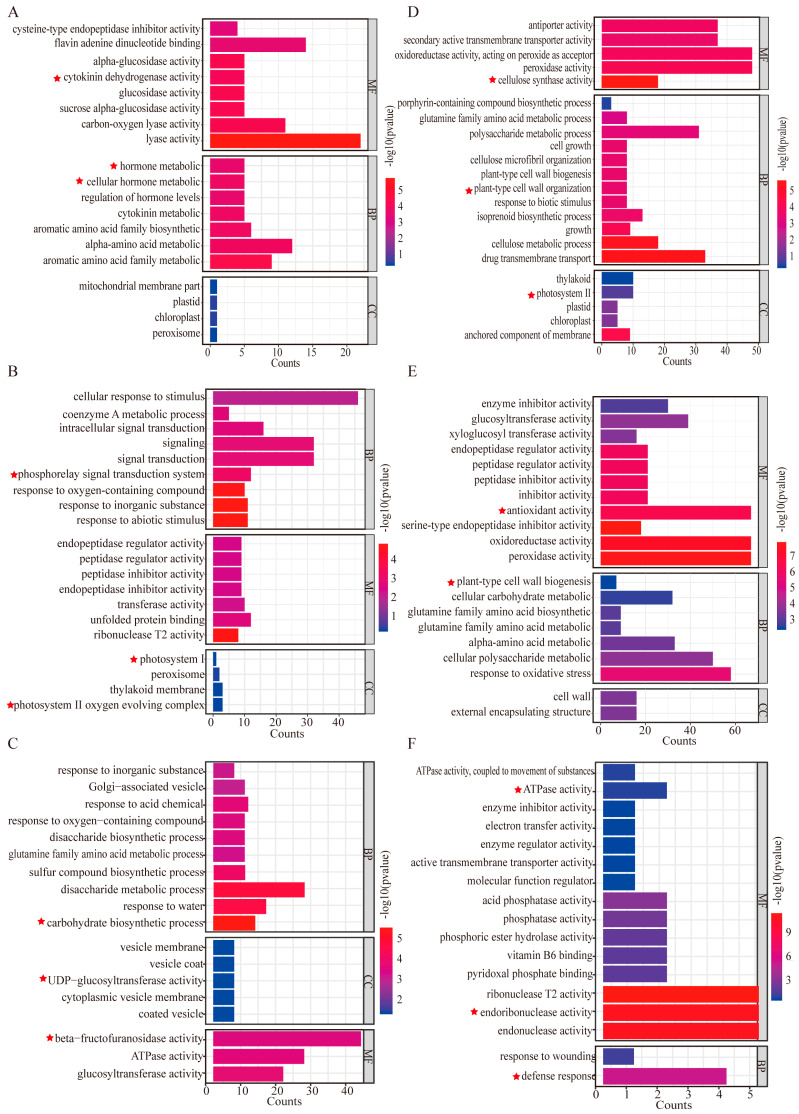 Figure 3
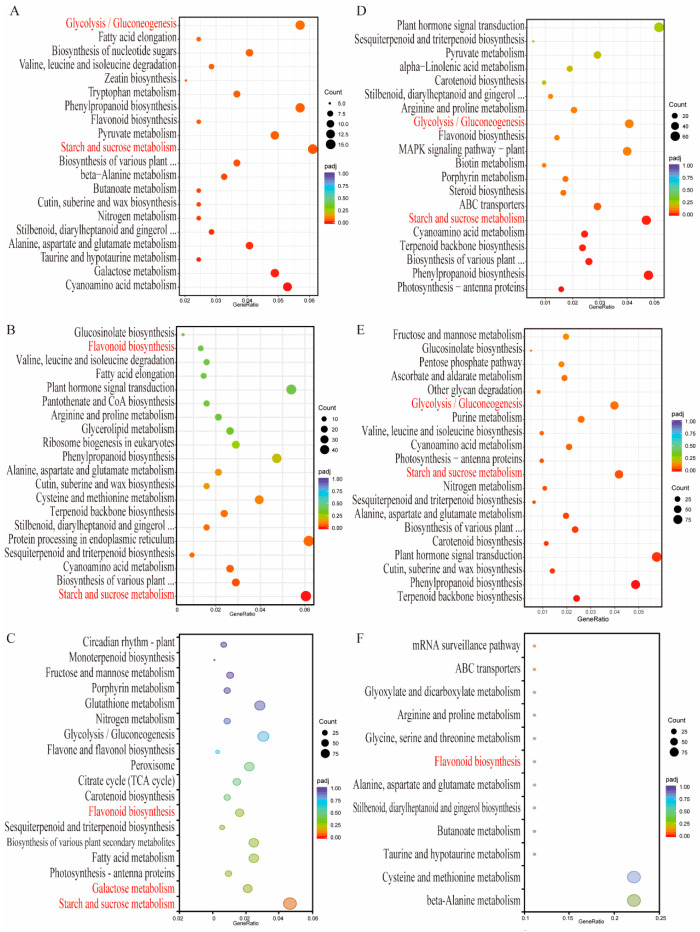 Figure 4
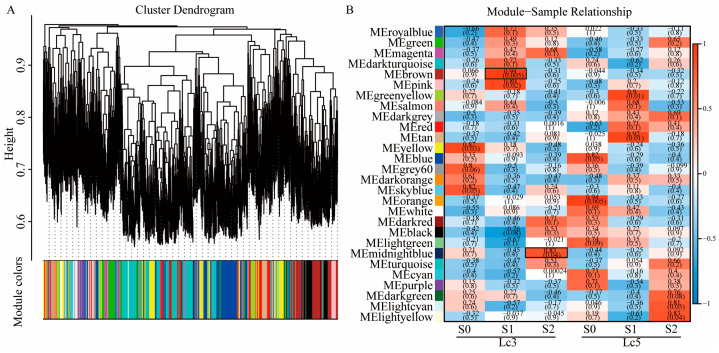 Figure 5
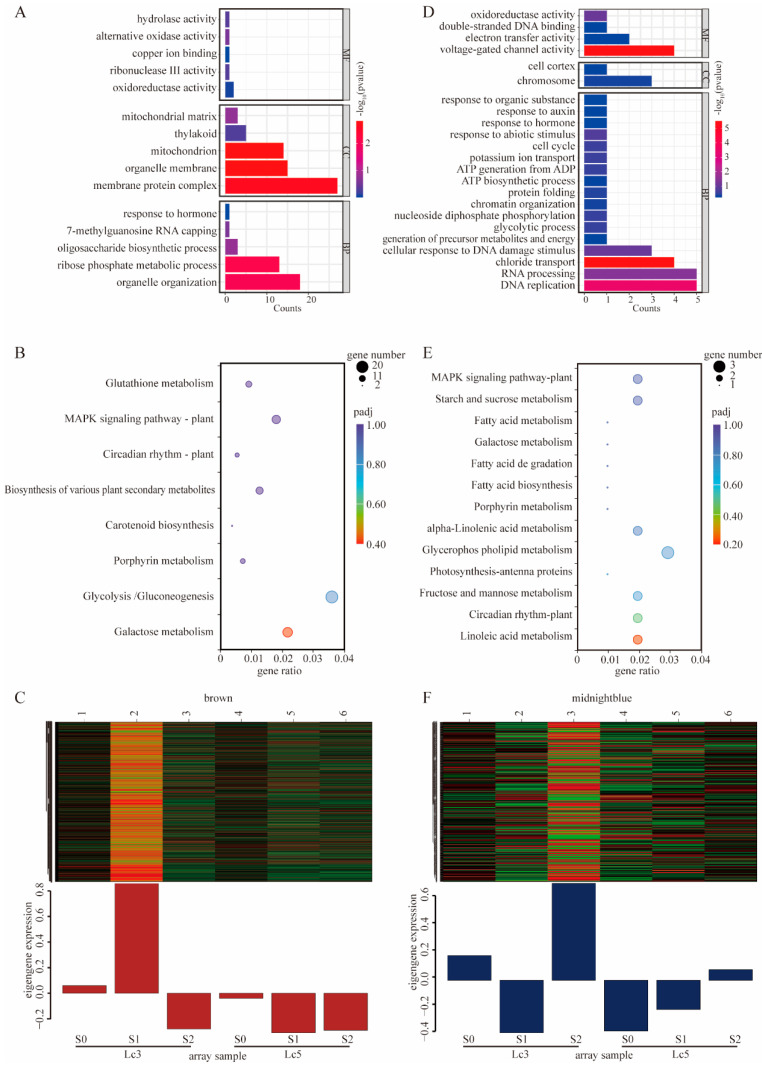 Figure 6
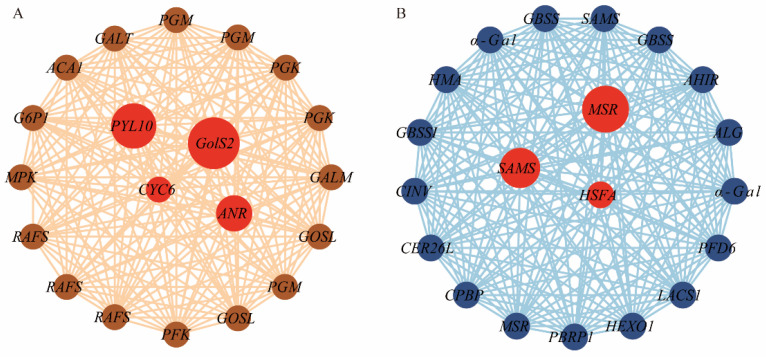 Figure 7
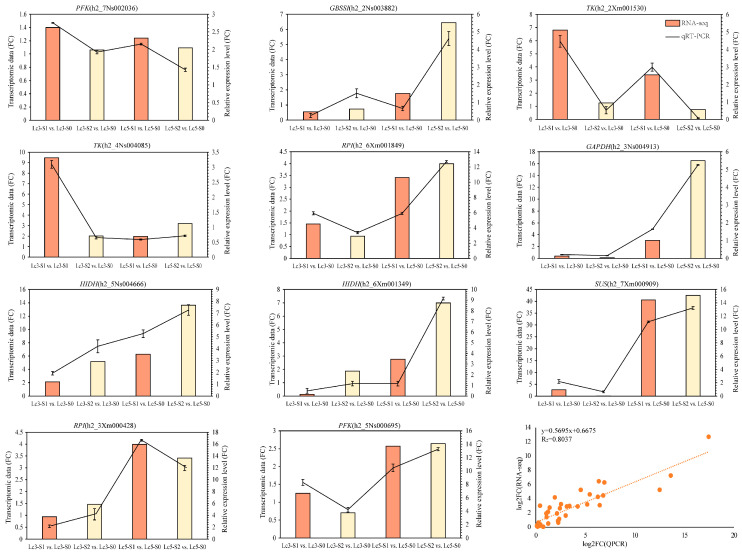 Figure 8
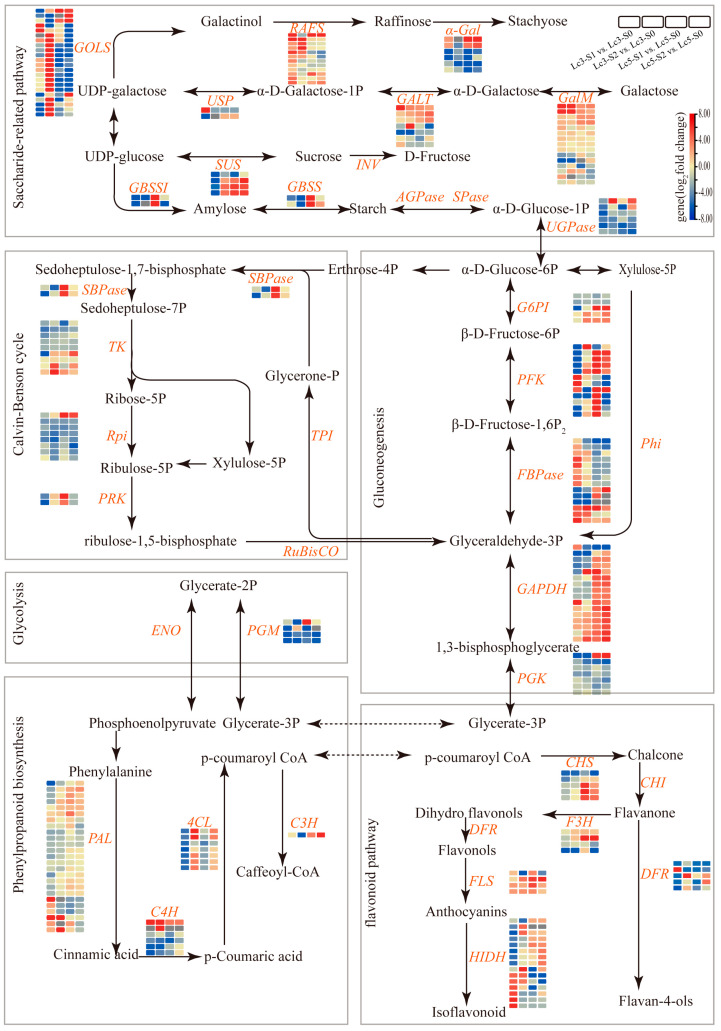 Figure 9
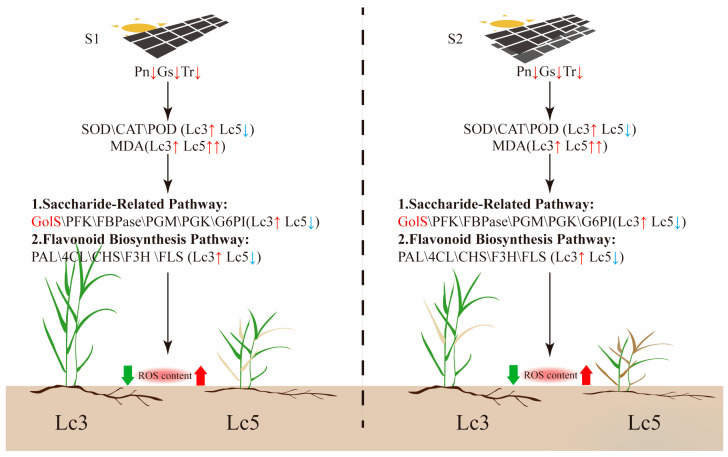 Figure 10
- —Shandong Province Key Research and Development Plan
- —Shandong Forage Research System
Peer Reviews
No public reviews on file for this paper yet. If you reviewed it on a platform where reviews are public (OpenReview, ICLR, NeurIPS, ICML), you can paste yours below so the community can read it here.
Videos
No videos yet. Explain this paper in a talk, walkthrough, or lecture? Add one.
Taxonomy
TopicsPlant biochemistry and biosynthesis · Seed and Plant Biochemistry · Plant Stress Responses and Tolerance
1. Introduction
Leymus chinensis (Trin. ex Bunge) Tzvelev serves as a key species in the grassland ecosystems of the Songnen Plain in northeastern China and the eastern Inner Mongolia grasslands. The grass also holds a crucial position in the meadow and dry steppes of eastern Eurasia [1]. This forage grass is widely used in forage production due to its well-developed rhizomes, lush foliage, high yield, and rich protein content [2]. Its remarkable adaptability to cold, salinity, and drought has also made it an important species in livestock farming and sustainable agriculture [3,4,5,6,7]. However, as photovoltaic installations become more widespread, the shading conditions under solar panels significantly modify the light environment, restricting the photosynthesis and growth performance of L. chinensis and leading to reduced productivity [8]. This shift in the light environment directly challenges the plant’s physiological processes, making it essential to investigate the growth changes of L. chinensis under shading stress. Therefore, understanding its adaptive mechanisms and enhancing its stress tolerance through modern molecular breeding techniques can help improve its yield under shaded conditions.
Light is a fundamental environmental factor influencing plant growth and development because its intensity and quality regulate photosynthesis, growth patterns, and metabolic processes in leaves [9,10]. Reduced light intensity that results from shading triggers significant physiological and morphological changes in plants, including alterations in polysaccharide biosynthesis, secondary metabolite accumulation, and overall metabolic activity [11,12]. This stress disrupts key processes such as photosynthesis, gas exchange, and antioxidant activity, ultimately impairing the normal growth of plants [13,14,15]. One of the most prominent consequences of shading is the overaccumulation of reactive oxygen species (ROS), which leads to oxidative stress and cellular damage. Excess ROS can damage cellular components, including lipid membranes, proteins, and DNA, and also affect biomarkers such as malondialdehyde (MDA) and superoxide dismutase (SOD) [16,17]. This stress triggers physiological changes, including the activation of plant defense mechanisms aimed at mitigating oxidative damage. To combat ROS-induced stress, plants synthesize non-enzymatic antioxidants like flavonoids, carotenoids, ascorbic acid (AsA), and glutathione (GSH) through robust antioxidant systems. Concurrently, plants also activate enzymatic antioxidants such as SOD, peroxidase (POD), and catalase (CAT) [18,19]. Among these, flavonoids have been identified as particularly effective non-enzymatic antioxidants and play a critical role in alleviating oxidative damage caused by shading stress [20].
At the molecular level, plants adapt to shading stress through intricate gene regulatory networks. For example, AtBBX24, AtPIF4, and AtDELLA genes significantly enhance shade tolerance by regulating signaling pathways and stress response mechanisms in Arabidopsis [21]. Similarly, the PIF4 gene serves as a key regulatory factor for rapid growth under shading conditions in tomatoes by encoding proteins involved in auxin synthesis and signal transduction [22]. In addition, the GolS gene plays a critical role in the adaptation of Ajuga reptans to shading stress by regulating the synthesis of raffinose family oligosaccharides under shaded conditions [23]. This regulation influences key physiological processes, including photosynthesis and signaling pathways, highlighting its importance in enhancing plant resilience to low-light environments.
The rapid growth of photovoltaic agriculture has increased the complexity of shading environments for plants [24]. As a key species for ecological restoration, L. chinensis encounters several environmental constraints that significantly impact its growth under shading stress [25]. At the physiological level, shading stress in L. chinensis induces notable changes, including the downregulation of photosynthesis-related genes and the upregulation of sugar metabolism genes, which facilitate energy redistribution. Additionally, hormone-mediated mechanisms promote leaf elongation and cell expansion, enabling the plants to adapt to reduced light availability [3,26]. The plants also accumulate secondary metabolites as a potential strategy for adapting to shade. Despite these insights into physiological changes that occur under shading stress, the molecular mechanisms underlying shade tolerance in L. chinensis remain largely unexplored. The current research predominantly focuses on ecological and physiological aspects, with limited studies investigating gene regulatory networks or metabolic pathways specific to L. chinensis. Comparative studies have shown significant variation among the soybean, peanut, and sweet potato germplasms under shading stress [15,20,27]; for L. chinensis, similar investigations are scarce. Nevertheless, understanding these molecular mechanisms could provide critical insights for enhancing the ecological benefits and economic potential of L. chinensis in shaded environments, and lay a foundation for the sustainable development of the forage industry.
Additionally, transcriptomics has emerged as a powerful approach for uncovering gene functions and biological mechanisms, particularly in plant stress responses. Its technology has been extensively utilized to study shading stress in crops such as foxtail millet, sweet potato, and soybean [20,28,29]. For instance, transcriptomic analyses of foxtail millet cultivars with differing shade tolerances have revealed key contributors to shade tolerance. These include starch and sucrose metabolism, as well as carotenoid biosynthesis pathways. Differences in shade tolerance were also observed between the shade-tolerant Lc3 and shade-intolerant Lc5 L. chinensis cultivars. These findings help to systematically elucidate the molecular mechanisms involved in shading stress. These findings will not only offer valuable insights into the molecular mechanisms involved in shade tolerance in L. chinensis but also provide new perspectives for optimizing its cultivation practices, enhancing its ecological and economic benefits in photovoltaic agricultural systems, and promoting grassland ecological restoration.
2. Results
2.1. Growth Performance, Chlorophyll Content, and Photosynthesis
Preliminary shading experiments were conducted on six L. chinensis cultivars—Lc1, Lc2, Lc3, Lc5, Lc7, and Lc9—using shading nets with varying densities (S0, S1, and S2). After 30 days of shading, significant variations in growth performance were observed in S2-treated plants. Subsequent initial growth parameter measurements indicated that Lc3 plants demonstrated exceptional growth performance, while Lc5 exhibited comparatively weaker growth performance. Based on these findings, Lc3 and Lc5 cultivars were selected for further physiological and transcriptomic analyses under three shading conditions: S0 (natural light), S1 (single-layer shading), and S2 (double-layer shading).
As shading intensity increased, Lc3 and Lc5 cultivars exhibited distinct morphological differences (Figure 1A). With S1, the plant height of Lc3 was significantly greater than that of Lc5 (p < 0.05) (Figure 1B). With S2, Lc3 showed significantly higher relative water content and levels of chlorophyll a, chlorophyll b, and total chlorophyll than Lc5 (p < 0.05). In contrast, the relative conductivity of Lc3 was significantly lower than that of Lc5 under both S1 and S2 treatments (p < 0.05).
Similarly, as the shading intensity increased, the net photosynthetic rate (Pn), stomatal conductance (Gs), and transpiration rate (Tr) exhibited a gradual decline, whereas the intercellular CO_2_ concentration (Ci) increased. Under the S1 treatment, the Pn, Gs, and Tr of Lc5 were significantly reduced by 33.8%, 29.1%, and 23.4%, respectively, compared to Lc3. Conversely, the Ci of Lc5 under the S1 treatment was significantly higher than that of Lc3, with an increase of 13.2%. As the shading intensity increased, the activities of SOD, CAT, and POD enzymes in Lc3 and Lc5 were significantly reduced (p < 0.05). Specifically, under the S1 treatment, the activities of SOD, CAT, and POD in Lc3 were 32.9%, 154.0%, and 68.0% higher, respectively, than in Lc5. Under the S2 treatment, these enzymes’ activities in Lc3 were 25.2%, 50.5%, and 80.1% higher, respectively, than in Lc5. Meanwhile, the MDA content significantly increased in both cultivars (p < 0.05). Compared to Lc3, the MDA content in Lc5 increased by 22.6% and 26.1%, respectively, under the S1 and S2 treatments.
2.2. Transcriptome Analysis
The Lc3 and Lc5 cultivars exhibited significant differences in growth performance and physiological indicators under varying shading stresses, with Lc3 demonstrating superior adaptability to shading stress compared to Lc5. Therefore, RNA sequencing was used to uncover the differences in gene expression between Lc3 and Lc5 cultivars under different shading stresses and to elucidate the molecular mechanisms underlying their varying adaptive capacities.
Eighteen cDNA libraries were constructed from Lc3 and Lc5 under three shading conditions (S0, S1, and S2) for transcriptomic analysis. After removing low-quality reads, an average of 6.63 Gb of clean reads was obtained. Sequencing quality was high, with Q30 and GC content percentages ranging from 96.67 to 95.14% and 54.66 to 51.26%, respectively, with a base error rate of 0.01% (Supplementary Table S1). The mapping and unique mapping rates exceeded 75.42% (Supplementary Table S2), confirming the suitability of the selected reference genome, and the principal component analysis (PCA) revealed significant differences in unigene expression between shading treatments (Supplementary Figure S1).
The differential gene expression in Lc3 and Lc5 cultivars was analyzed by comparing the results of growth under S1 and S2 treatments to those under normal light conditions (S0). Under the S1 treatment, 1016 differentially expressed genes (DEGs) were identified in the Lc3-S1 vs. Lc3-S0, while 7746 DEGs were identified in the Lc5-S1 vs. Lc5-S0 (Figure 2A). Of the 1016 DEGs in the Lc3-S1 vs. Lc3-S0, 379 were upregulated and 637 were downregulated, while in the Lc5-S1 vs. Lc5-S0, 4579 DEGs were upregulated and 3167 DEGs were downregulated (Figure 2A). Under the S2 treatment, 4437 DEGs were identified in the Lc3-S2 vs. Lc3-S0, while 8834 DEGs were identified in the Lc5-S2 vs. Lc5-S0 (Figure 2B). Of the 4437 DEGs in the Lc3-S2 vs. Lc3-S0, 2119 were upregulated and 2318 were downregulated, while among the 8834 DEGs in the Lc5-S2 vs. Lc5-S0, 5173 genes were upregulated and 3661 were downregulated (Figure 2B). Furthermore, a Venn diagram identified 6038 DEGs across the Lc3 and Lc5 cultivars in the S1 treatment, with 5982 specific to Lc3-S1 vs. Lc5-S1, 38 specific to Lc3-S2 vs. Lc5-S2, and 17 shared between Lc3-S1 vs. Lc5-S1 and Lc3-S2 vs. Lc5-S2 (Figure 2F).
A Venn diagram detected 9622 DEGs in the S1 treatment across the Lc3 and Lc5 cultivars, including 706 specific to Lc3-S1 vs. Lc3-S0, 8583 specific to Lc5-S1 vs. Lc5-S0, and 332 common to both Lc3-S1 vs. Lc3-S0 and Lc5-S1 vs. Lc5-S0 (Figure 2D). Under the S2 treatment, 11,712 DEGs were identified across Lc3 and Lc5 cultivars, with 2015 unique to Lc3-S2 vs. Lc3-S0, 7260 unique to Lc5-S2 vs. Lc5-S0, and 2436 shared between comparisons of Lc3-S2 vs. Lc3-S0 and Lc5-S2 vs. Lc5-S0 (Figure 2E). Overall, under the S1 treatment, the number of DEGs in the Lc5 genotype was greater than in Lc3 (Figure 2A,D), while under the S2 treatment, the number of shared DEGs between the two genotypes increased, with Lc3 having fewer total and unique DEGs compared to Lc5 (Figure 2B,E). Thus, shading stress caused differential expression changes in growth-related genes between the two Lc3 and Lc5 genotypes.
Additionally, the differential gene expression levels in the two L. chinensis cultivars under the S1 treatment were compared. Under different shading stresses with the S1 and S2 treatments, specific DEGs were detected in Lc3 that may be related to its shade tolerance. Compared to Lc5, Lc3 had 5999 DEGs under single-layer net shading conditions (Lc3-S1 vs. Lc5-S1), with 2408 upregulated and 3591 downregulated, and 55 DEGs under double-layer net shading conditions (Lc3-S2 vs. Lc5-S2), with 9 upregulated and 46 downregulated (Figure 2C). Of these DEGs, Lc3 exhibited 5982 and 38 unique DEGs during S1 and S2 shading stress levels, respectively (Figure 2F, Supplementary Table S3). Thus, these findings indicate that the gene responses related to L. chinensis growth under shading stress differ between genotypes.
2.3. Gene Ontology (GO) Functional Enrichment Analysis
The GO functional enrichment analysis revealed that the roles of DEGs involved in the growth and development of the two L. chinensis cultivars under shading stress by classifying them as either a biological process (BP), molecular function (MF), or cellular component (CC) (Figure 3, Supplementary Table S4). Thus, the DEGs in the comparison between Lc3-S1 and Lc3-S0 were significantly enriched in several GO terms, such as hormone metabolism, cellular hormone metabolism, and cytokinin dehydrogenase activity (Figure 3A). In contrast, the DEGs in the comparison between Lc3-S2 and Lc3-S0 were enriched in functions related to photosynthesis, including photosystem I and the photosystem II oxygen-evolving complex, and the phosphorelay signal transduction system (Figure 3B). These results suggest that Lc3 relies on hormonal regulation and enhanced photosynthesis efficiency to mitigate shading stress. However, in Lc5-S1 vs. Lc5-S0, DEGs were enriched in structural and metabolic pathways, such as photosystem II, plant-type cell wall biogenesis, and cellulose synthase activity (Figure 3D), and in Lc5-S2 vs. Lc5-S0, plant-type cell wall biogenesis, antioxidant activity, and cellular carbohydrate metabolic processes were enriched (Figure 3E). These findings indicate that Lc5 primarily employs structural and metabolic adaptations to cope with shading stress.
In Lc3-S1 vs. Lc5-S1, DEGs were predominantly enriched in the carbohydrate biosynthetic process, UDP-glucosyltransferase activity, and beta-fructofuranosidase activity (Figure 3C), suggesting metabolic divergence between the genotypes, while in the Lc3-S2 vs. Lc5-S2 comparison, DEGs were enriched in endoribonuclease activity, ATPase activity, and defense response (Figure 3F), highlighting genotype-specific stress response mechanisms. Overall, these results indicate that Lc3 leaves enhance pathways such as carbohydrate biosynthetic processes and photosystem I to improve tolerance to shading stress, while Lc5 emphasizes structural adaptations like cell wall biogenesis and antioxidant activities. These partially overlapping but distinct enrichment patterns likely account for the differences in growth and stress tolerance observed between the two cultivars, suggesting the need for further research into stress-resilient agronomic traits in grasses.
2.4. KEGG Enrichment Analysis of DEGs
A KEGG enrichment analysis of the DEGs was conducted to explore the molecular mechanisms underlying the growth and development of Lc3 and Lc5 genotypes under shading stress. In Lc3, 90 and 127 KEGG pathways were enriched under S1 (Lc3-S1 vs. Lc3-S0) and S2 (Lc3-S2 vs. Lc3-S0), respectively, while in Lc5, 130 and 129 pathways were enriched in Lc5-S1 vs. Lc5-S0 and Lc5-S2 vs. Lc5-S0, respectively. Additionally, 119 pathways were enriched in Lc3-S1 vs. Lc5-S1, while only 12 pathways were enriched in the Lc3-S2 vs. Lc5-S2 comparison (Supplementary Table S5). Among the top 20 pathways (Figure 4), starch and sucrose metabolism and glycolysis/gluconeogenesis were commonly enriched in all the comparison groups, suggesting a central role for carbohydrate metabolism and energy production in the growth and development response of L. chinensis to shading stress, regardless of shading intensity or genotype. The KEGG enrichment analysis of the two varieties (Lc3-S1 vs. Lc5-S1) revealed that the starch and sucrose metabolism, flavonoid biosynthesis, and galactose metabolism pathways were enriched in the S1 treatment of the shade-tolerant cultivar (Figure 4C). The flavonoid biosynthesis pathway was also enriched in the S2 treatment comparison between Lc3-S2 and Lc5-S2 (Figure 4F). These findings suggest that the DEGs involved in these pathways, along with their regulatory metabolic processes, may play a critical role in making Lc3 more effective than Lc5 with regard to shade stress and growth and development.
2.5. Weighted Gene Co-Expression Network Analysis (WGCNA)
To uncover the gene regulatory networks influencing the growth and development of L. chinensis under shading stress, we employed WGCNA using RNA sequencing data. Prior to network construction, sample clustering was performed to detect potential outliers. The dendrogram showed a clear separation of biological replicates, confirming the data’s quality and suitability for WGCNA (Supplementary Figure S2). Before constructing the gene co-expression network, the value of the soft threshold power β was calculated, and the scale-free topology threshold of the network was set at 0.6. When the soft threshold power was 10, the average connectivity approached 0. Therefore, β = 10 was selected to construct the hierarchical clustering tree (Supplementary Figure S3). The hierarchical clustering dendrogram revealed that each tree branch formed a distinct co-expression module, with each leaf representing a gene (Figure 5A). After preprocessing the expression data, a total of 21,960 genes were included in the WGCNA, resulting in the identification of 28 co-expression modules (Supplementary Table S6). Further, module–trait relationship analysis was used to evaluate the preservation of co-expression modules in Lc3 and Lc5 under varying shading conditions. The MEbrown module contained 2274 genes, the MEmidnightblue module had 407 genes, the MEpurple module consisted of 583 genes, the MEtan module contained 535 genes, and the MEred module contained 1218 genes (Supplementary Table S6). In most modules, gene expression trends between the two cultivars were nearly identical under different shading conditions, as shown in the MEpurple, MEtan, and MEred modules. However, two specific modules in Lc3—MEbrown (r = 0.94, p = 0.005) and MEmidnightblue (r = 0.83, p = 0.04)—exhibited distinct responses to shading treatments, suggesting that they are unique to the Lc3 cultivar.
To better understand the biological significance of these modules, GO and KEGG pathway enrichment analyses were performed. In the MEbrown module, GO terms were enriched across the categories of BP, CC, and MF and included oxidoreductase activity, hormone response, the oligosaccharide biosynthetic process, and the mitochondrial matrix (Figure 6A). KEGG pathways were enriched in glycolysis/gluconeogenesis, galactose metabolism, and porphyrin metabolism (Figure 6B). Notably, the expression of key genes in the MEbrown module was most prominent in Lc3-S1 (Figure 6C). Similarly, the MEmidnightblue module, which was most active under the Lc3-S2 treatment, was enriched for GO terms related to oxidoreductase activity, response to abiotic stimulus, and ATP generation from ADP (Figure 6D,F). The key KEGG pathways in this module included starch and sucrose metabolism and galactose metabolism (Figure 6E), with highly expressed genes contributing to metabolic flexibility under extreme shading conditions. Interestingly, the MEmidnightblue module, which was strongly associated with Lc3-S2, was highly enriched in starch and sucrose metabolism and galactose metabolism (Figure 4 and Figure 6B). The integration of the results of WGCNA and KEGG enrichment analysis identified four key metabolic pathways—starch and sucrose metabolism, glycolysis/gluconeogenesis, galactose metabolism, and flavonoid biosynthesis—as central to the shading stress response of L. chinensis. Thus, these results indicate that the KEGG metabolic pathways and genes in the brown and midnightblue modules play a crucial role in the resistance of Lc3 to shading stress.
The software Cytoscape was used to visualize the KEGG hub genes within the brown and midnightblue modules. In the brown module, GolS2 (h2_2Ns000960) was identified as a hub gene, exhibiting co-expression correlations with pathways such as galactose metabolism that included RAFS, GALT, and GALM genes, and pathways such as glycolysis/gluconeogenesis that comprised PGM, PGK, and PFK genes (Figure 7A). In the midnightblue module, numerous interconnected genes that formed a complex regulatory network involving genes such as GBSSI, GBSS, SUS, and α-Gal were identified (Figure 7B). The analysis revealed a strong relationship between genes associated with starch and sucrose metabolism and galactose metabolism pathways (Figure 7B). Furthermore, the hub gene GolS2 in the brown module suggested a previously unknown role, which indicates its potential as a target for future research.
2.6. The Validation of the Expression Levels of Genes Related to Different Pathways Using qRT-PCR
To further confirm the RNA-Seq results, qRT-PCR was used to verify the changes in the expression of genes related to starch and sucrose metabolism, glycolysis/gluconeogenesis, galactose metabolism, and flavonoid biosynthesis under shading stress. Although the fragments per kilobase of transcript per million mapped reads (FPKM) values of the selected genes and the relative quantitative values of qRT-PCR differed, the trends in gene expression were consistent (Figure 8). The qRT-PCR results of LcPFK (h2_7Ns002036, h2_5Ns000695), LcGBSSI (h2_2Ns003882), LcTK (h2_2Xm001530, h2_4Ns004085), LcRpi (h2_6Xm001849, h2_3Xm000428), GAPDH (h2_3Ns004913), HIDH (h2_5Ns004666, h2_6Xm001349), and LcSUS (h2_6Xm001349) were highly consistent with the FPKM values from RNA-Seq. These results further demonstrate that the difference in resistance between Lc3 and Lc5 cultivars in response to shade stress is highly correlated with structural genes related to different metabolic pathways.
3. Discussion
In this study, L. chinensis cultivars Zhongke No. 3 (Lc3) and Zhongke No. 5 (Lc5), which differ in shade tolerance, were subjected to different levels of shading stress. This study used physiological measurements and transcriptomic analysis to elucidate the physiological and molecular mechanisms underlying the differences in shading stress tolerance between the two genotypes. These findings provide new insights into the plant’s adaptive strategies under shading stress.
3.1. Physiology Responses of Lc3 and Lc5 to Different Shade Treatments Were Different
Shade is an abiotic stress prevalent in crop production that significantly impacts plant growth and development [30]. In this study, varying levels of shading stress significantly inhibited the growth of Lc3 and Lc5, with the two genotypes displaying distinct morphological responses as the intensity of shading increased (Figure 1A). The results suggest that Lc3 exhibits greater adaptability to shading stress, with its healthy growth conditions and enhanced physiological traits providing critical support for its resistance to shading stress. Additionally, both S1 and S2 shading types reduced plant height and caused necrosis of the L. chinensis leaves, suggesting that the disruption of the chlorophyll structure by shading stress led to decreased chlorophyll content and reduced photosynthetic activity [13,31]. These results were also supported by a reduction in photosynthetic parameters such as Pn, Gs, and Tr under shading stress, with Lc5 more severely affected (Figure 1C).
Shading stress also damages the selective permeability of the cell membrane, thus altering the dynamic balance of ions and the efflux of soluble substances. Plants can mitigate this stress-induced damage by increasing their levels of osmotic regulators and antioxidant enzyme activity [32]. Osmotic regulators such as flavonoids, carotenoids, AsA, and glutathione have antioxidant and free radical scavenging properties that help plant cells to regulate osmotic pressure and cope with environmental stress [19,27]. Abiotic stress often leads to the excessive accumulation of ROS within the cells. In this study, as the shading intensity increased, Lc3 exhibited higher POD and SOD activity but lower MDA content than Lc5 in both S1 and S2 treatments, indicating a large amount of ROS accumulation and severe oxidative damage in Lc5 (Figure 1D). The results also suggest the stronger capacity of Lc3 to scavenge ROS under shading stress and thereby limit damage to its cell membrane, and demonstrate its greater resistance to shading stress.
Shading stress in plants encompasses several physiological events, including the inhibition of soluble sugars such as sucrose and fructose, delayed starch degradation and consumption, and the disruption of flavonoid secondary metabolism, which is a complex process regulated by multiple genes and pathways [11,12]. Transcriptomics, employed to further investigate the mechanisms and key pathways associated with shade tolerance in Lc3 and Lc5 cultivars, revealed the significant enrichment of DEGs in both cultivars. This occurred in the starch and sucrose metabolism and glycolysis/gluconeogenesis pathways, indicating that these pathways are crucial for plant growth in response to shading stress. Nevertheless, under shading stress, Lc3 cultivars exhibited significant enrichment in the starch and sucrose metabolism, flavonoid biosynthesis, and galactose metabolism pathways (Figure 4C,F), which may account for its shade tolerance.
3.2. Saccharide-Related Pathway in Response to Shade Stresses
Carbohydrates are the primary energy source for plant cells and also function as critical signaling molecules that regulate plant responses to various stresses, including salinity, alkalinity, and shading [33]. Under shading stress, plants experience changes in the accumulation of soluble sugars such as sucrose, fructose, and galactose, which modulate osmotic balance, regulate physiological processes, and help mitigate stress-induced damage [34]. In this study, functional enrichment analysis of DEGs indicated that most carbohydrate-related genes were induced, suggesting that carbohydrates may be related to the different responses of the two cultivars to shading stress (Figure 9, Supplementary Table S7). Among these genes, those encoding galactinol GolS, a key enzyme in galactose metabolism, were upregulated in both Lc3 and Lc5 in response to shading stress. However, the shade-tolerant genotype Lc3 exhibited significantly higher expression of the LcGolS gene compared to Lc5 (Figure 9). Galactinol, a product of GolS activity, regulates the synthesis of raffinose and stachyose, which serve as osmoprotectants to enhance stress tolerance [35,36]. Previous studies have shown that photoperiods can strongly induce GolS expression in cucumber (Cucumis sativus L.), while overexpression of the soybean GmGolS2-2 gene in tobacco improves abiotic stress tolerance by increasing soluble sugar content [37]. Therefore, the upregulation of GolS genes in Lc3 in this study suggests that galactinol metabolism plays a pivotal role in enhancing the shade tolerance of L. chinensis (Figure 9, Supplementary Table S7). Galactitol, a derivative of galactinol, also aids in ROS clearance and acts as a signaling molecule under abiotic stress in Arabidopsis [38,39]. Therefore, Lc3 likely accumulates higher levels of galactitol under S1 and is thereby conferred superior resistance to shading stress compared to Lc5.
The genes involved in the starch and glycolysis/gluconeogenesis pathways also displayed distinct expression patterns between the Lc3 and Lc5 cultivars. In Lc3, genes encoding phosphofructokinase (PFK) and fructose-1,6-bisphosphatase (FBPase), key enzymes in glycolysis and gluconeogenesis, were significantly upregulated. PFK serves as a rate-limiting enzyme in glycolysis, while FBPase regulates carbon flux between sugar breakdown and synthesis. The overexpression of the MdPFK5 gene in Arabidopsis and apple enhances salt tolerance, partly through soluble sugar accumulation [40], while the expression of FBPase alleviates photosynthetic limitations under low-nitrogen conditions in soybeans [41]. Therefore, the upregulation of PFK and FBPase in Lc3 supports energy production and carbohydrate utilization, contributing to its shade tolerance.
The PGM and PGK genes were also significantly expressed in Lc5 but not in Lc3 (Figure 9). PGM converts glucose-1-phosphate to glucose-6-phosphate, which feeds into glycolysis, while PGK generates ATP. The expression pattern of these genes in Lc5 is consistent with significant changes in the activity of glycolytic genes in ageing cells [42], indicating that Lc5 compensates for energy deficiencies caused by shade with an increased reliance on glycolysis and carbohydrate reserves. In contrast, Lc3 reduces its dependence on glycolysis when under shading stress by enhancing its photosynthetic efficiency and activating non-sugar metabolic pathways, such as fatty acid oxidation. These findings underscore the importance of carbohydrate-related metabolic pathways and gene regulation in determining the differential shading stress responses of L. chinensis genotypes.
3.3. The Flavonoid Biosynthesis Pathway Positively Responds to Shade Stresses in L. chinensis
Flavonoids are crucial secondary metabolites produced by plants in response to various environmental stresses, including shading stress, and are present in a wide range of plants. Flavonoids exhibit antioxidant, anti-inflammatory, and antibacterial activity effects and effectively neutralize excessive ROS, thereby reducing oxidative damage and improving plant survival and adaptability under environmental stress [43]. In this study, the flavonoid metabolic pathway was significantly enriched in Lc3 and Lc5, highlighting its crucial role in plant responses to shading stress. Flavonoids, which exhibit significant protective effects under shading stress, are strongly influenced by shading conditions, which modulate their synthesis [44,45,46,47]. However, shading stress significantly modulated higher expression of flavonoid-related genes in Lc3 than in Lc5 (Figure 9), which likely enhanced the antioxidant capacity of Lc3 plants and thereby aided their adaptation to environmental stress. Several key genes such as PAL, 4CL, CHS, CHI, F3H, and FLS play a central role in the flavonoid biosynthesis pathway [48]. Among the 30 structural genes annotated in this pathway, all the structural genes of PAL enzymes, including LcPAL1, LcPAL2, and LcPALY, were upregulated in Lc3, while most were downregulated in Lc5. The expression levels of C4H, 4CL, and HIDH genes were also significantly higher in Lc3 than in Lc5 (Figure 9). These findings underscore the role of shading stress in enhancing flavonoid accumulation, which helps maintain ROS balance and improves plants’ stress tolerance and adaptation to environmental stress [49,50]. Overall, this study provides novel insights into the molecular mechanisms of flavonoid stress adaptation and identifies key genetic targets for developing stress-resistant plant cultivars through breeding programs.
4. Conclusions
The physiology and molecular mechanisms underlying plant responses to shading stress are intricate and multifaceted. In this study, a combination of physiological and transcriptomic approaches were used to explore the key regulatory pathways and adaptive mechanisms between the shade-tolerant Lc3 and the shade-intolerant Lc5 genotypes under shading stress. Transcriptomic analysis identified five regulatory pathways associated with the growth of L. chinensis under shading stress, with the starch and sucrose metabolism and glycolysis/gluconeogenesis pathways consistently and significantly enriched in all S1 and S2 shaded plants. However, the starch and sucrose metabolism, flavonoid biosynthesis, and galactose metabolism pathways were prominently enriched in Lc3 and supported its superior shade tolerance due to the pathways alongside the associated DEGs. The superior shade tolerance in Lc3 is also supported by its relatively greater plant height, photosynthetic rate, and antioxidant capacity compared to Lc5. The shading stress also significantly altered the expression of GolS, PFK, FBPase, PGM, PGK, G6PI, GAPDH, PAL, and 4CL genes, many of which are involved in starch and sucrose metabolism and flavonoid biosynthesis (Figure 10). Therefore, the growth of L. chinensis under shading stress is regulated by coordinated changes in starch and sucrose metabolism, glycolysis/gluconeogenesis, flavonoid biosynthesis, and galactose metabolism. These findings provide valuable insights into the regulatory mechanisms of plant responses to shading stress and lay the groundwork for molecular breeding strategies aimed at developing shade-tolerant crops like L. chinensis.
5. Materials and Methods
5.1. Plant Materials and Treatments
The shading experiments were conducted in a greenhouse at Qingdao Agricultural University, Qingdao, China, using L. chinensis plants with a uniform height of 10 cm at the start of the experiment. The pots used in the experiment had a diameter of 14 cm and a height of 10 cm. The substrate consisted of a mixture of loam, vermiculite, and perlite in a ratio of 3:2:1. To simulate shading under photovoltaic panels, shade nets with either single-layer shading (S1) or double-layer shading (S2) were placed approximately 2 m above the plants, with the control plants only exposed to natural light (S0). Standard agricultural practices for fertilization, irrigation, and pest control were applied uniformly throughout the experiment. After 30 days of shading treatment, leaf samples were collected from the tops of the plants in triplicates, immediately frozen in liquid nitrogen, and then stored at −80 °C for subsequent physiological and transcriptomic analyses.
5.2. Measurement of Growth and Morphological Characterization and Determination of Chlorophyll Content
After 30 days of exposure to shading, plant growth parameters, including plant height, chlorophyll content, relative conductivity, and relative water content, were measured. To determine chlorophyll content, 0.1 g of fresh L. chinensis leaves were cut into small pieces and immersed in 10 mL of acetone for overnight extraction until the leaves were completely white. The resulting extract was thoroughly mixed and analyzed using a UV spectrophotometer (SHIMADZU UV-2700, Kyoto, Japan) at wavelengths of 663 nm and 646 nm [51]. Chlorophyll content was determined using the following formula: chlorophyll a = 12.21A_663_ − 2.81A_646_, chlorophyll b = 20.13A_646_ − 5.03A_663,_ where A is the absorbance at the specific wavelengths.
5.3. Measurements of Photosynthetic Parameters and Antioxidant Enzyme Activities
The photosynthetic parameters, including Pn, Gs, Ci, and E, were measured using a Li-6800 photosynthetic system (LI-COR, Lincoln, NE, USA) on the second fully expanded L. chinensis leaf from the apex between 9:00 a.m. and 12:00 p.m. on a sunny day in triplicates for each leaf. The activities of SOD, CAT, POD, and MDA from the control and treated L. chinensis leaves were measured using commercial kits supplied by Suzhou Keming Biotechnology Co. (Suzhou, China), according to the manufacturer’s instructions.
5.4. Transcriptome Analysis and Quantitative Real-Time PCR (qRT-PCR) Validation
The total RNA was extracted from L. chinensis leaves using the FastPure Universal Plant Total RNA Isolation Kit (VAZYME, Nanjing, China), according to the manufacturer’s instructions. The cDNA was obtained using the HiScript IV 1st Strand cDNA Synthesis Kit (+gDNA wiper) (RC411-01; VAZYME, Nanjing, China), according to the manufacturer’s instructions. The cDNA libraries for the 18 L. chinensis leaf samples were constructed and sequenced using the Illumina Novaseq6000 platform (BGI Bioinformatics Institute, Beijing, China). Specifically, 18 cDNA libraries were generated, with 9 libraries derived from Lc3 (3 for each shading treatment: S0, S1, and S2) and 9 from Lc5 (3 for each shading treatment: S0, S1, and S2). The raw sequence data were processed by filtering out low-quality reads. Fastp v 0.19.3 was used to filter raw data by mainly removing reads containing adapters. Specifically, sequencing error rates and GC content distribution were assessed to ensure the acquisition of clean reads suitable for downstream analyses. StringTie v1.3.4d was used for novel gene prediction and de novo assembly of clean reads. The genes were annotated by aligning sequences with those found in the Non-Redundant (NR), Nucleotide (NT), Kyoto Encyclopedia of Genes and Genomes (KEGG), Swiss-Prot, PFAM, GO, and Clusters of Orthologous Groups (KOG) databases. The differential gene expression analysis between two groups of the different shading groups S0, S1, and S2 was conducted using the DESeq2 v1.22.1 R package, while the ClusterProfiler v4.14.6 R package was used to investigate the enriched DEGs in KEGG pathways. The criteria for identifying differential genes included the use of |log_2_FoldChange| > 1 and FDR < 0.05. The qRT-PCR was performed on a Bio-RAD CFX96™ Touch (Bio-Rad Laboratories, Inc., Hercules, CA, USA) using ChamQ SYBR Color qPCR Master Mix (VAZYME, Nanjing, China), with Actin as an internal reference primer. The qRT-PCR reaction mixture was carried in a total of 20 µL consisting of 10 µL ChamQ SYBR Green qPCR Master Mix (Q411, Vazyme, Nanjing, China), 0.4 µL of each forward and reverse primer, and 2 µL of cDNA. The amplification program consisted of an initial denaturation at 95 °C for 30 s followed by 39 cycles, each consisting of denaturation at 95 °C for 10 s; annealing at 60 °C for 30 s; and extension at 72 °C for 30 s. All primers used in this study are listed in Table S8.
5.5. WGCNA
Based on previous studies [52], the minimum appropriate sample size was employed for the weighted correlation network analysis. A threshold of FPKM < 1 was applied to filter out invalid gene expressions in each sample. The R software package v4.14.6 was used to automate the network to construct co-expression modules comprising the selected genes. Subsequently, adjacency matrices were converted into topological overlap matrices to identify modules associated with specific L. chinensis samples in the reconstructed network. Genes with similar expression patterns were grouped into the same module and used to identify hub genes. The eigengene values of each module were calculated and used to analyze the correlation between genes and traits. Subsequently, Cytoscape v.3.10.2 software was used to visualize the co-expression networks.
5.6. Statistical Analysis
All data analyses and visualizations were performed using GraphPad Prism 8.0 (GraphPad Software, Boston, MA, USA). The effects of different shading treatments on physiological parameters were evaluated using SPSS 19.0 (IBM Corp., New York, NY, USA). Statistical significance was evaluated using one-way analysis of variance (ANOVA), followed by Tukey’s post hoc test and Student’s t-test, with significance levels defined as * p < 0.05 and ** *p * < 0.01. DEMs and DEGs were represented as heat maps and generated through TBtools v2.012.
The reference list from the paper itself. Each links out to its DOI / PubMed record.
- 1Hu X. Wang D. Ren S. Feng S. Zhang H. Zhang J. Qiao K. Zhou A. Inhibition of root growth by alkaline salts due to disturbed ion transport and accumulation in Leymus chinensis Environ. Exp. Bot.202220010490710.1016/j.envexpbot.2022.104907 · doi ↗
- 2Chen S. Huang X. Yan X. Liang Y. Wang Y. Li X. Peng X. Ma X. Zhang L. Cai Y. Transcriptome analysis in sheepgrass (Leymus chinensis): A dominant perennial grass of the Eurasian Steppe P Lo S ONE 20138 e 6797410.1371/journal.pone.006797423861841 PMC 3701641 · doi ↗ · pubmed ↗
- 3Li X. Jia J. Zhao P. Guo X. Chen S. Qi D. Cheng L. Liu G. Lc MYB 4, an unknown function transcription factor gene from sheepgrass, as a positive regulator of chilling and freezing tolerance in transgenic Arabidopsis BMC Plant Biol.20202023810.1186/s 12870-020-02427-y 32460695 PMC 7333390 · doi ↗ · pubmed ↗
- 4Zhao P. Hou S. Guo X. Jia J. Yang W. Liu Z. Chen S. Li X. Qi D. Liu G. A MYB-related transcription factor from sheepgrass, Lc MYB 2, promotes seed germination and root growth under drought stress BMC Plant Biol.20191956410.1186/s 12870-019-2159-231852429 PMC 6921572 · doi ↗ · pubmed ↗
- 5Gao Q. Li X. Jia J. Zhao P. Liu P. Liu Z. Ge L. Chen S. Qi D. Deng B. Overexpression of a novel cold-responsive transcript factor Lc FIN 1 from sheepgrass enhances tolerance to low temperature stress in transgenic plants Plant Biotechnol. J.20161486187410.1111/pbi.1243526234381 PMC 11389128 · doi ↗ · pubmed ↗
- 6Li X. Gao Q. Liang Y. Ma T. Cheng L. Qi D. Liu H. Xu X. Chen S. Liu G. A novel salt-induced gene from sheepgrass, Lc SAIN 2, enhances salt tolerance in transgenic Arabidopsis Plant Physiol. Biochem.201364525910.1016/j.plaphy.2012.12.01423353766 · doi ↗ · pubmed ↗
- 7Xiaoxia L. Shuguo H. Qiong G. Pincang Z. Shuangyan C. Dongmei Q. Byung-Hyun L. Long C. Gongshe L. Lc SAIN 1, a novel salt-induced gene from Sheepgrass, confers salt stress tolerance in transgenic Arabidopsis and Rice Plant Cell Physiol.201354117211852369550310.1093/pcp/pct 069 · doi ↗ · pubmed ↗
- 8Zhang S. Gong J. Zhang W. Dong X. Hu Y. Yang G. Wang T. Photovoltaic systems promote grassland restoration by coordinating water and nutrient uptake, transport and utilization J. Clean. Prod.202444714143710.1016/j.jclepro.2024.141437 · doi ↗