The Association of Heart Failure and Liver T1 Mapping in Cardiac Magnetic Resonance Imaging
Adrian T. Huber, Joanna Bartkowiak, Robin Seitz, Benedikt Bernhard, Martina Boscolo Berto, Giancarlo Spano, Benedikt Wagner, Verena C. Obmann, Lukas Ebner, Inga A. S. Todorski, Michael P. Brönnimann, Kady Fischer, Dominik P. Guensch, Andreas Christe, Annalisa Berzigotti

TL;DR
This study found that higher T1 values in specific liver regions on MRI are linked to heart failure, offering a potential new imaging marker for the condition.
Contribution
The study identifies liver T1 mapping in the caudate and right lobes as a novel, independent predictor of heart failure using cardiac MRI.
Findings
Patients with elevated NT-proBNP had significantly higher T1 values in the right and caudate liver lobes.
T1 mapping in the caudate and right lobes independently predicted heart failure after adjusting for confounders.
T1 values in the left liver lobe and dome did not show significant associations with heart failure.
Abstract
Background/Objectives: The objective of this study was to investigate the association between congestive heart failure (CHF) and T1 mapping in both liver lobes using cardiac MRI. Methods: This retrospective study included patients who underwent cardiac MRI with T1 mapping sequences on a 1.5 T scanner. The liver T1 values were measured in four hepatic regions, utilizing cardiac short axis and four-chamber views. Echocardiographic and laboratory data were collected within 90 days of the cardiac MRI. Comparisons of the liver T1 values and echocardiographic parameters between patients with and without elevated NT-proBNP levels (>125 pg/mL) were conducted using the Mann–Whitney U test. Logistic regression models were employed to adjust for confounding factors. Results: A total of 397 patients were included (with a median age of 56 years; 127 females), of whom 35% (n = 138) exhibited elevated…
Genes, proteins, chemicals, diseases, species, mutations and cell lines named across the full text — each resolved to its canonical identifier and authoritative record.
Click any figure to enlarge with its caption.
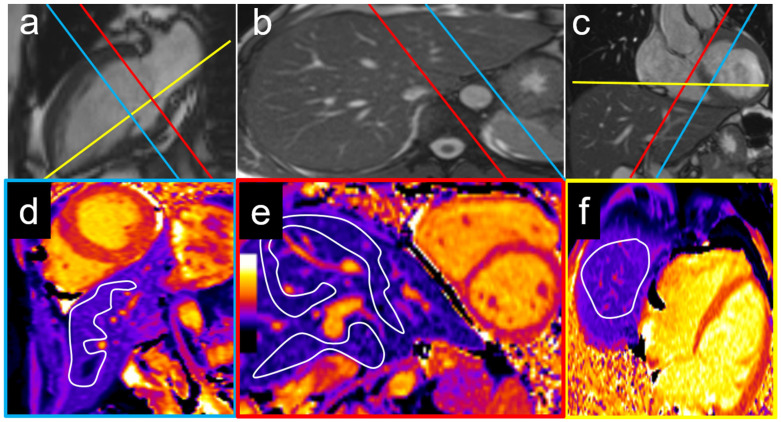 Figure 1
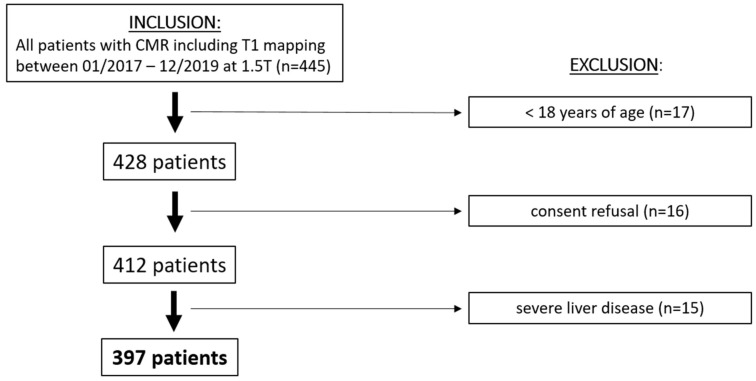 Figure 2
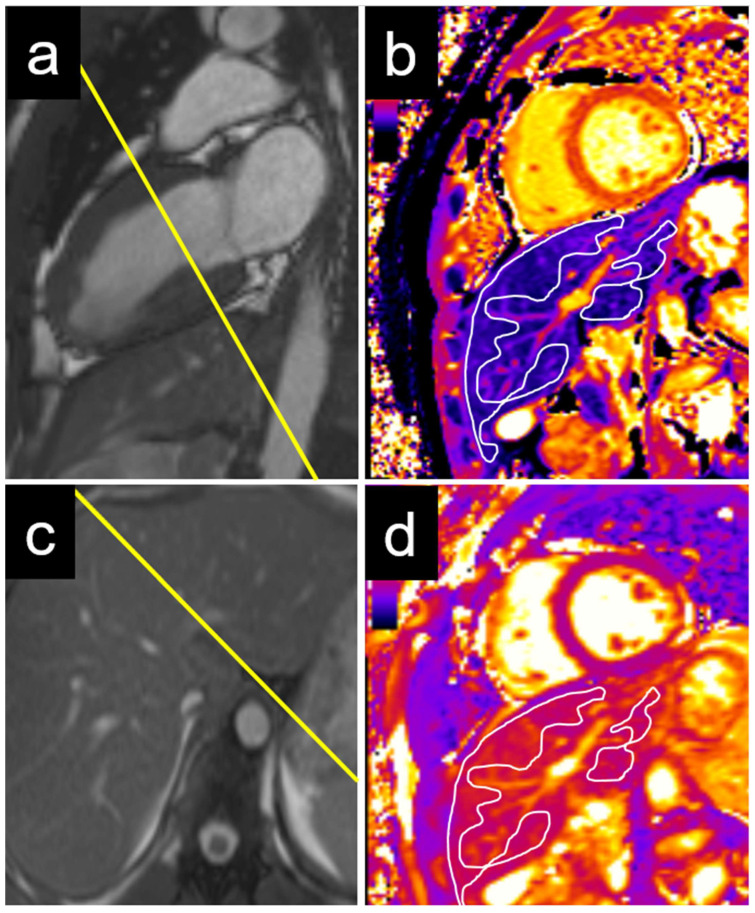 Figure 3
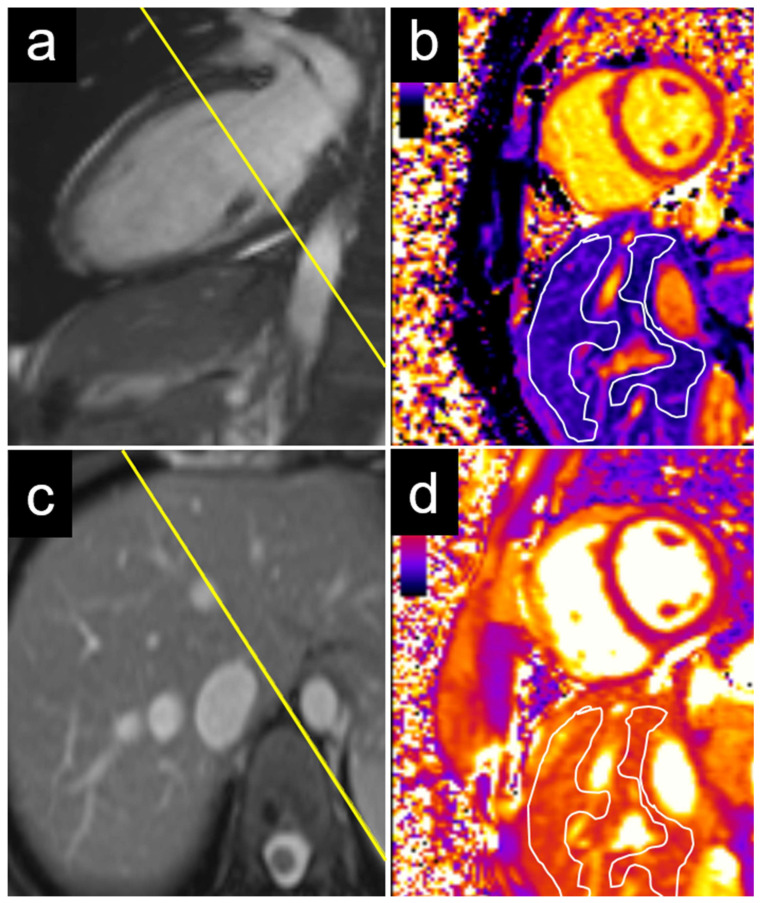 Figure 4
- —European School of Radiology (ESOR)
- —Clinical Trial Unit (CTU) Bern
- —Swiss Society of Radiology (SGR)
- —Biotronik
- —Boston Scientific
- —Edwards Lifesciences
- —HighLifeSAS
- —Swiss National Science Foundation
- —Swiss Academy of Medical Sciences
- —Helmut Hartweg Foundation
- —Foundation to Fight against Cancer
- —Bayer
- —Bracco
- —Siemens
Peer Reviews
No public reviews on file for this paper yet. If you reviewed it on a platform where reviews are public (OpenReview, ICLR, NeurIPS, ICML), you can paste yours below so the community can read it here.
Videos
No videos yet. Explain this paper in a talk, walkthrough, or lecture? Add one.
Taxonomy
TopicsAdvanced MRI Techniques and Applications · Cardiovascular Function and Risk Factors · Cardiac Imaging and Diagnostics
1. Introduction
Heart failure is a common indication for cardiac magnetic resonance imaging (MRI) [1] and has been associated with poor cardiovascular outcomes in patients with myocardial infarction [2], non-ischemic cardiomyopathy [3,4], myocarditis [5], valvular heart disease [6], and pulmonary hypertension [7]. Heart failure is associated with elevated left ventricular filling pressures that may be estimated non-invasively by N-terminal B-type natriuretic peptide (NT-proBNP) [8,9] and diastolic evaluation using echocardiography [10,11]. While the diastolic parameters derived from cardiac MRI correlate well with echocardiographic measurements, their association with invasive filling pressure assessments remains moderate in both modalities [12,13]. A combination of the left atrial volume index (LAVI) with mitral flow and tissue Doppler (TDI) may increase the accuracy in echocardiography [14]. Similarly, cardiac MRI integrates functional parameters with myocardial T1, T2, and extracellular volume (ECV) mapping to evaluate myocardial fibrosis, edema [15,16], and outcome prediction [17]. However, a fast and straightforward parameter to identify elevated central venous pressure and congestion would significantly simplify the assessment of patients with suspected heart failure.
The liver, as a large upstream organ affected by cardiac function, is often involved in heart failure but is frequently overlooked in clinical evaluations [18]. Congestive liver disease, characterized by passive sinusoidal dilatation, can progress to peri-sinusoidal collagen deposition, leading to cardiac liver fibrosis and cirrhosis [19,20]. While cardiac cirrhosis is irreversible, cardiac liver congestion is transient and asymptomatic in most cases with absent or only mild liver fibrosis [21].
Recently, elevated ultrasound-based transient elastography liver stiffness measurements have been associated with elevated cardiac filling pressures and adverse outcomes in patients with heart failure [22]. Unfortunately, elastography techniques are not usually available during cardiac MRI or require additional hardware installation [23].
T1 mapping sequences are nowadays routinely performed during cardiac MRI and do not only cover the heart but also parts of the liver in the standard fields of view. T1 measurements of the liver are rapidly performed in a single region of interest (ROI) without the necessity for additional image acquisitions or post-processing and may yield important information about liver congestion. In a recent proof-of-concept cardiac MRI study, patients with decompensated dilated cardiomyopathy (DCM) had higher liver T1 values than patients with compensated DCM [24].
This study aimed to evaluate the association of magnetic resonance liver T1 mapping with congestive heart failure and its role as a non-invasive imaging biomarker.
2. Materials/Methods
2.1. Primary Study Population
This retrospective study included patients who underwent cardiac MRI between January 2017 and December 2019, incorporating T1 and T2 mapping sequences acquired on a single 1.5 T scanner. This study was approved by the local ethics committee and conducted in compliance with the principles outlined in the Declaration of Helsinki. Written informed consent was obtained from all the participants.
The exclusion criteria included ages below 18 years, a refusal to provide consent, or a history of chronic liver disease (CLD). The CMR indications of all the examinations are provided in the Supplementary Materials (Table S1).
2.2. Baseline Evaluation
Clinical and laboratory data were extracted from electronic medical records, while cardiac MRI information was obtained from the Centricity RIS system (GE Healthcare, General Electric Company, Chicago, IL, USA).
The laboratory parameters analyzed included liver markers (bilirubin, alanine aminotransferase [ALAT], and aspartate aminotransferase [ASAT]), cardiac biomarkers (troponin-T and NT-proBNP), and general indicators such as hematocrit and creatinine levels. Clinical data, including age, body mass index (BMI), and history of myocardial infarction, were also collected for all the participants (Table 1).
Heart failure was defined as an NT-proBNP level exceeding 125 pg/mL, consistent with the European Society of Cardiology (ESC) guidelines [25].
2.3. Cardiac Magnetic Resonance Imaging Protocol
All the participants underwent imaging on a Siemens MAGNETOM Aera 1.5 T scanner (Siemens Healthineers, Erlangen, Germany) using a 6-channel body coil. The standard cardiac MRI sequences were acquired during end-expiratory breath-holds, including steady-state free precession (SSFP) cine images in short axis, two-chamber, three-chamber, and four-chamber views. The imaging parameters included a field of view of 276 × 340 mm, a matrix size of 208 × 256, a repetition time/echo time (TR/TE) of 2.4/1.2 ms, an in-plane resolution of 1.4 × 1.4 mm, a section thickness of 8 mm, and a flip angle of 80°.
The T1 mapping was performed with motion correction using a modified Look–Locker inversion recovery sequence (5[3]3 scheme), acquired 15 min before and after the intravenous contrast administration. The imaging parameters for the T1 mapping included a TR/TE of 344/1.12 ms, a matrix size of 218 × 256, a flip angle of 35°, a pixel size of 1.41 × 1.41 mm, and a slice thickness of 8 mm.
The T2 mapping was conducted with motion correction using a three-point T2-prepared steady-state free precession sequence prior to the contrast administration. The parameters for the T2 mapping included TR/TE values of 300/0, 24, and 55 ms; a matrix size of 206 × 256; a flip angle of 35°; a pixel size of 1.41 × 1.41 mm; and a slice thickness of 8 mm.
2.4. Echocardiography Analysis
The echocardiography examinations were reviewed by two cardiology fellows (J.B. and B.B.) under the guidance of an echocardiography expert (N.B.). Echocardiograms performed within 90 days of the cardiac MRI were considered eligible for analysis. The measurements were conducted using TOMTEC-ARENA software (TTA 2.51, Tomtec Imaging GmbH, Unterschleissheim, Germany).
The left atrial end-systolic diameter and volume were measured from the parasternal long axis, apical four-chamber, and apical two-chamber views. The left ventricular diastolic function was assessed through a pulsed wave Doppler of the mitral inflow and tissue Doppler imaging (TDI) of the mitral annulus in the apical four-chamber view. Key metrics included the mitral inflow early-to-late diastolic flow ratio (E/A), peak early diastolic TDI velocity at the mitral annulus (mean E’), and the ratio of the early diastolic transmitral flow velocity to the mitral annular early diastolic TDI velocity (mitral E/E’).
The left ventricular systolic function was evaluated using the ejection fraction, calculated by Simpson’s biplane method. The right ventricular systolic function was assessed via the tricuspid annular plane systolic excursion (TAPSE), the peak systolic TDI velocity at the right ventricular lateral annulus (RV S’), and measurements of the right ventricular global and free wall longitudinal strain. The left ventricular filling pressures were analyzed following the European Association of Cardiovascular Imaging guidelines [26].
2.5. Cardiac MRI Analysis
The cardiac functional parameters and volumetric data were evaluated by the radiology and cardiology fellows (A.P., I.T., M.B., B.W., and G.S.) under the supervision of two experienced imaging specialists (C.G. and A.H.). The left and right ventricular epicardial and endocardial borders were segmented using a dedicated workstation (SyngoVia VB30, Siemens Healthcare, Erlangen, Germany). The regions of interest (ROIs) were manually delineated on the liver in the short axis and four-chamber views from the T1 and T2 mapping sequences (R.S. and A.P.), carefully avoiding the vascular and biliary structures.
The ROIs were placed in the following liver regions: the left liver lobe (segments II and III) on the cardiac midventricular short axis view, the right liver lobe (segments IVa and VIII) and caudate lobe (segment I) on the cardiac basal short axis view, and the liver dome (segment VIII) on the cardiac four-chamber view (Figure 1). The extracellular volume (ECV) was computed using the following formula:
2.6. Statistical Analysis
The continuous variables are presented as medians with the interquartile ranges (IQRs), and the group comparisons were conducted using the Mann–Whitney U test. The categorical variables are expressed as absolute numbers and percentages, with the comparisons between the groups performed using Fisher’s exact test. To evaluate the predictive value of parameters such as T1 relaxation time, age, and gender for elevated NT-proBNP levels, a univariate (binary) logistic regression analysis was conducted. Subsequently, a multivariate logistic regression model was applied to account for potential interdependencies among significant parameters. A p-value of <0.05 was considered indicative of statistical significance. All the statistical analyses and data visualizations were carried out using SPSS Statistics (version 25.0, IBM Corp., Armonk, NY, USA) and GraphPad Prism (version 8, GraphPad Software, Inc., San Diego, CA, USA).
3. Results
3.1. Final Study Population
Among 447 consecutive patients who underwent cardiac MRI with T1 and T2 mapping between 01/2017 and 12/2019, 397 patients met the inclusion criteria (Figure 2, Table 1). The median age was 56 years [IQR, 37–69 years]. A total of 127 participants (32%) were females, and 138 participants (35%) presented with elevated NT-proBNP. The patients with elevated NT-proBNP were older (61 [IQR, 51–75] vs. 53 [IQR, 33–75] years; p < 0.001) and had higher CRP (6 [IQR, 1–30] vs. 2 [IQR, 1–10] mg/L, p = 0.002) and creatinine levels (87 [IQR, 74–109] vs. 77 [IQR, 67–88] µmol/L, p < 0.001) (Table 1). Furthermore, they had a higher prevalence of pulmonary hypertension (8.7% vs. 1.2%; p < 0.001), atrial fibrillation (15.9% vs. 5.8%; p < 0.001), myocardial infarction (39.9% vs. 14.3%; p < 0.001), diabetes (27.5% vs. 8.9%; p < 0.001), and heart failure (42.8% vs. 8.1%, p < 0.001).
3.2. Association of Cardiac MRI and Echocardiography Imaging Parameters with NT-proBNP
The patients with elevated NT-proBNP had a higher left ventricular end-diastolic volume index (92 [IQR, 72–112] vs. 81 [IQR, 70–94] mL/m^2^; p < 0.001), a lower left ventricular ejection fraction (50 [IQR, 34–62] vs. 60 [IQR, 56–64] %; p < 0.001), and a higher left ventricular mass index (77 [IQR, 62–93] vs. 67 [IQR, 57–77] g/m^2^; p < 0.001) in the cardiac MRI (Table 2). In the echocardiography, the patients with elevated NT-proBNP had a lower E’ mean (7 [IQR, 5–9] vs. 9 [IQR, 6–12]; p < 0.001), higher estimated left ventricular filling pressures E/E’ (11 [IQR, 7–15] vs. 8 [IQR, 7–10]; p < 0.001), and a larger LAVI (35 [IQR, 24–43] vs. 26 [IQR, 20–33] ml/m^2^; p < 0.001). Additionally, the right ventricular global longitudinal strain (GLS) was lower in the patients with elevated NT-proBNP (14 [IQR, 10–19] vs. 18 [IQR, 14–21] %; p < 0.001), and the RV/RA gradients were higher (23 [IQR, 17–33] vs. 20 [IQR, 9–25] mmHg; p < 0.001).
3.3. Association of Liver T1 and T2 with NT-proBNP
The liver T1 was significantly longer in patients with elevated NT-proBNP when measured in both the right lobe (670 ms [IQR, 648–708; n = 69] vs. 596 ms [IQR, 568–628; n = 23]; p < 0.001) and the caudate lobe (664 ms [IQR, 640–708; n = 69] vs. 598 ms [IQR, 578–633; n = 23]; p < 0.001) (Table 3). A trend towards higher T1 values was observed in the left lobe (571 ms [IQR, 536–631; n = 190] vs. 568 ms [IQR, 530–606; n = 115]; p = 0.068) and liver dome (590 ms [IQR, 540–629; n = 52] vs. 560 ms [IQR, 533–595; n = 19]; p = 0.1) (Table 3). No significant difference was found in the liver T2 between the two groups.
An echocardiographic evaluation revealed similar results, with significant differences in the T1 values between patients with elevated and non-elevated left ventricular filling pressures in the caudate and right liver lobes, but not in the left lobe or liver dome (Table 3). Examples of the liver T1 and T2 measurements are provided for a patient with normal NT-proBNP levels (Figure 3) and for a patient with elevated NT-proBNP levels (Figure 4).
3.4. Predictive Value of Liver T1 to Determine Elevated NT-proBNP
In the univariate logistic regression analysis, the liver T1 was associated with elevated NT-proBNP when measured in the caudate (OR 1.016 [95% CI: 1.007, 1.025]; p = 0.001) and right liver lobes (OR 1.015 [95% CI: 1.007, 1.023]; p < 0.001; Table 4). Additionally, age (OR 1.027 [95% CI: 1.015, 1.039]; p < 0.001), LVEF (OR 0.938 [95% CI: 0.921, 0.955]; p < 0.001), and atrial fibrillation (OR 3.085 [95% CI: 1.544, 6.166]; p = 0.001) were associated with the elevation of NT-proBNP, but not sex, BMI, or creatinine.
The liver T1 remained independently associated with elevated NT-proBNP levels in the multivariate logistic regression model, including age, LVEF, and the presence of atrial fibrillation as potential confounders, when measured in the caudate lobe (OR 1.013 [95% CI: 1.004, 1.023]; p = 0.005; Table 4, model 1) and in the right liver lobe (OR 1.012 [95% CI: 1.003, 1.021]; p = 0.009; Table 4, model 2).
4. Discussion
This study aimed to evaluate the association of congestive heart failure with magnetic resonance liver T1 mapping as a non-invasive imaging surrogate. The liver T1 was significantly increased in patients with elevated NT-proBNP and elevated LV filling pressure evaluated by echocardiography, when measured in the right liver lobe and the caudate lobe. These measurements were obtained from standard cardiac MRI T1 mapping acquisitions on a basal short axis view. However, the liver T1 in the left liver lobe, as obtained from the mid-ventricular short axis view did not show any significant association with heart failure.
This observation may be explained by a hydrostatic effect, since liver congestion due to heart failure is more pronounced in the dependent right liver lobe and caudate lobe, compared to the more central position of the left liver lobe directly adjacent to the heart below the diaphragm.
In accordance with the existing literature, the liver T1 was increased in congestive liver disease, mediated by sinusoidal dilatation and fluid accumulation in the interstitial space [24]. Similarly, results from the Multi-Ethnic Study of Atherosclerosis showed an association between an increased liver T1 and a history of atrial fibrillation, heart failure, and coronary heart disease [27]. Another study showed an association between heart failure and congestive liver disease based on liver stiffness measurements using transient elastography [22]. Recently, an independent predictive value of the liver T1 regarding cardiovascular mortality and morbidity was shown, without closer differentiation of the liver segments [28]. The current findings are in line with those prior studies. However, the current results indicate that an even better association of liver T1 and congestive heart failure is observed when the liver T1 is measured in the caudate or right liver lobe. These findings are supported by observations of patients with Fontan-associated liver disease, showing a large heterogeneity of liver congestion with a higher vulnerability of the caudate and right liver lobes [29,30]. Furthermore, the most cranial parts of the liver, namely, the liver dome and the cranial parts of liver segment II, are prone to partial volume and the susceptibility effects of the air in the adjacent basal parts of the lungs [31].
Another interesting aspect is the correlation between the right heart function and liver T1. A recent study by Ide et al. reported no significant difference regarding the liver T1 in patients with compared to patients without RV enlargement but observed a moderate positive correlation between the RVEDVi and T1 values of the right liver lobe in patients with an enlarged RV in a cohort of congenital heart disease patients [30]. In contrast, our findings demonstrate a significantly lower RVEF in patients with elevated NT-proBNP levels compared to those with normal NT-proBNP levels, despite there being no significant difference in RV volumes between the two groups. These discrepancies may stem from differences in the study populations; notably, patients with severe CHD were excluded from the current analysis, and most participants had indexed RV volumes within the normal range.
However, subsequent studies are warranted to externally validate the current findings and to investigate whether T1 measurements in the caudate and right liver lobes—measured on a cardiac basal short axis view or additional transversal T1 mapping acquisition of the liver—will show a higher association with adverse outcomes than measurements in the left liver lobe on a cardiac midventricular short axis view. In addition, the liver T1 should be investigated in different clinical applications, including, but not limited to, patients with atrial fibrillation, myocarditis, coronary artery disease, metabolic syndrome, and heart failure with a preserved ejection fraction.
The liver T1 is a promising supplemental imaging biomarker for heart failure, and its prognostic significance warrants further investigation in future studies. In this study, the liver T1 demonstrated a correlation with NT-proBNP, a marker of cardiac wall stress frequently related to elevated left ventricular filling pressures. Consequently, the liver T1 may provide valuable additional insights into assessing the actual volume status in patients with heart failure with a reduced ejection fraction (HFrEF) and contribute to the characterization and prognostication of patients with heart failure with a preserved ejection fraction (HFpEF). Further studies should explore these associations and their prognostic significance and implications, including the relevance of an elevated T1 in patients with isolated right heart failure, moderate-to-severe tricuspid regurgitation, and pulmonary hypertension. Based on these findings, the liver T1 measurement in CMR may offer valuable insights for clinicians and potentially influence patient management by facilitating the early diagnosis and timely initiation of heart failure treatment. Conversely, T1 mapping in dedicated liver MRI may provide important information about a patient’s cardiopulmonary status, which is often linked to acute and chronic liver failure, including portopulmonary hypertension. However, the liver T1 should be carefully interpreted in conjunction with other parametric MR sequences to account for potential confounding factors such as liver steatosis, fibrosis, and inflammation.
This study has several limitations. First, this was a retrospective study and the NT-proBNP and echocardiography parameters were not available on the day of the cardiac MRI exams in all the patients. However, the association of an elevated liver T1 and elevated filling pressures was independently confirmed in a separate analysis of a subset of 166 patients with echocardiography. A second limitation is the site-specific character of the results. As mentioned in earlier studies, the T1-weighted mapping values vary between different institutions and scanner vendors [32,33,34]. To allow comparability between different patients, standardized protocols are pertinent to derive the institution-specific reference ranges. Third, NT-proBNP is primarily renally cleared and patients with kidney failure could present with high NT-proBNP levels not linked to heart failure [35]. However, the logistic regression analysis showed no significant association between the serum creatinine and NT-proBNP levels. Finally, no clinical outcome variables such as adverse cardiac events or death by cardiovascular cause were analyzed, since this was not the primary scope of this study and the follow-up intervals would have not been sufficient.
In conclusion, an elevated T1 in the caudate and right liver lobes with cardiac MRI was independently associated with congestive heart failure and performed better than the T1 in the left liver lobe. Dedicated separate liver T1 mapping acquisition may further improve the presented results. If external validation in independent cohorts reveals similar results, the liver T1 may improve patient characterization and the quantification of congestive heart failure with cardiac MRI.
The reference list from the paper itself. Each links out to its DOI / PubMed record.
- 1Gonzalez J.A. Kramer C.M. Role of Imaging Techniques for Diagnosis, Prognosis and Management of Heart Failure Patients: Cardiac Magnetic Resonance Curr. Heart Fail. Rep.20151227628310.1007/s 11897-015-0261-926041670 PMC 4496303 · doi ↗ · pubmed ↗
- 2Møller J.E. Pellikka P.A. Hillis G.S. Oh J.K. Prognostic importance of diastolic function and filling pressure in patients with acute myocardial infarction Circulation 200611443844410.1161/CIRCULATIONAHA.105.60100516880341 · doi ↗ · pubmed ↗
- 3Miyaji Y. Iwanaga Y. Nakamura T. Yasuda M. Kawamura T. Miyazaki S. Interrelationship between the Myocardial Mass, Fibrosis, BNP, and Clinical Outcomes in Hypertrophic Cardiomyopathy Intern. Med.2016551261126810.2169/internalmedicine.55.648027181530 · doi ↗ · pubmed ↗
- 4Katz D.H. Beussink L. Sauer A.J. Freed B.H. Burke M.A. Shah S.J. Prevalence, clinical characteristics, and outcomes associated with eccentric versus concentric left ventricular hypertrophy in heart failure with preserved ejection fraction Am. J. Cardiol.20131121158116410.1016/j.amjcard.2013.05.06123810323 PMC 3788852 · doi ↗ · pubmed ↗
- 5Magnani J.W. Danik H.J. Dec G.W.Jr. Di Salvo T.G. Survival in biopsy-proven myocarditis: A long-term retrospective analysis of the histopathologic, clinical, and hemodynamic predictors Am. Heart J.200615146347010.1016/j.ahj.2005.03.03716442915 · doi ↗ · pubmed ↗
- 6Dahl J.S. Videbæk L. Poulsen M.K. Pellikka P.A. Veien K. Andersen L.I. Haghfelt T. Møller J.E. Noninvasive assessment of filling pressure and left atrial pressure overload in severe aortic valve stenosis: Relation to ventricular remodeling and clinical outcome after aortic valve replacement J. Thorac. Cardiovasc. Surg.2011142 e 77e 8310.1016/j.jtcvs.2011.01.03221353251 · doi ↗ · pubmed ↗
- 7Bredfelt A. Rådegran G. Hesselstrand R. Arheden H. Ostenfeld E. Increased right atrial volume measured with cardiac magnetic resonance is associated with worse clinical outcome in patients with pre-capillary pulmonary hypertension ESC Heart Fail.2018586487510.1002/ehf 2.1230429916558 PMC 6165945 · doi ↗ · pubmed ↗
- 8Weber M. Hamm C. Role of B-type natriuretic peptide (BNP) and NT-pro BNP in clinical routine Heart 20069284384910.1136/hrt.2005.07123316698841 PMC 1860679 · doi ↗ · pubmed ↗