Unraveling the Prognostic Significance of BRCA1-Associated Protein 1 (BAP1) Expression in Advanced and Castrate-Resistant Prostate Cancer
Norel Salut, Yaser Gamallat, Sima Seyedi, Joema Felipe Lima, Sunita Ghosh, Tarek A. Bismar

TL;DR
Low BAP1 expression in prostate cancer is linked to worse survival and more aggressive disease, suggesting it could help predict outcomes when combined with other genetic markers.
Contribution
This study identifies BAP1 as a potential prognostic biomarker in advanced and castrate-resistant prostate cancer when combined with other genomic alterations.
Findings
Lower BAP1 nuclear expression is significantly associated with worse overall and cause-specific survival in prostate cancer patients.
BAP1 expression combined with PTEN loss or ERG positivity predicts more aggressive disease and poorer outcomes.
High BAP1 expression correlates with better survival when paired with favorable genomic profiles like wild-type p53 and low AR expression.
Abstract
Prostate cancer remains one of the major cancers affecting men worldwide. Currently, reliable biomarkers to associate with disease progression are in need. We assessed the expression significance between BAP1 and prostate cancer patients’ outcomes. The results showed that lower expression of BAP1 is associated with worse overall survival and lethal disease vs. those with higher intensity. BAP1 expression was also correlated with other known genomic changes in prostate cancer. Incorporating BAP1 expression may have prognostic value in men affected by prostate cancer. Prostate cancer (PCa) is ranked as one of the top cancers affecting men in Western societies. BRCA1-associated protein 1 (BAP1) expression significance has been observed in various cancers, including prostate cancer. The search for prognostic models allowing better risk stratification and prediction of disease progression…
Genes, proteins, chemicals, diseases, species, mutations and cell lines named across the full text — each resolved to its canonical identifier and authoritative record.
Click any figure to enlarge with its caption.
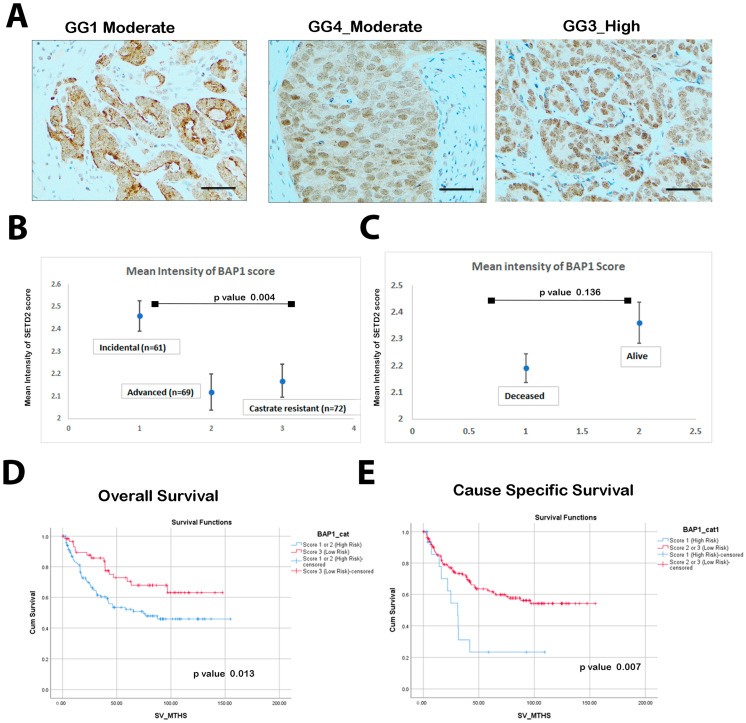 Figure 1
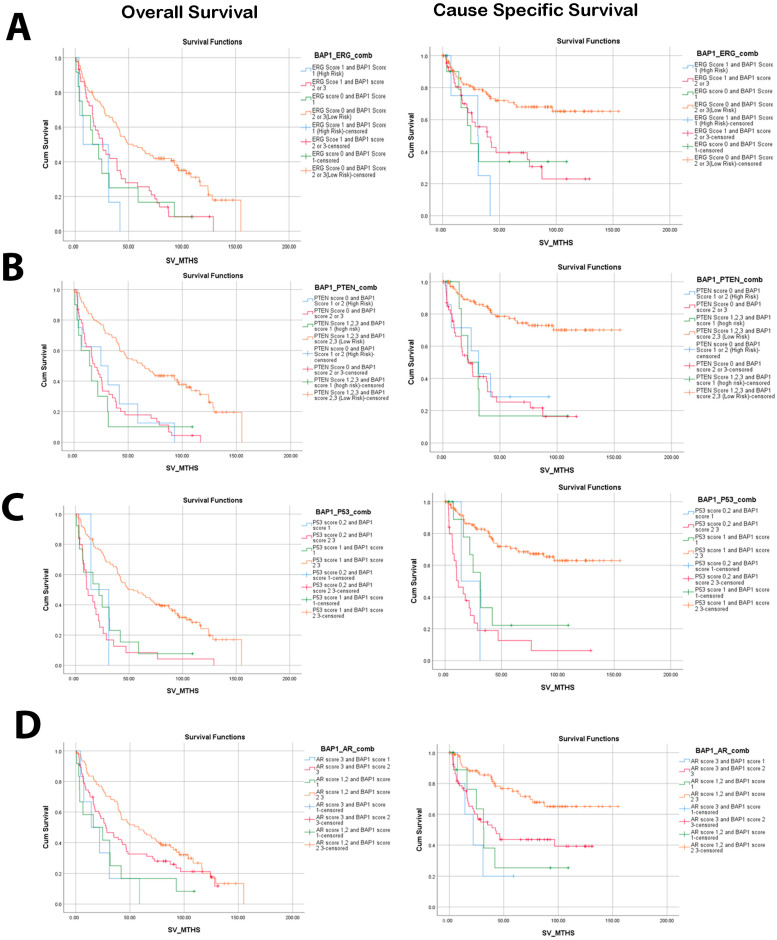 Figure 2
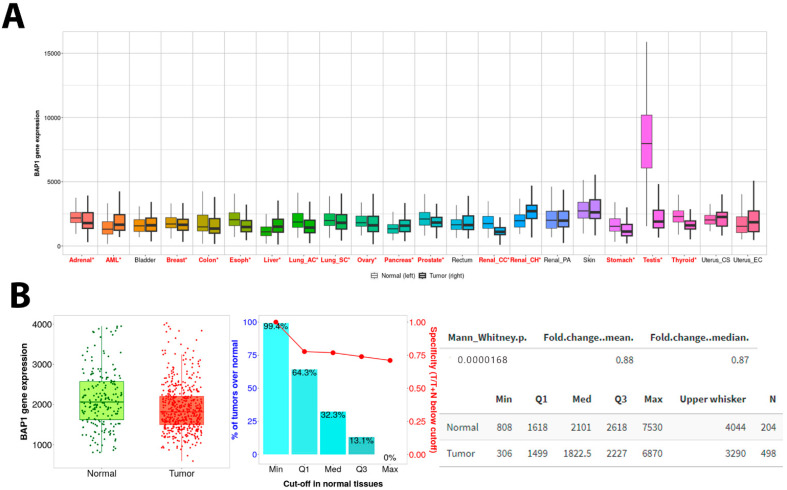 Figure 3
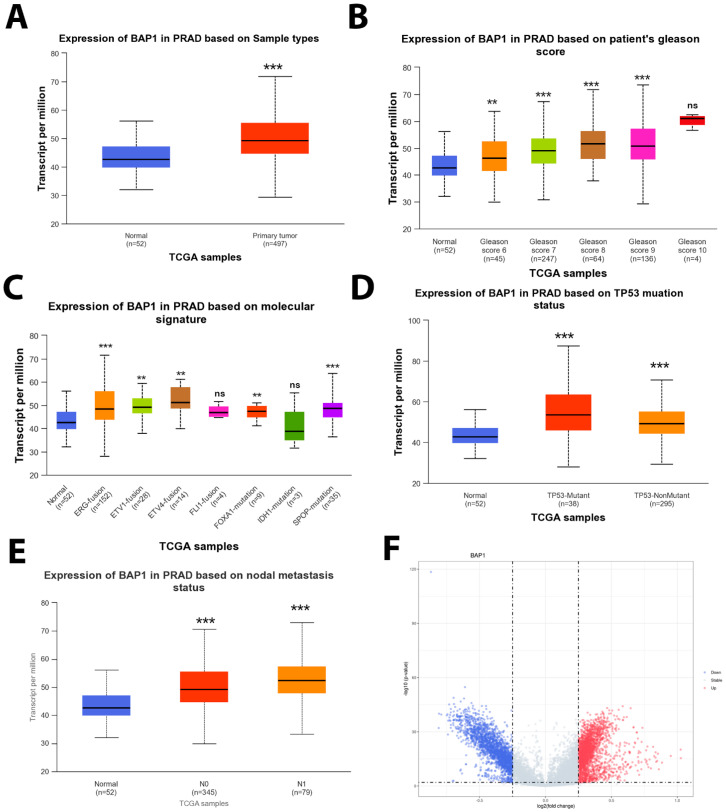 Figure 4
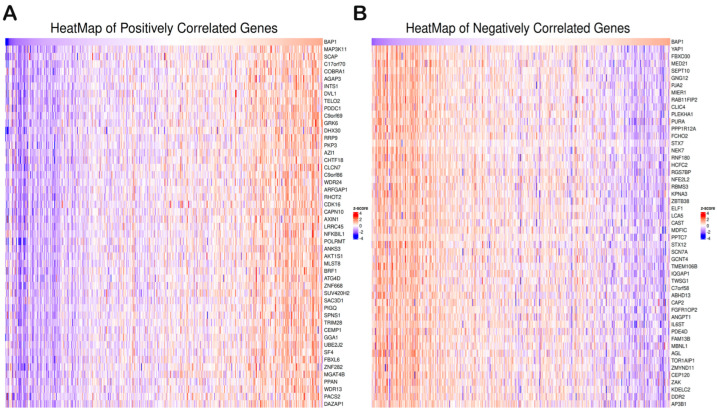 Figure 5
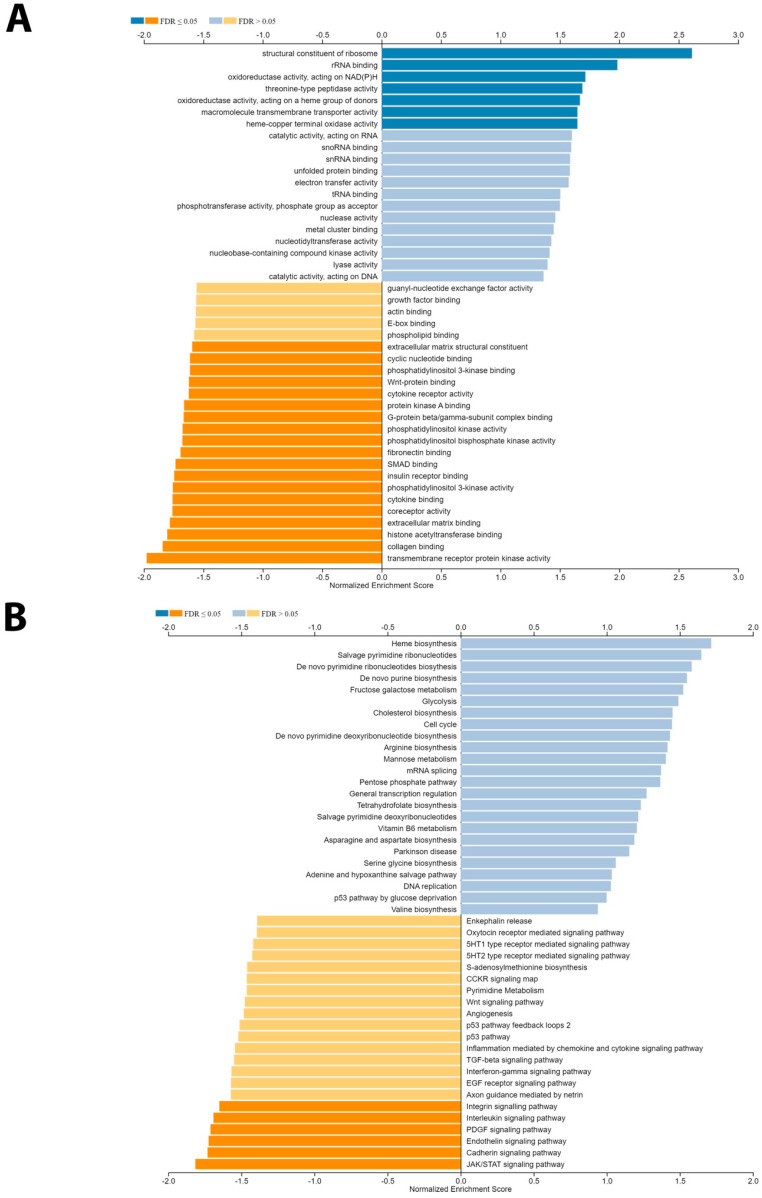 Figure 6
- —Prostate Cancer Foundation Young Investigator Award
- —Prostate Cancer Canada
- —Canadian Cancer Society
Peer Reviews
No public reviews on file for this paper yet. If you reviewed it on a platform where reviews are public (OpenReview, ICLR, NeurIPS, ICML), you can paste yours below so the community can read it here.
Videos
No videos yet. Explain this paper in a talk, walkthrough, or lecture? Add one.
Taxonomy
TopicsProstate Cancer Treatment and Research · PARP inhibition in cancer therapy · Molecular Biology Techniques and Applications
1. Introduction
Prostate cancer (PCa) remains a significant epidemiological concern and a leading cause of male mortality with millions of cases diagnosed worldwide annually [1,2]. A lack of early symptoms, timely screenings, and interventions leads to delayed detection, allowing the cancer to progress unchecked [3]. Despite advancements in health systems and treatment options in Western countries, aggressive forms of prostate cancer and lethality pose substantial challenges when diagnosed at later stages [4,5,6]. The search for key molecular players involved in its development and progression is crucial for improving diagnosis and treatment strategies are still needed [7].
Genomic alterations play a pivotal role in driving the aggressiveness and lethality of prostate cancer [8]. One of the most prevalent genomic alterations in PCa is the fusion of the ERG gene with TMPRSS2, promoting cancer development and progression [9]. Homozygous loss or the deletion of phosphatase and tensin homolog on chromosome 10 (PTEN) lead to the activation of pathways that drive tumor growth and invasion [10]. In conventional therapies like androgen deprivation therapy (ADT), resistance is often observed in the presence of amplifications or mutations in the androgen receptor (AR) [11]. Moreover, mutations in the P53 gene disrupt the regulation of cell growth and DNA repair mechanisms, fostering tumor progression [12]. These genomic alterations, either individually or in combination, contribute significantly to the aggressiveness and lethal potential of PCa and pose significant challenges in its clinical management and outcomes [13].
BRCA1-associated protein 1 (BAP1) is a tumor suppressor gene located on the short arm of chromosome 3 (3p21. 31–p21. 2) and encodes a deubiquitinase enzyme that plays a critical role in maintaining genomic stability and regulating cell cycle progression [14,15]. Germline mutations in BAP1 have been associated with an increased risk of multiple malignancies, including mesothelioma, renal cell carcinoma, and uveal and cutaneous melanoma [16].
In prostate cancer, we found contradictory data about the role of BAP1 expression in the disease’s pathogenesis and clinical outcomes. Several studies have reported that the presence of BAP1 mutations or the loss of expression in prostate cancer tissues leads to worse clinical outcomes, while the loss of BAP1 function has been shown to enhance AR activity, potentially contributing to the aggressive behavior of prostate cancer cells [17,18]. Others reported that high BAP1 expression is associated with prostate cancer development and progression [19]. Understanding the role of BAP1 in prostate cancer is not only important for unraveling the molecular mechanisms underlying the disease but also for identifying novel therapeutic targets. Targeting BAP1 or its associated signaling pathways may hold promise for developing more effective treatment strategies for prostate cancer patients.
The study aims to explore the involvement of BAP1 protein expression in prostate cancer lethality and uncover the molecular mechanisms behind its tumor suppressive effects.
2. Methods
2.1. Study Population, Tissue Microarray Construction, and Pathological Analysis
A cohort comprising 202 patients diagnosed with prostate cancer underwent transurethral resection of the prostate (TURP). Our patients were categorized into three groups. The incidental group comprised patients with no prior ADT therapy and Gleason grade group 1–3 (n = 61). Patients with a GG of more than 3 who underwent treatment post-TURP were categorized as the advanced group (n = 69). Those who received treatment before the TURP procedure and had advanced local disease with obstructive symptoms while on ADT were categorized as the castrate-resistant prostate cancer group (CRPC) (n = 72). The tissue samples were constructed into a tissue microarray (TMA). The histological diagnoses of individual cores on the TMA were verified by the study’s pathologist (TAB). BAP1 intensity expression was evaluated using a three-tiered system (1, weak; 2, moderate; 3, high intensity). Grade groups (GGs) were determined according to the 2018 WHO and ISUP grade group criteria by the study’s pathologist (TAB). Clinical data and outcomes were obtained from Alberta Cancer registries. This study was reviewed and approved by the University of Calgary Cumming School of Medicine Ethics Review Board in accordance with the 1964 Helsinki Declaration and its later amendments or comparable ethical standards (ethics Study REB Certification #HRE-BA.CC-16-0551).
2.2. Immunohistochemistry
Patients’ samples were constructed into tissue microarrays (TMAs) and 4 µm formalin-fixed paraffin-embedded (FFPE) sections were cut and mounted on glass slides, and then IHC was performed using a Dako Omnis auto-stainer (Agilent, Santa Clara, CA, USA) at the Anatomic Pathology Research Lab of Alberta Precision Research Labs (APRL) as a routine procedure. In brief, the slide was hydrated, and antigen retrieval was performed using Tris high epitope retrieval buffer (pH 9.0). Subsequently, slides were incubated with mouse monoclonal antibody Santa Cruze (sc-28383). The primary antibody was diluted at 1:100 dilution using Dako antibody diluent. Thirty-minute incubation was conducted for both primary and secondary antibody incubation. Mouse poly-linker (Agilent, USA) was applied to the sections after the primary antibody incubation. A DAB+ Substrate Chromogen system (Agilent, USA) was used as a post-incubation detection reagent. Hematoxylin was applied for counter-staining for nuclear staining. The slides were subjected to a series of ethanol dehydration and xylene treatments, followed by mounting with coverslips using Flo-TEXX mounting medium (Lerner Laboratories, Pittsburgh, PE, USA).
BAP1 was categorized into localization patterns, i.e., nuclear, cytoplasmic, and mixed localization, and further stratified based on weak/moderate and strong staining intensity.
Subsequently, PTEN, ERG, and p53 expressions were assessed using IHC. PTEN expression was characterized as either retained (normal expression) or lost (functional inactivation). ERG expression was categorized as either positive or negative, reflecting the presence or absence of ERG gene rearrangements. For p53, the IHC staining patterns were classified into wild-type expression (score 1) or aberrant expression (scores 0, 2, and 3). Furthermore, Gleason grades (GGs) were categorized into two groups: the low Gleason grade group (GS of 6–7) and the high Gleason grade group (GS of ≥8).
2.3. BAP1 Gene Expression Analysis in the Public Cancer Database
To explore the relative signature insight associated with BAP1 gene expression and look for gene expression in PanCancer data using TNMplot [20], this data set directly compares tumor and normal samples by either grouping all specimens of the same category and running a Mann–Whitney U test or—in the case of the availability of paired normal and adjacent tumors—by running a paired Wilcoxon statistical test. Differential gene expression analysis was performed using the Biolake online tool [21] (https://biolake.ucalgary.ca/ accessed on 22 December 2023). Additional signature data were sourced from the Cancer Genome Atlas Prostate Adenocarcinoma (TCGA PRAD) database. Additionally, we investigated the relationship between BAP1 expression and top genomic alterations in TCGA PRAD data such as FXA1, IDH1, and SPOP, as well as gene fusions like ERG, ETV1, and ETV4 using the University of Alabama at Birmingham CANcer data analysis Portal (UALCAN) [22]. Moreover, BAP1 expression was correlated with prostate cancer (PCa) pathological stage, lymph node involvement, the number of affected lymph nodes, and residual tumor status using the UALCAN platform [22].
To enhance the analysis, Linkedomics [23] (https://www.linkedomics.org/ online tools accessed on 22 December 2023) were utilized to perform Gene Set Enrichment Analysis (GSEA), including the Gleason score and various pathological features associated with BAP1 expression.
2.4. Statistical Analysis
In this study, we employed various statistical methods to analyze the data. Descriptive statistics were utilized to summarize the characteristics of the dataset. For categorical data, we reported the frequency and proportions to provide an overview of the distribution. Meanwhile, for continuous data, we calculated and presented the mean and standard deviations, which offer insights into the central tendency and variability within the dataset.
To assess the significance of mean differences between two continuous measures, independent t-tests were used. Normality assumptions were tested, and parametric tests were conducted as per the central limit theorem. Welch’s t-test was used to determine the significant differences in expression levels between normal and primary tumors or tumor subgroups based on clinicopathological features. The fold changes between normal and tumor data were conducted using the Mann–Whitney test.
In the context of survival analysis, overall survival (OS) was defined as the duration from the time of diagnosis to the occurrence of death. Patients alive at the last date of follow-up were censored. Cause-specific survival (CSS) is a net survival measure representing cancer survival in the absence of other causes of death. For CSS, the event was considered if the patient died due to prostate cancer; all other patients were censored at the last date of follow-up or if they died due to other causes. Kaplan–Meier estimates and the corresponding 95% confidence intervals were reported for OS and CSS. Log-rank tests were used to compare the survival curves. Unadjusted and adjusted Cox regression analyses were conducted for OS and CSS outcomes. For the multivariable Cox’s regression model for OS and CSS, we adjusted for the Gleason score as one of the known confounding factors. The Gleason score was forced into the model irrespective of its statistical significance. BAP1 was considered as a single variable, and the combined effect of BAP1 with PTEN and ERG was analyzed. All these models were adjusted for the Gleason score. The hazard ratio (HR) and the corresponding 95% confidence intervals were reported. A p-value less than 0.05 was considered statistically significant. We applied two-sided t-tests to examine relationships and differences within the data. SPSS version 29 (IBM Corp. Released 2022. IBM SPSS Statistics for Windows, Version 29.0. Armonk, NY, USA: IBM Corp) was used to conduct all statistical analyses.
3. Results
3.1. Low BAP1 Expression Correlates with Poor Overall Survival (OS) and Cancer-Specific Survival (CSS)
We investigated of total of 202 PCa cases for BAP1 expression (Figure 1A,B).
In cases with a nuclear BAP1 pattern, a statistically significant correlation (p = 0.042) was observed between BAP1 intensity and PTEN expression. Strong BAP1 staining was associated with a higher incidence of PTEN loss (60%), whereas PTEN retention was more prevalent in the weak/moderate BAP1 staining group (62%). Similarly, the ERG variable demonstrated a significant difference (p = 0.030), with ERG positivity being more prevalent in cases with strong nuclear BAP1 staining (56%) compared to those with weak/moderate staining (33%). In contrast, p53 expression did not show a statistically significant correlation (p = 0.520) with either pattern of expression or intensity groups. Finally, Gleason grade exhibited a significant association (p = 0.012), with higher-grade Gleason groups more frequently displaying strong nuclear BAP1 staining (90.9%).
In the analysis of cytoplasmic and mixed BAP1 staining, we found no statistically significant relationships with PTEN, ERG, p53 expression, or Gleason grade across the different intensity groups. For cytoplasmic BAP1, PTEN loss was more frequent in the weak/moderate intensity group (64.3%) but was not observed in the strong intensity group (p = 0.082). Similarly, there were no notable differences in ERG positivity and Gleason grade distributions (p = 0.537 and p = 0.528, respectively).
Mixed BAP1 staining also showed no significant correlations, with PTEN loss seen in 41.2% of cases with strong intensity but completely absent in the weak/moderate group (p = 0.159). ERG positivity and Gleason grade were also not significantly different (p = 0.548 and p = 0.283), respectively.
In summary, nuclear BAP1 staining showed clear associations with PTEN loss, ERG positivity, and higher Gleason grades. However, no significant correlations were found for p53 expression or for cytoplasmic and mixed BAP1 staining. These findings underscore the importance of nuclear BAP1 staining in the characterization of prostate cancer.
For the remainder of the analysis, we focused on nuclear BAP1 expression since the initial data pointed to no significance for cytoplasmic expression.
Our results revealed that low BAP1 expression was significantly different between the three groups (p = 0.004) (Table 1). The mean intensity in the incidental group (n = 61) was 2.46 ± 0.535, advanced (n = 69) was 2.12 ± 0.676, and castrate-resistant (n = 72) was 2.17 ± 0.628. Interestingly, we found patients with high BAP1 expression (Figure 1C) who showed better survival outcomes in PCa (alive), but this was not statistically significant when comparing deceased and alive patient status with BAP1 expression categorized as low/high. Remarkably, 74.1% of low BAP1 expression cases exhibited advanced disease or were characterized as castration-resistant.
According to our outcome data and survival curves, BAP1 expression was categorized by scores into low risk (score 2, 3) and high risk (score 1) (Figure 1D,E). In the present cohort, reduced BAP1 intensity exhibited a significant association with unfavorable OS (HR 2.31, CI: 1.38–3.86, p = 0.001) and CSS (HR 2.44, CI: 1.24–4.78, p = 0.01) (Table 2).
3.2. Low Nuclear BAP1 Expression Combined with Either ERG Expression, PTEN Loss, P53, or AR Mutant Associated with Poor OS and CSS
Given the well-established associations of genomic alterations with the prognosis of prostate cancer patients, our objective was to explore the prognostic significance of BAP1 alone and in combination with common PCa genomic alterations such as PTEN, ERG, P53, and AR (Figure 2). Based on our results, the combination of low BAP1 expression and positive ERG expression (score 1) (Figure 2A) showed the most unfavorable OS (HR 3.79, CI: 1.62–6.82; p = 0.002) and CSS (HR: 4.72, CI: 1.65–13.52; p = 0.004) (Table 2).
Similarly, the combination of low BAP1 expression (score 1) and PTEN loss (score 0) was found to be associated with poor OS (HR: 2.83, CI: 1.35–5.91; p = 0.006) and CSS (HR: 4.30, CI: 1.64–11.28; p = 0.003). Figure 2B. Furthermore, using a multivariate analysis that adjusts for Gleason score, the combination of PTEN loss and low BAP1 expression was found to be significantly associated with inferior OS (HR: 2.34, CI: 1.07–5.12; p = 0.033) and CSS (HR 2.99, CI: 1.06–8.43, p = 0.038). Interestingly, improved prognosis and the highest survival rate were observed with high BAP1 expression (moderate and high) combined with no ERG expression or PTEN (moderate or high expression), P53 (score 0, 2), and AR (score 1, 2) (Figure 2).
3.3. PanCancer Data Analysis Revealed BAP1 Expression in Different Cancers
Exploring the PanCancer data, we found that BAP1 gene expression was inconsistently expressed in 22 cancers (Figure 3A). Significant low expression was observed in adrenal, breast, esophagus, lung, ovary, prostate, renal, stomach, testicular, and thyroid cancers. However, a few tumors showed upregulation, such as acute myelogenous leukemia (AML), liver, pancreas, and renal cell carcinoma. Interestingly, this database shows that the BAP1 gene is significantly downregulated in cancer compared to non-adjacent normal tissues (Figure 3B).
3.4. BAP1 Gene Expression in TCGA PRAD
The gene expression analysis from TCGA PRAD data shows different trends compared to our patient cohort. The TCGA PRAD dataset analysis of BAP1 gene expression revealed an increase in BAP1 expression in the tumor samples when compared to adjacent or paired normal tissues (Figure 4A), moreover, the BAP1 gene upregulation was significantly correlated with increased Gleason score (Figure 4B) and common genomic aberrations such ERG fusion, ETV1 fusion, ETV4 fusion, FL1 fusion, FOXA1 mutation, IDH1 mutation, and SPOP mutation (Figure 4C). Furthermore, a similar trend was observed with TP53 mutant status compared to non-mutant or wildtype TP53 (Figure 4D). Also, a constant increase in BAP1 gene expression was observed with nodal metastasis N0 and N1 (Figure 4E).
3.5. Gene Set Enrichment Analysis of BAP1 Gene Revealed Potential Role in PCa
Differential gene expression analysis was performed (Figure 4F) for BAP1 using the TCGA PRAD dataset. Differential gene expression analysis revealed potential tumorigenesis-associated candidates as presented in the top BAP1 gene expressions shown with a heatmap in Figure 5A,B. Furthermore, the gene set enrichment analysis was further performed to identify the molecular function as shown in Figure 6A,B. Our data revealed that BAP1 gene expression is negatively correlated with many potential pathways involved in tumor progression, such as the WNT pathway, angiogenesis, P53 pathway, and TGF beta signaling.
4. Discussion
Our findings document that BAP1 nuclear expression in PCa has significant prognostic value. Other patterns of expression (cytoplasmic and mixed) show no correlation with clinical outcome or biomarker associations. Our cohort showed that weak BAP1 nuclear expression is associated with poorer prognosis, higher Gleason scores, and advanced tumor stages. This suggests the potential for BAP1 as an adverse prognostic factor. In contrast, strong BAP1 expressions indicate a favorable clinical outcome.
Previous studies show that ERG gain, TMPRSS2 fusion, and PTEN loss are associated with poor clinical outcomes in PCa patients [23,24]. Our data also show that weak BAP1 nuclear expression, alone and when combined with ERG rearrangement or PTEN loss, correlates with poor clinical outcomes.
BAP1 functions as a deubiquitinating enzyme, stabilizing target proteins and preventing their degradation. This mechanism is crucial in maintaining the tumor suppressive function of proteins like PTEN. BAP1 regulates PTEN stability by removing ubiquitin, preventing its degradation, and thereby inhibiting the PI3K/AKT signaling pathway. When BAP1 expression is lost or reduced, PTEN becomes increasingly ubiquitinated and degraded, leading to unchecked cell proliferation and tumor progression by PI3K/AKT pathway activation.
BAP1 interacts indirectly with ERG, a key oncogene in prostate cancer. ERG overexpression, often driven by the TMPRSS2-ERG gene fusion, is exacerbated by low BAP1. BAP1 normally counteracts the activity of Polycomb Repressive Complex 1 (PRC1) by deubiquitinating histone H2A at lysine 119 (H2AK119ub), a marker of gene silencing. Low BAP1 leads to the accumulation of H2A ubiquitination, reinforcing the PRC1-mediated repression of tumor suppressor genes, thus creating a permissive environment for ERG overexpression and tumor progression.
Our study suggests that BAP1 is independently associated with adverse PCa outcomes, indicating a broader influence on gene expression, cell cycle regulation, and epigenetic changes. Low BAP1 expression promotes genomic instability by failing to regulate DNA repair pathways or by altering the expression of other tumor suppressor genes, contributing to an aggressive cancer phenotype. Additionally, it may create a permissive epigenetic environment that fosters the activation of additional oncogenic signaling pathways, driving tumor progression. BAP1’s ability to maintain genomic integrity and regulate protein stability strongly supports its role as a tumor suppressor and highlights its important role in PCa biology.
Additionally, our data also show BAP1 as a risk factor regardless of p53 and AR mutation status. However, a favorable outcome was observed with combined BAP1 and low-risk p53 or AR status.
Several studies that highlight the significance of BAP1 expression in prostate cancer [25,26] show conflicting findings. While most authors believe that BAP1 acts as a tumor suppressor gene, others consider it as an oncogene [14,27,28,29]. Recent findings show that BAP1 suppresses prostate cancer progression by deubiquitinating and stabilizing PTEN, inhibiting the PI3K-AKT-mTOR pathway and suppressing trophoblastic EMT [14]. Our data support this view regarding BAP1 as a tumor suppressor.
Genomic alterations, such as ERG rearrangements, PTEN loss, p53 mutations, and AR aberrations, have a significant impact on the prognosis of PCa. ERG rearrangements often signal more aggressive disease behavior, while PTEN loss correlates with heightened tumor aggressiveness and resistance to therapies [30]. TP53 mutations lead to higher-grade tumors and increased genomic instability, contributing to disease progression and poorer outcomes [31]. Concurrently, androgen receptor mutations or amplifications are linked to treatment resistance and the development of castration-resistant prostate cancer (CRPC), intensifying disease severity [11,32]. Our data did not all point in this direction, reflecting sample size issues. This suggests that such models may have clinical applicability in some clinical scenarios but likely need to be confirmed in subsequent studies, as more combinations or expansions of the sample data may help create a more comprehensive tissue-based prognostic model.
A previous study reported findings that contradict our data [17]. Considering the substantial difference in sample size and the biological significance of our findings, it is important to highlight that our analysis was conducted on a different cohort in terms of the demographics and outcomes assessed. In the cohort referenced, patients were treated surgically (radical prostatectomy) with biochemical recurrence as the assessed outcome. Conversely, our cohort is composed of non-surgically treated patients with assessed outcomes related to OS and CCS.
It is well known, for example, that ERG is not prognostic in most surgical cohorts, but has significant prognostic value in non-surgical and hormonally treated cohorts [33,34]. We believe this distinction is crucial, as it may account for some of the differences observed between our study and the earlier publication referenced.
The TCGA PRAD data show higher BAP1 mRNA levels in PCa samples (combined), which is inconsistent with our results. However, PanCancer supports our finding of lower BAP1 expression in benign versus cancer tissues and tissue-based expression data of weak BAP1 expression linked with worse clinical outcomes. This adds more value to our tissue-based signatures. The difference may be related to TCGA assessing mRNA versus protein expression, as in this study. Additionally, numerous factors may contribute to the discrepancy between mRNA abundance and actual protein expression. Post-transcriptional modifications, including RNA processing and stability, influence the fidelity of mRNA representation [35].
5. Conclusions
Our data suggests that integrating BAP1 with PTEN deletion and ERG rearrangements significantly enhances the accuracy of prognostic models. However, adding more genomic factors may allow better risk stratification and prediction of disease progression in prostate cancer patients.
The reference list from the paper itself. Each links out to its DOI / PubMed record.
- 1Berenguer C.V. Pereira F. Camara J.S. Pereira J.A.M. Underlying Features of Prostate Cancer-Statistics, Risk Factors, and Emerging Methods for Its Diagnosis Curr. Oncol.2023302300232110.3390/curroncol 3002017836826139 PMC 9955741 · doi ↗ · pubmed ↗
- 2Siegel R.L. Miller K.D. Wagle N.S. Jemal A. Cancer statistics, 2023 Ca Cancer J. Clin.202373174810.3322/caac.2176336633525 · doi ↗ · pubmed ↗
- 3Wei J.T. Barocas D. Carlsson S. Coakley F. Eggener S. Etzioni R. Fine S.W. Han M. Kim S.K. Kirkby E. Early detection of prostate cancer: AUA/SUO guideline part I: Prostate cancer screening J. Urol.2023210465310.1097/JU.000000000000349137096582 PMC 11060750 · doi ↗ · pubmed ↗
- 4Sekhoacha M. Riet K. Motloung P. Gumenku L. Adegoke A. Mashele S. Prostate cancer review: Genetics, diagnosis, treatment options, and alternative approaches Molecules 202227573010.3390/molecules 2717573036080493 PMC 9457814 · doi ↗ · pubmed ↗
- 5Diamantopoulos M.A. Georgoulia K.K. Levis P. Kotronopoulos G. Stravodimos K. Kontos C.K. Avgeris M. Scorilas A. 28S r RNA-Derived Fragments Represent an Independent Molecular Predictor of Short-Term Relapse in Prostate Cancer Int. J. Mol. Sci.20232523910.3390/ijms 2501023938203408 PMC 10779029 · doi ↗ · pubmed ↗
- 6Bolzati C. Gobbi C. Ferro-Flores G. Turato S. Ocampo-Garcia B. Carpanese D. Marzano C. Spolaore B. Fracasso G. Rosato A. Development and Characterization of 99m Tc-sc Fv D 2B as a Potential Radiopharmaceutical for SPECT Imaging of Prostate Cancer Int. J. Mol. Sci.20232549210.3390/ijms 2501049238203663 PMC 10779128 · doi ↗ · pubmed ↗
- 7Leslie S.W. Soon-Sutton T.L. Skelton W.P. Prostate Cancer Stat Pearls Stat Pearls Publishing Treasure Island, FL, USA 2023
- 8Valle L.F. Nickols N.G. Hausler R. Alba P.R. Anglin-Foote T. Perez C. Yamoah K. Rose B.S. Kelley M.J. Du Vall S.L. Actionable Genomic Alterations in Prostate Cancer Among Black and White United States Veterans Oncologist 202328 e 473e 47710.1093/oncolo/oyad 04237084789 PMC 10243786 · doi ↗ · pubmed ↗