Gout Versus Pseudogout in the Medically Underserved Rio Grande Valley
Blake C Martin, Fernando Cisneros, Kristina Vatcheva, Michael D Sander

TL;DR
This study explores demographic differences in gout and pseudogout among patients in the Rio Grande Valley, finding significant disparities by age, sex, and ethnicity.
Contribution
The study identifies specific demographic risk factors for gout and pseudogout in a medically underserved population.
Findings
Older age groups (40-65 and ≥65 years) had significantly higher odds of gout compared to younger patients.
Women had significantly lower odds of gout compared to men and compared to pseudogout.
Hispanic or Latino individuals had lower odds of both gout and pseudogout compared to non-Hispanic individuals.
Abstract
Background Gout and pseudogout are inflammatory joint conditions, with gout being one of the most prevalent etiologies of chronic inflammatory arthritis in the United States. The patient population in the Rio Grande Valley (RGV) has a distinct demographic profile that warrants the exploration of various health conditions. The primary objective of this study was to expand the knowledge of orthopedics and determine if there were demographic disparities between gout and pseudogout in this community. We hypothesized that there would be demographic disparities between gout and pseudogout depending on age, sex, and ethnicity. Methods This was a retrospective chart review, and data was gathered from the University of Texas Rio Grande Valley (UTRGV) UTHealth electronic database from January 1, 2017, to January 1, 2024. We collected and analyzed medical charts of individuals who were…
Genes, proteins, chemicals, diseases, species, mutations and cell lines named across the full text — each resolved to its canonical identifier and authoritative record.
Click any figure to enlarge with its caption.
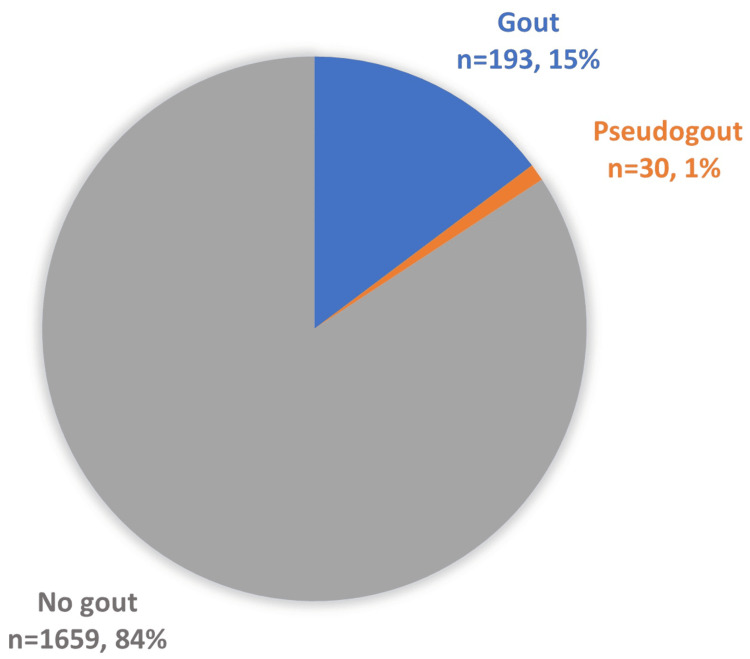 Figure 1
| Characteristic | All | Gout | Pseudogout | No gout |
| n (%) | n (%) | n (%) | n (%) | |
| Age group (years), n=4413 | ||||
| <40 | 1369 (31.02) | 49 (7.53) | 0 (0) | 1320 (35.51) |
| 40-65 | 1778 (40.29) | 283 (43.47) | 7 (15.56) | 1488 (40.03) |
| ≥65 | 1266 (28.69) | 319 (49) | 38 (84.44) | 909 (24.46) |
| Sex, n=4413 | ||||
| Female | 2509 (56.85) | 131 (20.12) | 26 (57.78) | 2352 (63.28) |
| Male | 1904 (43.15) | 520 (79.88) | 19 (42.22) | 1365 (36.72) |
| Race/ethnicity, n=3920 | ||||
| Hispanic or Latino | 3356 (85.61) | 351 (72.37) | 31 (73.81) | 2974 (87.65) |
| Non-Hispanic or non-Latino | 564 (14.39) | 134 (27.63) | 11 (26.19) | 419 (12.35) |
| Marital status, n=3495 | ||||
| Married/partner | 1808 (51.73) | 311 (70.36) | 25 (71.43) | 1472 (48.77) |
| Single/divorced/widow | 1687 (48.27) | 131 (29.64) | 10 (28.57) | 1546 (51.23) |
| BMI groups, n=2278 | ||||
| Normal | 450 (19.75) | 17 (6.72) | 4 (10.53) | 429 (21.59) |
| Overweight | 608 (26.69) | 65 (25.69) | 16 (42.11) | 527 (26.52) |
| Obese | 1220 (53.56) | 171 (67.59) | 18 (47.37) | 1031 (51.89) |
| Characteristic | All (n=1882) | Gout (n=193) | Pseudogout (n=30) | No gout (n=1659) |
| n (%) | n (%) | n (%) | n (%) | |
| Age group (years) | ||||
| <40 | 545 (28.96) | 17 (8.81) | 0 (0) | 528 (31.83) |
| 40-65 | 881 (46.81) | 101 (52.33) | 5 (16.67) | 775 (46.71) |
| ≥65 | 456 (24.23) | 75 (38.86) | 25 (83.33) | 356 (21.46) |
| Sex | ||||
| Female | 1153 (61.26) | 36 (18.65) | 17 (56.67) | 1100 (66.31) |
| Male | 729 (38.74) | 157 (81.35) | 13 (43.33) | 559 (33.69) |
| Race/ethnicity | ||||
| Hispanic or Latino | 1591 (84.54) | 131 (67.88) | 20 (66.67) | 1440 (86.8) |
| Non-Hispanic or non-Latino | 291 (15.46) | 62 (32.12) | 10 (33.33) | 219 (13.2) |
| Marital status | ||||
| Married/partner | 1080 (57.39) | 146 (75.65) | 22 (73.33) | 912 (54.97) |
| Single/divorced/widow | 802 (42.61) | 47 (24.35) | 8 (26.67) | 747 (45.03) |
| BMI groups | ||||
| Normal | 381 (20.24) | 10 (5.18) | 3 (10) | 368 (22.18) |
| Overweight | 512 (27.21) | 51 (26.42) | 11 (36.67) | 450 (27.12) |
| Obese | 989 (52.55) | 132 (68.39) | 16 (53.33) | 841 (50.69) |
| Characteristic | Gout versus no gout | Pseudogout versus no gout | Gout versus pseudogout | ||||||
| OR (95% CI) | Wald chi-square value | P-value | OR (95% CI) | Wald chi-square value | P-value | OR (95% CI) | Wald chi-square value | P-value | |
| Age group (years) | |||||||||
| <40 | Reference | ||||||||
| 40-65 | 4.05 (2.39, 6.85) | 27.18 | <0.0001 | N/A | 0.003 | 0.9581 | N/A | 0.002 | 0.9629 |
| ≥65 | 6.54 (3.80, 11.27) | 45.91 | <0.0001 | N/A | 0.004 | 0.9499 | N/A | 0.003 | 0.9564 |
| Sex | |||||||||
| Female | 0.12 (0.08, 0.17) | 125.42 | <0.0001 | 0.66 (0.32, 1.37) | 1.21 | 0.2657 | 0.17 (0.08, 0.39) | 17.84 | <0.0001 |
| Male | Reference | Reference | Reference | ||||||
| Race/ethnicity | |||||||||
| Hispanic or Latino | 0.32 (0.23, 0.45) | 44.42 | <0.0001 | 0.30 (0.14, 0.65) | 9.13 | 0.0024 | 1.07 (0.47, 2.41) | 0.02 | 0.8803 |
| Non-Hispanic or non-Latino | Reference | Reference | Reference | ||||||
| Marital status | |||||||||
| Married/partner | 2.54 (1.81, 3.58) | 28.54 | <0.0001 | 2.25 (0.99, 5.09) | 3.81 | 0.0508 | 1.13 (0.47, 2.71) | 0.07 | 0.7845 |
| Single/divorced/widow | Reference | Reference | Reference | ||||||
| BMI groups | |||||||||
| Normal | Reference | Reference | Reference | ||||||
| Overweight | 4.17 (2.09, 8.33) | 16.37 | <0.0001 | 3.00 (0.83, 1.83) | 2.81 | 0.0937 | 1.39 (0.33, 5.90) | 0.2 | 0.6546 |
| Obese | 5.78 (3.00, 11.11) | 25.59 | <0.0001 | 2.31 (0.67, 7.97) | 1.8 | 0.1856 | 2.49 (0.62, 10.02) | 1.63 | 0.1978 |
| Characteristic | Gout versus no gout | Pseudogout versus no gout | Gout versus pseudogout | ||||||
| OR (95% CI) | Wald chi-square value | P-value | OR (95% CI) | Wald chi-square value | P-value | OR (95% CI) | Wald chi-square value | P-value | |
| Age group (years) | |||||||||
| <40 | Reference | Reference | Reference | ||||||
| 40-65 | 4.06 (2.24, 7.35) | 21.35 | <0.0001 | N/A | 0.003 | 0.9506 | N/A | 0.002 | 0.9637 |
| ≥65 | 4.80 (2.55, 9.04) | 23.55 | <0.0001 | N/A | 0.004 | 0.9588 | N/A | 0.003 | 0.956 |
| Sex | |||||||||
| Female | 0.10 (0.07, 0.4) | 135.36 | <0.0001 | 0.65 (0.30, 1.42) | 1.16 | 0.2807 | 0.18 (0.08, 0.39) | 19.44 | <0.0001 |
| Male | Reference | Reference | Reference | ||||||
| Race/ethnicity | |||||||||
| Hispanic or Latino | 0.52 (0.34, 0.78) | 9.83 | 0.0017 | 0.86 (0.38, 1.94) | 0.14 | 0.7099 | 0.61 (0.25, 1.46) | 1.25 | 0.2635 |
| Non-Hispanic or non-Latino | Reference | Reference | Reference | ||||||
| Marital status | |||||||||
| Married/partner | 1.18 (0.79, 1.76) | 0.63 | 0.4282 | 1.23 (0.53, 2.88) | 0.23 | 0.6301 | 0.96 (0.38, 2.39) | 0.01 | 0.9231 |
| Single/divorced/widow | Reference | Reference | Reference | ||||||
| BMI groups | |||||||||
| Normal | Reference | Reference | Reference | ||||||
| Overweight | 3.28 (1.58, 6.79) | 10.23 | 0.0014 | 2.12 (0.57, 7.82) | 1.26 | 0.2617 | 1.55 (0.36, 6.71) | 0.34 | 0.5572 |
| Obese | 5.46 (2.73, 10.92) | 23.11 | <0.0001 | 2.24 (0.63, 7.95) | 1.56 | 0.2124 | 2.44 (0.59, 10.04) | 1.53 | 0.2164 |
Peer Reviews
No public reviews on file for this paper yet. If you reviewed it on a platform where reviews are public (OpenReview, ICLR, NeurIPS, ICML), you can paste yours below so the community can read it here.
Videos
No videos yet. Explain this paper in a talk, walkthrough, or lecture? Add one.
Taxonomy
TopicsGout, Hyperuricemia, Uric Acid · Alcohol Consumption and Health Effects · Streptococcal Infections and Treatments
Introduction
Gout
Gout is one of the most prevalent etiologies of chronic inflammatory arthritis in the United States and is characterized by the deposition of monosodium urate monohydrate crystals, the end product of human purine metabolism, in joints and tissues [1]. Although it predominantly affects the first metatarsophalangeal joint, it may occur in various other joints [1]. This condition may manifest in various ways, such as an acute gout flare, chronic gouty arthropathy, the accumulation of urate crystals in the form of tophaceous deposits, uric acid nephrolithiasis, or chronic nephropathy [1]. Generally, gout is multifactorial with genetics, medical comorbidities, and dietary factors playing an important role [1]. Hyperuricemia is arguably the most important risk factor, although a protein-rich diet, obesity, older age, male sex, alcohol consumption, comorbid diseases, certain medications, and genetic predisposition may also contribute to the development of gout [1,2]. However, although rare, a single genetic defect may be solely responsible for causing gout [1]. Generally, the prevalence of gout is 1%-4%; however, the prevalence of gout varies by age, sex, and country of origin [1]. In general, men are affected greater than women [1,3,4]. In Western nations such as the United States, the prevalence is significantly higher in men (3%-6%) compared to women (1%-2%), showing a possible sixfold difference between sexes [1]. African-American individuals have an increased prevalence compared to White individuals in the United States [1]. Increased age is also associated with an increase in prevalence, although plateauing after 70 years of age [1]. Regarding incidence rates, gout has displayed an increase over the past several decades, with a greater increase observed in men than in women and rising with age [1].
Pseudogout
Pseudogout, formally called calcium pyrophosphate deposition disease, is similar to gout in that it is characterized by the deposition of crystals in joints involving the synovial and periarticular tissues [5]. However, the crystals in pseudogout are made of calcium pyrophosphate dihydrate and typically affect larger weight-bearing joints such as the knee [5]. It can present as an acute flare or chronically with a waxing and waning clinical course that may last for several months [5]. Many individuals with pseudogout present with an underlying joint disease or metabolic abnormalities predisposing to calcium pyrophosphate dihydrate deposition [5]. The current literature shows that hyperparathyroidism has the highest positive association with pseudogout, followed by gout, osteoarthritis, rheumatoid arthritis, and hemochromatosis [5,6]. Osteoporosis, hypomagnesemia, chronic kidney disease, and calcium supplementation are other comorbidities that have also been associated with pseudogout [5]. This condition most commonly affects individuals over the age of 65 with 30%-50% of said individuals being over the age of 85 years [5,6]. It is rare for this condition to present in an individual under the age of 60 [2]. One cross-sectional study of US veterans reported a point prevalence of 5.2 per 1000, with an average age of 68 years and 95% male prevalence [5,7]. Another large cross-sectional study reported a 4% crude prevalence of pseudogout in the general population [5,7].
Study significance and aim
The patient population in the Rio Grande Valley (RGV) has a distinct demographic profile that warrants the exploration of various health conditions. This population has an increased prevalence of chronic conditions, such as obesity and diabetes [8]. Along with these chronic conditions, the community is medically underserved and impoverished and hosts a large population of undocumented individuals [9,10]. The Latino construct of machismo is another factor that may contribute to the health of this region as it may prevent Hispanic men from seeking medical help due to it being perceived as feminine [11]. To our knowledge, there is no study that has compared these two similar conditions in this unique population. The primary objective of this study was to expand the knowledge of orthopedics and determine if there were demographic disparities between gout and pseudogout in this community. We hypothesized that there would be demographic disparities between gout and pseudogout depending on age, sex, and ethnicity.
Materials and methods
Study design and data collection
This was a retrospective chart review, and institutional review board (IRB) approval was obtained prior to starting this study. Data was gathered from the University of Texas Rio Grande Valley (UTRGV) UTHealth electronic database. Data collection included medical charts from January 1, 2017, to January 1, 2024. We collected and analyzed medical charts of individuals who were diagnosed with gout or pseudogout. These conditions were obtained by using the International Classification of Diseases version 10 (ICD-10) diagnosis codes M10 for gout and M11.2 for pseudogout. For each individual, various demographics were collected, including BMI, sex, age at diagnosis, race/ethnicity, and marital status.
Inclusion and exclusion criteria
Individuals over the age of 85 were included as a group indicated as “>85” years of age. Individuals who were not seen by a UTRGV-associated institution were not included in the study. If there were duplications of an individual’s medical chart, such as an individual having more than one appointment, the earliest date, the date the patient was diagnosed with gout or pseudogout, was included. If a patient was diagnosed with more than one of the conditions analyzed, all disorders were included and analyzed based on the date of diagnosis and the demographics of the patient at the point in time of that specific diagnosis. Individuals with complete data (having all the analyzed patient characteristics) were included during the univariate and multivariate statistical analyses.
Data analysis
Patients’ characteristics were described by gout status using frequency (n) and percentage (%) for categorical variables. Univariable and multiple multinomial logistic regression models were used to evaluate the association between gout status and socio-demographic characteristics. Crude and adjusted odds ratios (ORs) and their respective 95% confidence intervals (CIs) were estimated. All statistical tests were two-sided and were performed at a significance level of 0.05. All statistical analyses were conducted using Statistical Analysis System (SAS) 9.4 (SAS Institute Inc., Cary, NC).
Results
Gout proportion in analyzed patients
In total, 4413 patients from UTRGV-associated institutions were used to calculate the proportions of gout and pseudogout. Around 15% (n=651) of the patients had gout, and 1% (n=45) had pseudogout (Figure 1).
Proportion of patients with gout, pseudogout, or neither (no gout).The data has been presented in raw totals and percentages.
Characteristics of the study population
From the extracted 4413 patient records (Table 1), a subset of 1882 patients (Table 2) with complete data were used in the statistical analysis. Table 1 provides the main socio-demographic patient characteristics for all the patient records. The majority of the patients in this study were between the ages 40 and 65 (n=1778, 40.29%), women (n=2509, 56.85%), and of Hispanic or Latino ethnicity (n=3356, 85.61%). Slightly, more individuals were married or had a partner (n=1808, 51.73%) compared to individuals who were single, divorced, or widowed (n=1687, 48.27%). In terms of BMI, the majority of individuals were obese (n=1220, 53.56%), followed by overweight (n=608, 26.69%), and the minority were of normal BMI (n=450, 19.75%).
Factors associated with gout
Based on univariable logistic regression analyses, patients in the age groups 40-65 years and ≥65 years compared to patients aged <40 years old had significantly higher odds of having gout versus no gout (Table 3). Women compared to men had 88% lower odds of having gout versus no gout (OR=0.12; 95% CI: 0.08, 0.17; p<0.0001), as well as 83% lower odds of having gout versus pseudogout (OR=0.17; 95% CI: 0.08, 0.39; p<0.0001) (Table 3). In our sample, Hispanic or Latino individuals compared to non-Hispanic and non-Latino individuals had significantly lower odds of gout (OR=0.32; 95% CI: 0.23, 0.45; p<0.0001) and pseudogout (OR=0.30; 95% CI: 0.14, 0.65; p<0.0001) versus no gout, respectively (Table 3). Additionally, those who were overweight and obese compared to normal-BMI patients had significantly higher odds of having gout compared to patients with no gout (Table 3). These findings remain similar in a multivariable multinomial logistic regression model including age, sex, race/ethnicity, marital status, and BMI groups (Table 4), except that marital status was no longer significantly associated with gout status, adjusting for the rest of the variables included in the model (Table 4).
Table 3: Univariable logistic regression analyses for gout status and socio-demographic characteristics.The data has been presented as odds ratios (ORs) with confidence intervals (CIs) of 95% and p-values with statistical significance being p<0.05.N/A: not available
Table 4: Multivariable multinomial logistic regression model for gout status and socio-demographic characteristics.The data has been presented as odds ratios (ORs) with confidence intervals (CIs) of 95% and p-values with statistical significance being p<0.05.N/A: not available
Discussion
Individuals aged 40-65 and greater than 65 years compared to patients aged less than 40 years old had significantly higher odds of having gout versus no gout in our study. Women compared to men had 88% lower odds of having gout compared to no gout and 83% lower odds of having gout compared to pseudogout in our study. The current literature agrees with our study as it states that increased age and men have an increased frequency of gout compared to younger individuals and women, both in the United States and globally [1,3,4]. Also of note, gout frequency is significantly higher in men compared to women in Western nations such as the United States, which also agrees with our results as men had 88% higher odds of having gout, a very significant difference [1]. In regard to pseudogout, some literature states that men are more likely than women to have pseudogout, whereas other literature states that men and women have an equal frequency of pseudogout [5,12]. However, we were unable to find any studies comparing gout to pseudogout in terms of odds of obtaining these conditions based on sex as we did in this study.
Hispanic or Latino ethnicity, compared to non-Hispanic and non-Latino ethnicity, had significantly lower odds of gout and pseudogout compared to no gout in our study, indicating a possible protective effect of Hispanic/Latino ethnicity against these conditions. In the past, gout studies have focused on White and Black adults; however, recent literature has been published reviewing various other ethnicities [13]. This literature states that although Native Hawaiian, Black, and Japanese individuals in the study had a higher risk of incident gout compared to White participants, Hispanic or Latino individuals had a lower risk [13]. This agrees with our study results, although the exact reason behind this trend is unclear. It may possibly be due to a difference between ethnicities in various lifestyle factors that are associated with gout and pseudogout, such as the consumption of red meats, alcohol, and seafood [1,2]. Regarding pseudogout, to our knowledge, there are no studies comparing differences between various ethnicities, specifically the Hispanic or Latino population to other ethnicities.
Individuals classified as overweight (OR {95% CI}: 3.28 {1.58, 6.79}) or obese (OR {95% CI}: 5.46 {2.73, 10.92}) compared to normal-BMI patients had significantly higher odds of having gout compared to patients with no gout in our study. The current literature shows that in the United States, the crude prevalence of gout is around 1%-2% among individuals with a normal BMI (18.5-24.9 kg/m^2^), 3% among overweight individuals, 4%-5% in individuals classified as class I obesity, and 5%-7% in individuals classified as class II or class III obesity [14]. This agrees with our study results as there was a progressively higher prevalence ratio of gout associated with successively higher categories of BMI [14].
Marital status was the only variable that showed a difference between univariable and multivariable analysis and was not significantly associated with gout status according to the multivariable model. To our knowledge, there have been no studies conducted on the frequency of gout in individuals of different marital statuses.
The limitations of this study are as follows. Data was collected solely from UTRGV UTHealth electronic databases, so individuals who received care at a non-UTRGV-affiliated institution were not taken into account in this study. Therefore, this study may not be generalizable to the South Texas population as a whole. Also, the majority of the patients analyzed in this study were Hispanic individuals, which indicates that our results may not be generalizable to another population whose ethnic landscape differs from our study. Lastly, the RGV is an impoverished, medically challenged area with numerous undocumented immigrants and individuals without health insurance [9,10]. This patient community is another reason that the results of this study may not be universally applied. Future studies should focus on obtaining data from a larger, more generalizable source and consider including more patient demographic factors and characteristics that could play a role in the development of gout and pseudogout to increase study validity and generalizability.
Conclusions
Individuals of various demographics in the underserved RGV community, and possibly demographically similar communities, may be at increased risk for gout or pseudogout. This warrants further research on these conditions in this region to further improve the knowledge and possibly prevent numerous effects of these conditions on an individual’s quality of life.
The reference list from the paper itself. Each links out to its DOI / PubMed record.
- 1Gout Fenando A Rednam M Gujarathi R Widrich J Treasure Island, FL Stat Pearls Publishing 2024 https://www.ncbi.nlm.nih.gov/books/NBK 546606/31536213 · pubmed ↗
- 2Risk factors for gout and prevention: a systematic review of the literature Curr Opin Rheumatol Singh JA Reddy SG Kundukulam J 1922022320112128571410.1097/BOR.0b 013e 3283438 e 13PMC 4104583 · doi ↗ · pubmed ↗
- 3The clinical spectrum of gouty arthritis in women Arch Intern Med Lally EV Ho G Jr Kaplan SR 222122251461986 https://pubmed.ncbi.nlm.nih.gov/3778053/3778053 · pubmed ↗
- 4Female gout. Clinical spectrum and uric acid metabolism Arch Intern Med Puig JG Michán AD Jiménez ML 7267321511991201245510.1001/archinte.151.4.726 · doi ↗ · pubmed ↗
- 5Calcium pyrophosphate deposition disease Zamora EA Naik R Treasure Island, FL Stat Pearls Publishing 2023 https://www.ncbi.nlm.nih.gov/books/NBK 540151/30986010 · pubmed ↗
- 6Pseudogout: an autoimmune paraneoplastic manifestation of myelodysplastic syndrome Cureus Iqbal SM Aslam HM Faizee F Qadir S Waheed S 010201810.7759/cureus.3372 PMC 626019730498647 · doi ↗ · pubmed ↗
- 7UK community prevalence of knee chondrocalcinosis: evidence that correlation with osteoarthritis is through a shared association with osteophyte Ann Rheum Dis Neame RL Carr AJ Muir K Doherty M 5135186220031275928610.1136/ard.62.6.513PMC 1754579 · doi ↗ · pubmed ↗
- 8Get out and go running: UTRGV’s South Texas Diabetes and Obesity Institute working to bring attention to diabetes 2018 https://www.utrgv.edu/newsroom/2018/11/29-get-out-and-go-running-utrgv-s-south-texas-diabetes-and-obesity-institute-working-to-bring-attention-to-diabetes.htm