Deciphering Steroidal and Aporphine Alkaloids as Antileukemic Agents by Approaches of Molecular Networking and Metabolomics
Suni Liu, Katyuce Souza Farias, Vanessa Samudio Santos Zanuncio, Geraldo Alves Damasceno Júnior, Flávio Macedo Alves, Edgar J. Paredes-Gamero, Kamylla Fernanda Souza de Souza, Lucas Roberto Pessatto, Heron Fernandes Vieira Torquato, Carlos Alexandre Carollo, Denise Brentan Silva

TL;DR
This study identifies steroidal and aporphine alkaloids from plants as potential antileukemic agents using molecular networking and metabolomics.
Contribution
The novel integration of molecular networking and metabolomics to predict bioactive steroidal and aporphine alkaloids against leukemia.
Findings
Several plant extracts inhibited leukemia cell viability by up to 70% at 100 μg/mL.
Alkaloid fractions from S. glaucophyllum and O. diospyrifolia showed EC50 values as low as 6.4 μg/mL.
Boldine demonstrated significant antileukemic activity with EC50 values in the micromolar range.
Abstract
The chemodiversity of plants is a valuable resource for drug discovery, and its combination with modern approaches can reduce the time consumption for bioactive metabolite discovery. This study aimed to evaluate the chemical constituents from 18 plant species of different families against leukemia cancer cells and the application of statistical analysis from metabolomic data and molecular networking for the prediction of bioactive metabolites. The samples, extracted by an accelerated solvent extractor using ethanol and water 7:3 (v/v), were analyzed by LC-DAD-MS and evaluated against leukemia cancer cells (Kasumi-1, KG-1, and K-562). Chemical data were aligned, analyzed by statistics, and applied to create the molecular network. Sesbania virgata, Aeschynomene denticulata, Erythroxylum angiufugum, Psidium guineense, Astronium fraxinifolium, Coccoloba ochreolata, Solanum glaucophyllum (S.…
Genes, proteins, chemicals, diseases, species, mutations and cell lines named across the full text — each resolved to its canonical identifier and authoritative record.
Click any figure to enlarge with its caption.
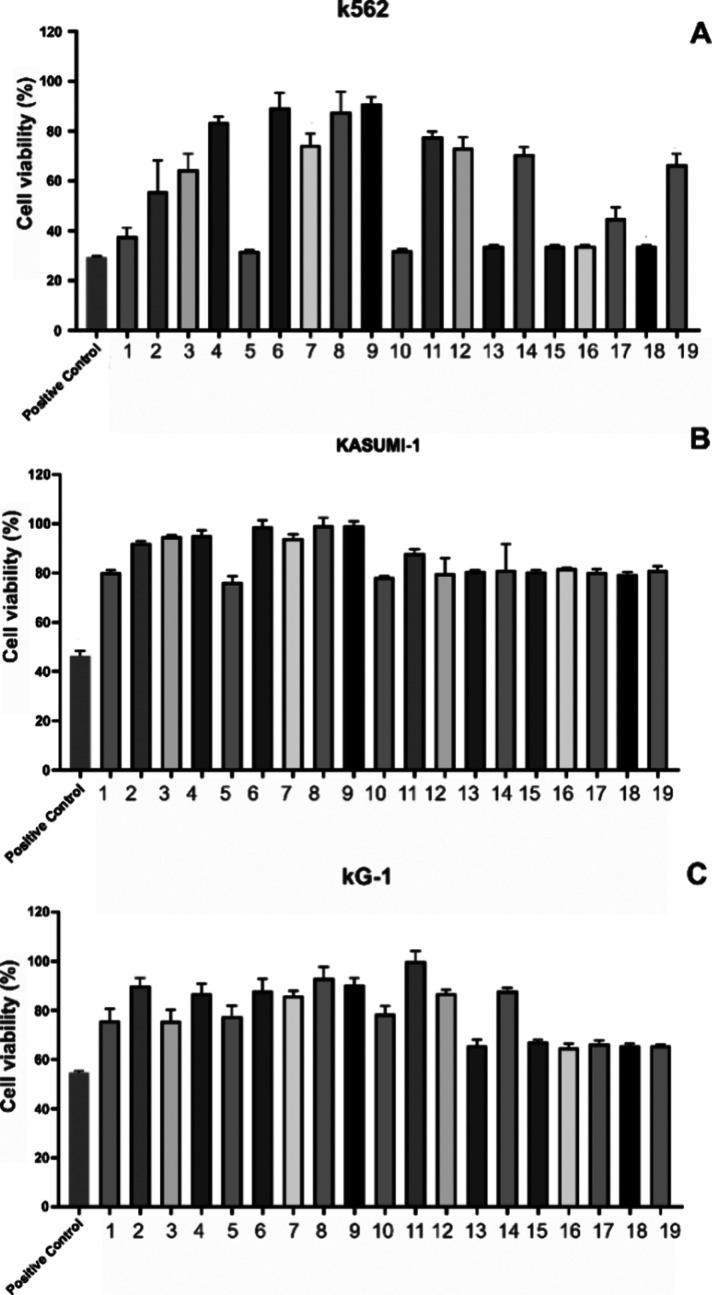 Figure 1
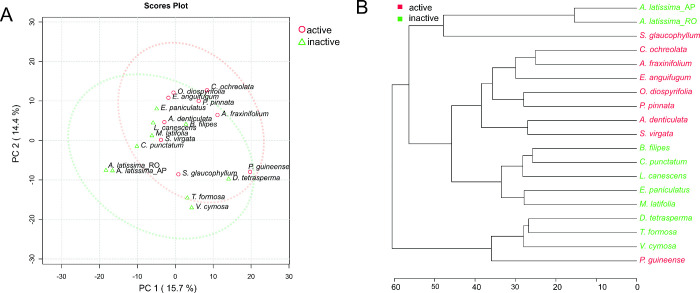 Figure 2
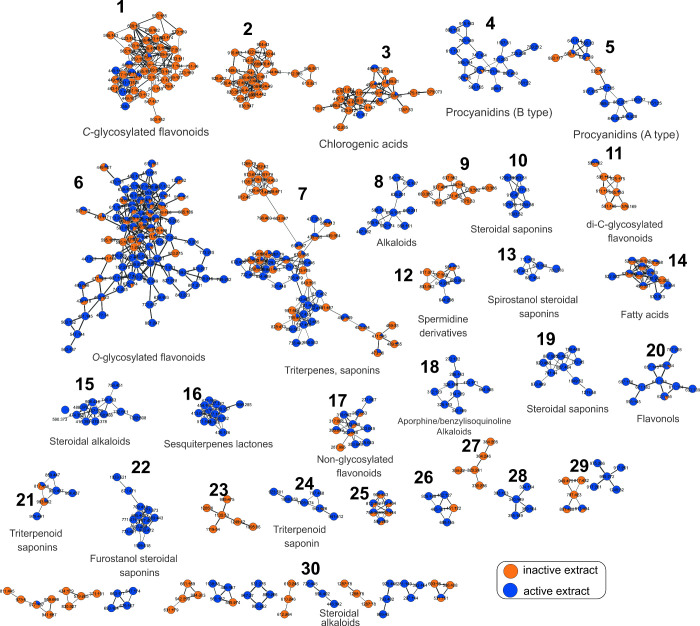 Figure 3
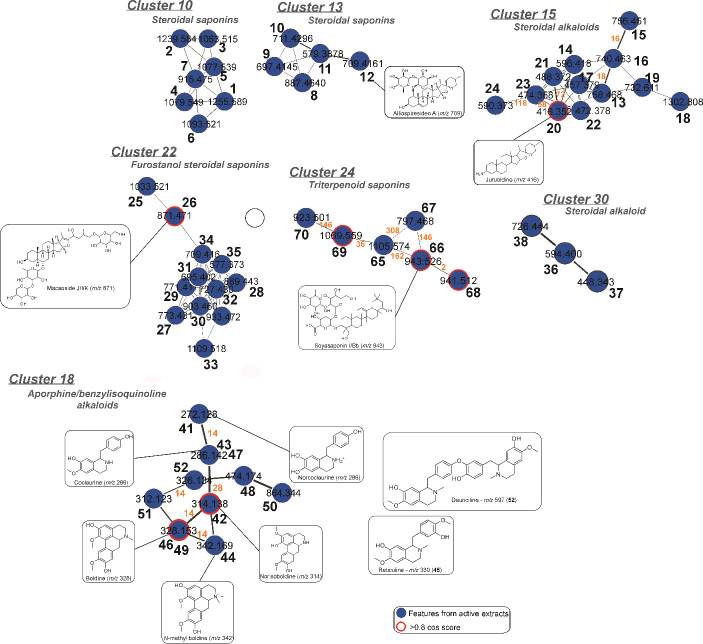 Figure 4
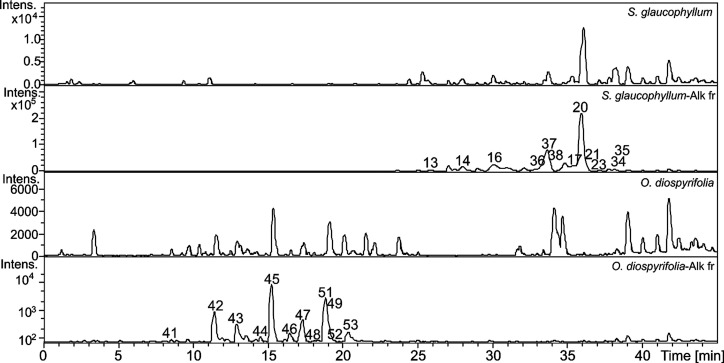 Figure 5
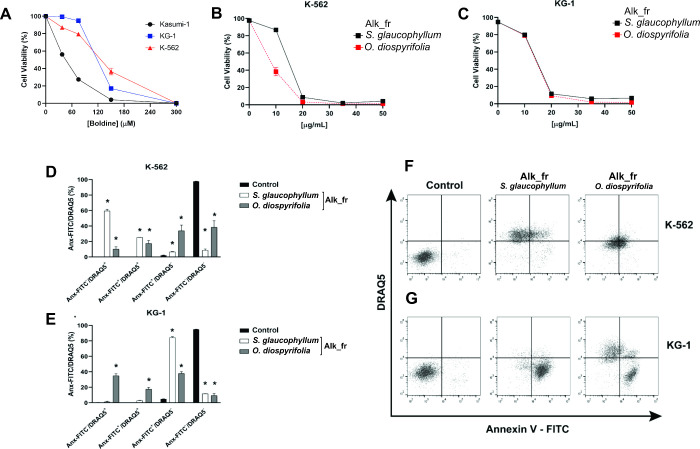 Figure 6
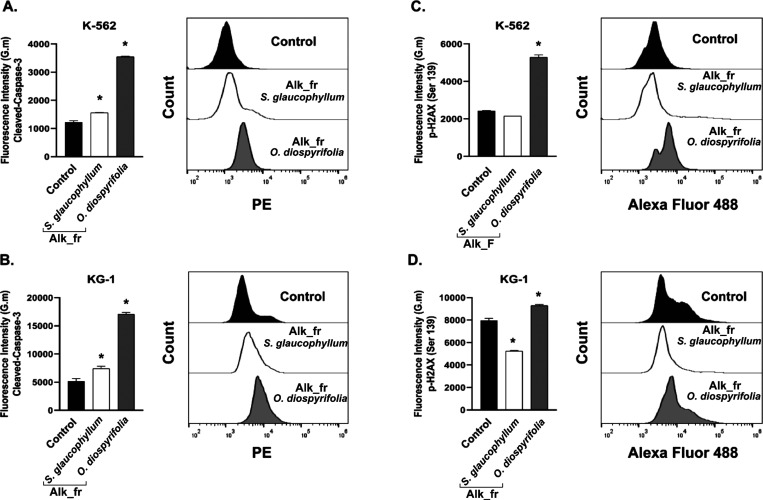 Figure 7
| Cluster 10 | |||||
| 30.6 | steroidal saponin | C54H96O33 | 1255.5788# | 1061, 609, 431, 339, 207 | |
| 31.1 | steroidal saponin | C54H96O32 | 1239.5840# | 909, 593, 431, 339, 287, 207, 175 | |
| 32.5 | steroidal saponin | C54H80O22 | 1063.5148# | 899, 727, 431, 339, 207, 175 | |
| 32.6 | steroidal saponin | C55H84O22 | 1079.5493# | 339, 289, 271, 207 | |
| 33.0 | steroidal saponin | C55H82O22 | 1077.5298# | 431, 339, 287, 207, 175 | |
| 33.4 | steroidal saponin | C55H80O22 | 1093.5212 | 871, 731, 609, 465, 431, 339, 289, 253, 207 | |
| 37.9 | steroidal saponin | C49H72O16 | 915.4749 | 577, 431, 353, 339, 287, 207, 175 | |
| Cluster 13 | |||||
| 40.6 | C44H68O18 | 887.4640 | 755, 655, 609, 591, 573, 555, 543, 465, 447, 433, 415, 397, 379, 289, 283, 271, 253 | ||
| 36.9 | di- | C37H60O12 | 697.4145 | 565, 433, 385, 289, 271, 253 | |
| 37.9 | C38H62O12 | 711.4296 | 579, 433, 415, 397, 289, 271, 253 | ||
| 38.0 | C33H54O8 | 579.3878 | 433, 289, 271, 253 | ||
| 38.2 | C38H60O12 | 709.4161 | 577, 431, 413, 395, 287, 269, 251 | ||
| Cluster 15 | |||||
| 27.7 | di- | C39H67NO13 | 758.4679 | 596, 543, 477, 416, 399, 381, 285, 255, 161 | |
| 28.0 | C33H57NO8 | 596.4177 | 576, 452, 416, 399, 381, 335, 285, 255, 231, 215, 161 | ||
| 29.8 | di- | C39H65NO13 | 756.4514 | 739, 676, 596, 524, 490, 474, 432, 416, 415, 399, 397, 379, 284, 271, 253, 229, 215, 159 | |
| 29.9 | di- | C39H65NO12 | 740.4626 | 676, 578, 416, 399, 381, 272, 255, 231, 181 | |
| 36.1 | steroidal alkaloid (unknown) | C29H48N2O2 | 457.3790 | 416, 399, 381, 353, 285, 273, 255 | |
| 37.0 | steroidal alkaloid (unknown) | C64H119NO25 | 1302.8084 | 1140, 1086, 887, 416, 339, 285, 273, 255 | |
| 38.2 | steroidal alkaloid (unknown) | C45H81NO6 | 732.6111 | 597, 543, 416, 381, 289, 285, 255, 161 | |
| 36.1 | juribidine* | C27H45NO2 | 416.3523 | 399, 381, 285, 255, 235, 215, 161 | |
| 36.5 | steroidal alkaloid (propionyl-juripidine) | C30H49NO4 | 488.3722 | 399, 381, 285, 255, 235, 215, 161 | |
| 36.6 | steroidal alkaloid (unknown) | C30H49NO3 | 472.3782 | 399, 381, 340, 312, 285, 255, 235, 215, 181, 161 | |
| 36.8 | steroidal alkaloid (acetyl-juripidine) | C29H47NO4 | 474.3577 | 441, 416, 399, 381, 298, 285, 273, 255, 231, 187, 161 | |
| 39.7 | steroidal alkaloid (unknown) | C33H51NO8 | 590.3730 | 572, 420, 399, 381, 353, 333, 285, 280, 255, 245, 235, 217, 181, 169, 161 | |
| Cluster 22 | |||||
| 34.8 | di- | C50H82O23 | 1033.5208# | 709, 565, 431, 287, 269 | |
| 31.0 | C44H72O18 | 871.4709# | 739, 709, 577, 541, 431, 413, 395, 287, 269, 251 | ||
| 33.5 | di- | C39H64O15 | 773.4315 | 449, 431, 413, 395, 317, 287, 269, 251, 163 | |
| 35.2 | furostanol saponin (unknown) | C43H68O19 | 889.4430 | 853, 797, 431, 413, 395 | |
| 35.3 | C39H62O15 | 771.4173 | 431, 413, 395, 377, 287, 269 | ||
| 35.6 | C44H70O19 | 903.4596 | 741, 625, 463, 431, 413, 395, 317, 305, 299, 287, 269 | ||
| 37.2 | di- | C37H58O12 | 695.4002 | 563, 449, 431, 413, 395, 299, 287, 269, 251 | |
| 38.1 | C38H62O13 | 727.4298 | 595, 449, 431, 413, 395, 377, 287, 269 | ||
| 37.7 | furostanol saponin (unknown) | C55H80O23 | 1109.5185 | 449, 431, 413, 395, 339, 305, 287, 207 | |
| 38.2 | C38H60O12 | 709.4161 | 449, 431, 413, 395, 299, 287, 269, 251 | ||
| 38.4 | C33H52O8 | 577.3731 | 431, 413, 395, 317, 299, 287, 269, 251 | ||
| Cluster 30 | |||||
| 33.0 | C33H55NO8 | 594.3999 | 448, 430, 412, 395, 286, 269, 251 | ||
| 33.4 | steroidal alkaloid (esculeogenin A or B) | C27H45NO4 | 448.3432 | 430, 412, 286, 251, 239 | |
| 33.7 | C38H63NO12 | 726.4440 | 594, 576, 558, 540, 490, 472, 448, 430, 412 | ||
| Other compounds | |||||
| 23.5 | C17H17NO3 | 284.1299 | 147 | ||
| 25.0 | C18H19NO4 | 314.1401 | 177 | ||
| 8.5 | norcoclaurine | 280 | C16H17NO3 | 272.1321 | 255, 237, 209, 194, 165 | ||
| 11.4 | norisoboldine* | 277, 310 (sh) | C18H19NO4 | 314.1390 | 297, 282, 265, 177 | ||
| 13.0 | coclaurine | 282, 310 (sh) | C17H19NO3 | 286.1440 | 269, 254, 237, 219, 209, 194, 191, 178, 175, 166 | ||
| 14.8 | 280, 310 (sh) | C20H23NO4 | 342.1695 | 297, 282, 265, 251, 237, 222, 189, 165 | |||
| 15.3 | reticuline | 279, 330 (sh) | C19H23NO4 | 330.1694 | 299, 267, 192, 177 | ||
| 16.4 | boldine* | 279, 309 (sh) | C19H21NO4 | 328.1535 | 297, 282, 265, 250, 237, 233, 205 | ||
| 17.3 | coclaurine isomer | 279, 309 (sh) | C17H19NO3 | 286.1434 | 269, 254, 237, 219, 209, 194, 178, 175, 165, 163 | ||
| 18.1 | alkaloid (unknown) | 276 | C31H23NO4 | 474.1710 | 456, 438, 295, 265 | ||
| 18.9 | isoboldine | 282, 307 | C19H21NO4 | 328.1543 | 297, 282, 265, 253, 237, 207 | ||
| 19.0 | alkaloid | 278, 307 | C45H53NO16 | 864.3447 | 591, 455, 312, 195, 165 | ||
| 18.8 | hernangerine/litsferine | 279, 312 (sh) | C18H17NO4 | 312.1234 | 295, 280, 265, 250, 237, 222, 205 | ||
| 19.0 | 282, 307 | C19H19NO4 | 326.1361 | 311, 295, 280, 265, 250, 237, 222, 205 | |||
| 20.3 | dauriciline | 282 | C36H40N2O6 | 597.2958 | 192, 178 |
| 30.4 | di- | C54H88O23 | 1105.5741 | 581, 441, 423, 405, 365, 217 | |
| 34.0 | C48H78O18 | 943.5265 | 797, 599, 441, 423, 405 | ||
| 34.3 | C42H68O14 | 797.4676 | 639, 599, 581, 441, 423, 405, 365, 201, | ||
| 34.6 | C48H76O18 | 941.5124 | 597, 439, 421, 313, 245 | ||
| 35.03 | di- | C54H84O21 | 1069.5589 | 923, 743, 599, 441, 423, 405, 217, 127 | |
| 35.4 | di- | C48H74O17 | 923.5008 | 599, 581, 567, 549, 549, 441, 423, 405, 365, 297, 217 |
| Alk_fr | 13.9 | 13.5 | N.D. |
| Alk_fr | 6.4 | 13.4 | N.D. |
| boldine | 145 μM | 116 μM | 46 μM |
- —Instituto Nacional de Ciência e Tecnologia em Ãreas Umidas10.13039/100020369
- —Universidade Federal de Mato Grosso do Sul10.13039/501100016182
- —Fundação de Apoio ao Desenvolvimento do Ensino, Ciência e Tecnologia do Estado de Mato Grosso do Sul10.13039/501100005672
- —Conselho Nacional de Desenvolvimento CientÃfico e Tecnológico10.13039/501100003593
- —Coordenação de Aperfeiçoamento de Pessoal de NÃvel Superior10.13039/501100002322
Peer Reviews
No public reviews on file for this paper yet. If you reviewed it on a platform where reviews are public (OpenReview, ICLR, NeurIPS, ICML), you can paste yours below so the community can read it here.
Videos
No videos yet. Explain this paper in a talk, walkthrough, or lecture? Add one.
Taxonomy
TopicsMicrobial Natural Products and Biosynthesis · Alkaloids: synthesis and pharmacology · Pharmacogenetics and Drug Metabolism
Introduction
1
Leukemia is a hematologic cancer that affects children, adults, adolescents, and elderly.^1^ In 2019, the global incidence of new leukemia cases was 643,579, while 474,924 deaths were registered. Additionally, 720,168 new leukemia cases are estimated in 2030.^2^ Leukemia can be described in four main subtypes according to the speed (acute or chronic) and blood cell type (myeloid or lymphoid).^2,3^
Leukemia induces an abnormal increase in leukocytes in the bone marrow or peripheral blood, resulting in cell populations at various differentiation stages, including leukemic stem cells, which exhibit low proliferation rates and a quiescent stage. These cells represent a problem for conventional treatments since the drugs act mainly against cells with high proliferation rates. Furthermore, leukemic stem cells are closely associated with disease recurrence, making them an important target for the development of new drugs, which are highly required.^4,5^
Natural products are a valuable source for the discovery of new bioactive compounds, representing approximately 50% of the approved drug candidates between 1981 and 2019. Notably, among the small compound anticancer drugs approved in this period, 76.7% are derived from natural products that highlight their importance and critical role in the development of new therapeutic agents, for example, the anticancer drugs taxol, vinblastine, and vincristine.^6^
Metabolomics and molecular networking have been successfully applied to suggest bioactive metabolites from natural product samples. These approaches accelerate the search and development of new drug candidates, promoting a rapid annotation of metabolic classes and target prediction.^7^ These strategies provide more holistic chemical information about the composition of extracts and fractions and the potential bioactive compounds.^8^ Metabolomics and statistical analyses were applied, for example, to determine the bioactive compounds from Brazilian plant species (Aspidosperma subincanum, Copaifera langsdorffii, Coussarea hydrangeifolia, Guarea guidonea, and Tapirira guianensis) against resistant human melanoma cells. Flavonoids, galloylquinic acid derivatives, and diterpenes were correlated to cytotoxic activity.^9^ Although the prediction of bioactive compounds has been done, several phenolic metabolites were identified, which are widely known in the literature and cannot represent a good target for the development of anticancer drugs. In this context, molecular networking can be a valuable tool, organizing the MS and MS/MS data and grouping similar metabolites that further the selection of the bioactive metabolic classes.^10^
This study aimed to use metabolomics and molecular networking approaches to determine the chemical composition from extracts of Brazilian plant species and to suggest the bioactive metabolites against leukemia cancer cell lineages (Kasumi-1, KG-11, and K-562).
Materials and Methods
2
Sample Collection
2.1
The plant materials were collected in Mato Grosso do Sul state, Brazil, in biomes Cerrado and Pantanal. The plant species were taxonomically identified by Alves and Damasceno Júnior. All specimens were deposited in the herbarium (CGMS) of Federal University of Mato Grosso do Sul (UFMS), and information about the plants is summarized in Table S1 (Supporting Information). This study was registered in the National Genetic Heritage Management System (SisGen) under the number A63DB37. The parts used for extraction were fruits (FR), aerial parts (AP), leaves (LV), and roots (RO). The collected species and their used parts are the following: Aeschynomene denticulata Rudd (AP, Fabaceae), Aspilia latissima Malme (LV and RO, Asteraceae), Astronium fraxinifolium Schott (AP, Anacardiaceae), Bauhinia mollis (AP, Fabaceae), Byttneria filipes Mart. ex K.Schum. (AP, Malvaceae), Centratherum punctatum Cass. (AP, Asteraceae), Coccoloba ochreolata Wedd. (AP, Fabaceae), Diospyros tetrasperma Sw. (AP, Ebenaceae), Echinodorus paniculatus Micheli (AP, Alismataceae), Erythroxylum anguifugum Mart. (AP, Erythroxylaceae), Lantana canescens Kunth (AP, Verbenaceae), Melanthera latifolia (Gardner) Cabrera (AP, Asteraceae), Ocotea diospyrifolia (Meisn.) Mez (AP, Lauraceae), Paullinia pinnata L. (AP, Sapindaceae), Psidium guineense Sw. (AP, Myrtaceae), Sesbania virgata (Cav.) Pers. (AP, Fabaceae), Solanum glaucophyllum Desf. (FR, Solanaceae), Tocoyena formosa (Cham. & Schltdl.) K. Schum. (AP, Rubiaceae), and Vitex cymosa Bertero ex Spreng. (AP, Lamiaceae). The plants were dried in a circulation oven (40 °C) and powdered in a knife mill.
Preparation of Extracts and Fractions
2.2
The dried and powdered plant materials (fruits, aerial parts, leaves, and roots) were extracted by an accelerated solvent extractor (ASE 150, Dionex) using ethanol and water 7:3 (v/v) at 100 °C, 1600 psi, a single cycle, a 5 min static time, a 60% rinse volume, and a 50 s purge time. These plant materials were previously cleaned using hexane and acetone 8:2 (v/v) to remove the wax constituents by ASE. All the extracts were concentrated by a rotatory evaporator, subsequently lyophilized, and kept at −20 °C until the biological and chemical evaluations. The hydroethanolic extracts from O. diospyrifolia and S. glaucophyllum were submitted to alkali-acid extractions to obtain the enriched alkaloid fractions (Alk_fr), as described by Sharma and collaborators,^11^ and they yielded the fractions with yields of 0.15 and 0.03%, respectively.
Chemical Analysis by LC-DAD-MS
2.3
The extracts were analyzed by liquid chromatography coupled to a diode array detector and a high-resolution mass spectrometer (LC-DAD-MS). A Shimadzu UFLC chromatograph (Tokyo, Japan) equipped with two LC20AD pumps, a SIL-20A autoinjector, an SPD-M20A diode array detector (DAD), a CBM-20A controller, and a CTO-20A oven was used. This equipment was also coupled to a MicrOTOF-Q III mass spectrometer (Bruker Daltonics) with electrospray ionization (ESI) and a QqTOF analyzer (quadrupole and time-of-flight).
For chromatographic analysis, a Kinetex C18 column (2.6 μm, 100 Å, 150 × 2.1 mm, Phenomenex) was applied, which was kept at 50 °C during the analysis, and the flow rate was 0.3 mL/min. The mobile phase was composed of acetonitrile (B) and ultrapure water (A), both containing formic acid 0.1% (v/v). The gradient elution profile was programmed to 0–2 min 3% B, 2–25 min 3–25% B, 25–40 min 25–80% B, and 40–43 min 80% B. The samples were analyzed in positive and negative ion modes, and the MS parameters were the capillary voltages of 2,500 and 3,500 kV for positive and negative ion modes, respectively. Nitrogen was applied as a nebulizer (4 bar), drying (9 L/min), and collision gas.
The 19 polar extracts were solubilized in methanol and water 6:4 (v/v) at a concentration of 2 mg/mL and filtered on 0.22 μm PTFE syringe filters (Millex, Millipore), and 1 μL of each sample was injected into the chromatographic system.
Statistical Processing and Analysis of Metabolomic
Data
2.4
The raw data were converted to .cdf and, subsequently, were aligned and reduced by software MetAlign and MSClust, respectively. Univariate and multivariate statistical analyses were performed by Metaboanalyst 6.0. The biological activity data were included in the data sets to correlate the chemical and biological data and to suggest the bioactive compounds. The annotation was based on UV, MS, and MS/MS spectral data compared to literature data, as well as a spectral comparison of mass spectrometry data deposited in GNPS (https://gnps.ucsd.edu). The molecular formulas of compounds were determined considering errors and mSigma values up to 8 ppm and 30, respectively.
The data were log-transformed (base 10) and used to obtain principal component analysis (PCA), and the hierarchical clustering (dendrogram) was constructed applying the Euclidean distance measure and clustering algorithm ward. A volcano plot based on the fold change and a p-value threshold of 0.05 were also obtained.
Molecular Networking and Annotation
2.5
LC-MS and MS/MS data were converted to mzXML by MsConvert. Subsequently, these data were applied to produce the molecular networking by the GNPS platform, and the molecular networking was processed and edited in Cytoscape 3.9.1.
The molecular networking was constructed considering five fragment ions from MS/MS spectra, and the mass tolerances of precursor and fragment ions were considered 0.03 and 0.08 Da, respectively. The molecular network was created considering cosine greater than 0.6 and five ions combined. It is available in the GNPS platform at the link https://gnps.ucsd.edu/ProteoSAFe/status.jsp?task=ab38a049b1314471bf42eea12f88fd31. Additionally, the raw data were processed using MZmine software (version 4.5.0), following a series of steps: mass detection, chromatogram building, chromatogram deconvolution, deisotoping, alignment using the join aligner, blank subtraction from the feature list, feature finding, linear normalization, and spectral library searching. Detailed parameters for each step are provided in the Supporting Information. The MS1 data were exported in .csv format, while the MS2 data were prepared for upload to the GNPS platform and to obtain the feature-based molecular networking (FBMN) (https://gnps.ucsd.edu/ProteoSAFe/status.jsp?task=9dc8656aa292409e8337da1d35c4eb82). Compound annotation was performed using spectral library matching within MZmine, complemented by manual annotation based on spectral data comparisons of the literature-reported data.
Cell Cultures
2.6
Human leukemic cell lines (K-562, Kasumi-1, and KG-1) were obtained from the American Type Culture Collection (ATCC). K-562 was maintained in a Roswell Park Memorial Institute (RPMI 1640) medium (Sigma-Aldrich, Germany) supplemented with 10% FBS. The cells were cultured in Iscove’s modified Dulbecco’s medium (IMDM) supplemented with 20% fetal bovine serum (FBS). The cell lines were grown in media containing 100 U/mL penicillin (Sigma-Aldrich, Germany) and 100 μg/mL streptomycin (Sigma-Aldrich, Germany) in a humidified incubator at 37 °C with 5% CO_2_. The passage numbers for all leukemic cell lines ranged between 3 and 6.
Cytotoxicity Effects on Leukemia Cell Lines
2.7
The cytotoxicity assay was performed by the AlamarBlue assay method (AlamarBlue, Biosource, Camarillo, CA, USA).^12,13^ The extracts, fractions, and boldine (Sigma-Aldrich) were evaluated against K-562 (chronic myeloid leukemia), KG-1 (acute myeloid leukemia), and Kasumi-1 (acute myeloblastic leukemia) cell lines. The plant extracts and fractions, previously lyophilized and homogenized, were initially evaluated using 10 and 100 μg/mL, and the alkaloid fractions from O. diospyrifolia and S. glaucophyllum were evaluated against K-562 and KG-1 leukemic cell lines treated with different concentrations (50, 35, 20, and 10 μg/mL).
The samples were resuspended in dimethyl sulfoxide (DMSO), diluted in culture medium (final concentration DMSO 0.4%), and added to the test plates. Cells (1 × 10^5^ cells/mL^–1^) were grown in 96-well microplates containing a supplemented medium and different concentrations of the extracts. After incubation for 24 h, 20 μL of resazurin solution (0.15 mg/mL) was added, and the plates were shaken briefly by a plate shaker. After the incubation for 4 h at 37 °C, the assay plates were shaken before measurements. The samples were measured at wavelengths of 570 and 600 nm by a microplate reader (Thermo Scientific Varioskan LUX). Each experiment was performed in triplicate. The percentage of growth for each cell line was calculated in the program for graphs and data analysis Prism, GraphPad 8.0.
Annexin V/7-AAD Flow Cytometry Assay
2.8
An Annexin V-FITC/7-AAD double staining assay was conducted to assess the proapoptotic effect of the alkaloid fractions from O. diospyrifolia and S. glaucophyllum. K-562 and KG-1 cells were seeded at a density of 10^5^ cells/mL in 96-well plates and treated with alkaloid fractions of S. glaucophyllum (13 μg/mL) and O. diospyrifolia (6 and 13 μg/mL to K-562 and KG-1, respectively). After 24 h, the cells were resuspended in an Annexin V binding buffer (0.14 M NaCl, 2.5 mM CaCl_2_, and 0.01 M HEPES, pH 7.4) and incubated at room temperature with 1 μL of Annexin V-FITC (Becton Dickinson, USA) and 5 μM DRAQ5 (Cell Signaling, USA) for 30 min. The analysis was carried out using a CytoFLEX flow cytometer (Beckman Coulter, USA) and FlowJo v10 software (Becton Dickinson, USA).
Intracellular Protein Labeling
2.9
Cells (10^5^/mL) were treated for 24 h with EC_50_ concentrations of the alkaloid fractions from O. diospyrifolia and S. glaucophyllum. After treatment, the cells were fixed with BD Cytofix (BD Biosciences, USA) for 15 min, washed with a Becton Dickinson Perm/wash buffer, and permeabilized with Perm Buffer III (Becton Dickinson, USA) for 30 min at room temperature. For intracellular protein labeling, the cells were incubated for 1 h with primary antibodies (cleaved caspase-3 PE catalog no. 550914, BD Biosciences, USA) and (phospho-histone H2A.X no. 9718, Cell Signaling, USA). Subsequently, an antirabbit IgG secondary antibody conjugated with Alexa Fluor 488 (Thermo Fisher Scientific, USA) was incubated for 40 min. Fluorescence was then measured using a CytoFLEX flow cytometer (Beckman Coulter, USA), and the data were analyzed using FlowJo v10 software (Becton Dickinson, USA). A total of 40,000 events were collected per sample, and protein analyses were conducted by quantifying the geometric mean (G.m).
Statistical Analysis
2.10
The results obtained in the in vitro assay of the cytotoxicity effect against the cell lines were expressed as means ± standard error of the mean (SEM) and compared with the controls by analysis of variance (ANOVA) followed by Tukey’s test (GraphPad Prism 5). The statistically significant p-value <0.05 was considered as a statistical difference.
Results and Discussion
3
Cytotoxicity Effects on Leukemia Cell Lines
of Extracts
3.1
The cytotoxicity of the extracts was initially evaluated against Kasumi-1, KG-1, and K-562 leukemia cell lines; the results are illustrated in Figure 1. The extracts were more active against the K-562 leukemia cell lineage, and the polar extracts that presented approximately a reduction of 60–70% of cell viability at 100 μg/mL were the following: S. virgata, Aeschynomene denticulata (A. denticulata), E. anguifugum, P. guineense, A. fraxinifolium, C. ochreolata, S. glaucophyllum, and P. pinnata (Figure 1A).
Cell proliferation and cytotoxic screening of the polar extracts on K-562 (A), Kasumi-1 (B), and KG-1 (C) leukemia cell lines at 100 μg/mL for 24 h. Extracts from the following species were evaluated: Sesbania virgata (1), Centratherum punctatum (2), Lantana canescens (3), Melanthera latifolia (4), Aeschynomene denticulata (5), Echinodorus paniculatus (6), Byttneria filipes (7), Aspilia latissima aerial parts (AP) (8), A. latissima roots (9), Erythroxylum anguifugum (10), Tocoyena formosa (11), Diospyros tetrasperma (12), Psidium guineense (13), Vitex cymosa (14), Astronium fraxinifolium (15), Coccoloba ochreolata (16), Solanum glaucophyllum (17), Paullinia pinnata (18), and Ocotea diospyrifolia (19). Doxorubicin was used as a positive control. Results were expressed as the mean ± standard deviation (SD).
The extracts from P. guineense, A. fraxinifolium, C. ochreolata, S. glaucophyllum, P. pinnata, and O. diospyrifolia showed approximately 40% inhibition on the KG-1 leukemia cell line (Figure 1B), while the extracts exhibited lower activity against the Kasumi-1 leukemia cell lineage than the observed for the other lineages. The most active extracts against Kasumi-1 leukemia cells that revealed inhibition of about 20% were S. virgata, E. anguifugum, A. denticulata, D. tetrasperma, P. guineense, V. cymosa, A. fraxinifolium, C. ochreolata, S. glaucophyllum, P. pinnata, and O. diospyrifolia (Figure 1C). All the extracts were also evaluated against leukemia cell lines at 10 μg/mL, and they were inactive at this concentration except the extracts of S. glaucophyllum and O. diospyrifolia on the Kasumi-1 cell lineage that revealed a cell inhibition of 40% (Figure S1, Supporting Information).
Species from the Fabaceae, Erythroxylaceae, Myrtaceae, Anacardiaceae, Solanaceae, Sapindaceae, and Lauraceae families demonstrated activity against leukemia cell lines. These findings suggest that these plants can be promising sources of bioactive compounds for leukemia cells. However, modern approaches to generate comprehensive chemical profiles from samples are crucial to accelerate the identification of bioactive compounds, minimizing the selection of nonpromising targets or pan-assay interference compounds (PAINS).^9,10^
Chemical Analysis Metabolomics and Molecular
Networking
3.2
The extracts were analyzed by LC-DAD-MS, and they were categorized into active and inactive extracts according to the cytotoxicity observed on the leukemic cancer cell lines (KG-1, Kasumi-1, and K-562). All of the chromatograms from the extracts are illustrated in Figure S2. The LC-MS data were processed, as described previously, and 480 entrances were listed. Statistical analyses were performed in the Metaboanalyst 6.0 platform.
The PCA explained 5.7 and 14.4% of data variations in PC1 and PC2 (Figure 2A), respectively, showing a tendency for the separation of groups relative to active (red) and inactive extracts (green). From hierarchical clustering, a dendrogram was obtained, and it showed the active extracts from C. ochreolata, A. fraxinifolium, E. anguifugum, O. diospyrifolia, P. pinnata, A. denticulata, and S. virgata grouped in the same cluster that revealed some chemical similarities (Figure 2B). Additionally, the active extracts from P. guineense and S. glaucophyllum were grouped into other clusters.
(A) Principal component analysis (PCA) and (B) hierarchical clustering (dendrogram) of the features obtained from LC-MS data of inactive (green) and active (red) extracts.
The heat map from the active and inactive extracts highlighted the chemical differences from the samples, including the common metabolites in different species (Figure S3). The features with statistical significance (p < 0.05) and the magnitude of change (fold change) to differentiate the active and inactive extracts were listed from the volcano plot (Figure S4A), and some of their box plots were illustrated (Figure S4B). Thus, the following compounds were highlighted for the active samples: catechin, epicatechin, steroidal saponin (m/z 741.4426), juribidine (20), myricetin, O-deoxyhexosyl-hexosyl kaempferol, O-deoxyhexosyl kaempferol, O-galloyl procyanidin dimer, procyanidin dimer, O-pentosyl quercetin, steroidal alkaloid (17), and proanthocyanidin (cinnamtannin B_1_) (Figure S4B).
The results also suggested potential bioactive metabolites against leukemia cells, mainly represented by O-glycosylated flavonoids, flavan-3-ols, and proanthocyanins. These constituents have been widely reported for several biological activities in the literature. In addition, polyphenols are also described as possible interference of assays since they can act as metal chelators and redox cycling readouts.^14,15^ Thus, a molecular networking strategy was applied to organize the MS and MS/MS data, grouping similar compounds, assisting with the annotation, and improving the determination of the potential active metabolites, such as alkaloids and saponins.
The blue color features were observed from active extracts in molecular networking, while the orange color features for inactive extracts against leukemia cell lines (Figure 3). The description of the clusters related to metabolite classes is summarized in Table S2 (Supporting Information). They included, mainly, C-glycosylated flavonoids (cluster 1), chlorogenic acids (cluster 3), procyanidins (type B-cluster 4 and type A-cluster 5), O-glycosylated flavonoids (cluster 6), triterpenes and triterpenoid saponins (clusters 7, 21, and 24), steroidal saponins (clusters 10 and 19), di-C-glycosylated flavonoids (cluster 11), spermidine derivatives (cluster 12), spirostanol steroidal saponins (cluster 13), fatty acids (cluster 14), steroidal alkaloids (cluster 15), sesquiterpene lactones (cluster 16), nonglycosylated flavonoids (cluster 17), aporphine alkaloids (cluster 18), O-glycosyl-phenylpropanoyl/gallolyl flavonols (cluster 20), and furostanol steroidal saponins (cluster 22).
Molecular networking of extracts from all of the plant species. Nodes of nonactive and active samples are colored orange and blue, respectively. The edge strength is proportional to the cosine values.
Features exclusively present in the active samples (blue) were observed in some clusters. These metabolites were extensively studied and annotated since they may represent key compounds with potential activity against leukemia cancer cells. The molecular network categorizes similar features into clusters based on their fragmentation profile, facilitating the selection of target compounds to determine the target compounds. Here, this approach yielded additional insights beyond those obtained from statistical analyses of the chemical data.
From cluster 10, features of S. glaucophyllum were grouped and they are described in Table 1 and Figure 4. All of the compounds revealed a fragment ion at m/z 431, which is compatible with C_27_H_42_O_4_ and suggested steroidal aglycones. The metabolites revealed 49, 54, or 55 carbons in their structures. In addition, consecutive losses of sugars from these compounds confirmed steroidal saponins.^16^ Although steroidal saponins are commonly reported from the genus Solanum, the saponins grouped in cluster 10 were not found in the literature that suggested new metabolites. Some steroidal saponins from the genus Solanum have shown cytotoxic activity against cancer cells that can represent a target group to search for bioactive compounds.^17^
Details of the features from some clusters (10, 13, 15, 18, 22, 24, and 30) and the annotated metabolites detected in O. diospyrifolia, P. pinnata, and S. glaucophyllum.
Table 1: Compounds Annotated from Clusters 10, 13, 15, 22, and 30 by LC-DAD-MS Data That Were Detected from Solanum glaucophylluma
The metabolites grouped in cluster 13 did not exhibit UV absorption, and they revealed consecutive losses of sugars such as 176, 162, 146, and 132 u, indicating the presence of glucuronyl, hexosyl, deoxyhexosyl, and pentosyl substituents, respectively.^16,18^ These data were similar to those of the metabolites grouped in cluster 22 (Table 1). The aglycones of features from clusters 13 and 22 exhibited the ions at m/z 433 (C_27_H_44_O_4_) and 431 (C_27_H_42_O_4_), and the consecutive losses of water molecules (18 u) from them were observed such as the ions m/z 415, 397, 413, and 395, which are compatible with losses observed for steroidal aglycone. The losses of 144 u, yielded by cleavage from the E-ring of steroidal aglycone with subsequent losses of the water molecule, confirmed spirostanol saponin (metabolites from cluster 13), and, additionally, the furostanol saponins (metabolites from cluster 22) were suggested when the losses of 114 u were also observed.^16,18,19^ For example, fragment ions m/z 289 [aglycone(433)+H-144]^+^, 271 [aglycone(433)+H-144-H_2_O]^+^, and 253 [aglycone(433)+H-144-2xH_2_O]^+^ were observed for 8–11. Thus, it was possible to annotate several spirostanol (8–12) and furostanol steroidal saponins (25–35) and they were detected only from the extract of S. glaucophyllum, which was active mainly against K-562 leukemia cancer cells.
The saponin 26, a furostanol saponin, was putatively annotated as macaoside K/J or I, which has demonstrated an EC_50_ of 14.2–37.6 μg/mL against SK-Lu-1, HepG2, MCF-7, and T24 cancer cell lines.^20^ These results highlight potential targets to research new compounds against cancer cells since some saponins from this cluster were not evaluated for them or reported in the literature yet, such as 31, 33, and 35.
The metabolites 13–24 (cluster 15) did not exhibit UV absorption, presented nitrogen in their molecular formulas, and revealed losses of glycosides (e.g., hexosyl 162 u) that indicated steroidal alkaloids, a common metabolite class reported for Solanum species.^17^ In MS/MS, the aminospirane alkaloids lose an amine (17 u) and the spirostane ring by sequential dehydration and hydrogen rearrangement, which occur by the ring opening with anchimeric assistance, to yield the diagnostic fragment ions.^21^ The metabolite 13 (m/z 758.4679 [M + H]^+^), for example, yielded the product ions by losses of hexosyl groups (m/z 596 [M+H-162]^+^ and 416 [M+H-2x162-H_2_O]^+^), amine (m/z 399 [416+H-NH_3_]^+^), and the losses relative to the spirostane ring (m/z 285 and 255). Thus, alkaloid 13 was annotated as O-hexosyl jurubine (di-O-glycosylated steroidal alkaloid).
The steroidal alkaloids of cluster 15 (Figure 4) presented similar fragmentation pathways, and the molecular network also showed these similarities and the mass differences of features. Compound 23 showed a mass difference relative to an acetyl group (−OCOCH_3_) compared to metabolite 20 and was annotated as acetyl-juripidine. Additionally, other glycosylated steroidal alkaloids were also annotated, such as jurubine (O-glycosyl steroidal alkaloid) (14), di-O-hexosyl-juripidine (15), di-O-hexosyl juribidine (16), juribidine (20), propionyl-juripidine (21), and other unknown steroidal alkaloids (17m/z 457.3790, 18m/z 1302.8084, 19m/z 732.6111, 22m/z 472.3782, and 24m/z 590.3730). The alkaloids from cluster 15 are scarcely studied, but they are an excellent aim to search new cytotoxic compounds since there are several cytotoxic data reported for the metabolite class of the steroidal alkaloids of Solanum species.^17^
The cluster 18 is composed of benzylisoquinoline and aporphine alkaloids (Figure 4), and the fragmentation pathway of them was similar, such as the losses of 17 (NH_3_), 30 (CH_2_O), and 15 u (^·^CH_3_), which confirmed the absence of a methyl group in the nitrogen, the methylenedioxy, and methoxyl substituents (Figure S5). For example, the alkaloid 51 showed an intense ion at m/z 312.1234 [M + H]^+^ compatible to the molecular formula C_18_H_14_NO_4_. Its fragment ions were observed at m/z 295 [M+H-NH_3_]^+^, 280 [M+H-NH_3_-^·^CH_3_]^+^, 265 [M+H-NH_3_-CH_2_O]^+^, and 237 [M+H-NH_3_-CH_2_O-CO]^+^ (Table 2). Thus, the alkaloid 51 was annotated as hernangerine/litsferine and the spectral data were compatible with those reported for it.^22^ In addition, the alkaloid boldine (46) was also annotated, which showed a hit with the spectral data deposited in GNPS and was confirmed by injection of an authentic standard. All the alkaloids grouped in cluster 18 are summarized in Table 2 and also included the annotated alkaloids norcoclaurine (41), norisoboldine (42), and N-methyl boldine (44).
The alkaloid 51, hernangerine/litsferine, is an aporphinoid alkaloid with a 1,2-methylenedioxy, and this group has been related to better cytotoxic activities since there is better stability of interaction in relation to thermal denaturation of DNA double helices compared to aporphinoids without a 1,2-methylenedioxy group; in addition, they promoted inhibition of topisomerase I by intercalation into DNA that can explain the cytotoxic properties.^23^ Therefore, these alkaloids could be good targets against leukemia and cancer cells.
Cluster 20 (Figure S6) is mainly composed of features of active samples, and these metabolites are annotated and summarized in Table S3. This cluster is yielded from flavonols linked to glycosides and phenylpropanoids (sinapoyl, feruloyl, or coumaroyl) or galloyl substituents. The aglycones annotated in this cluster were myricetin, quercetin, and kaempferol. Therefore, the annotated flavonols from cluster 20 were the following: O-galloyl-hexosyl myricetin (m/z 633.1090 [M + H]^+^) (54), O-galloyl-hexosyl quercetin (m/z 617.1141) (55), di-O-hexosyl quercetin (m/z 627.1546) (56), O-sinapoyl-hexosyl myricetin (m/z 687.1564) (57), O-feruloyl-hexosyl myricetin (m/z 657.1448) (58), O-feruloyl dihexosyl kaempferol (m/z 787.2078) (59), O-sinapoyl-hexosyl quercetin (m/z 671.1621) (60), O-feruloyl-hexosyl quercetin (m/z 641.1481) (61, 62), O-coumaroyl-hexosyl kaempferol (m/z 595.1446) (63), and O-feruloyl-hexosyl kaempferol (m/z 625.1538) (64). Additionally, the compounds from cluster 28 are described in Table S4, and the annotation performed by the comparison of the mass spectra library in MZmine is summarized in Table S5 (Supporting Information).
The metabolites 65–70 were grouped in cluster 24, which are present only in the A. denticulata extract (Figure 4 and Table 3). These constituents did not show UV absorption, and their molecular formulas, determined from the accurate MS, revealed 42, 48, or 54 carbons. The fragment ions from aglycones (m/z 441 and 439 [aglycone+H-H_2_O]^+^ for C_30_H_48_O_2_ and C_30_H_46_O_2_, respectively) and the losses of glycosides (hexosyl 162 u, deoxyhexosyl 146 u, and glucuronyl 176 u) confirmed triterpenoid saponins; in addition, losses of water molecules were commonly observed, as cited in the literature.^24^ The mass differences between the saponins in cluster 24 were highly relevant for the annotation of the saponins, such as for compounds 65 (m/z 1105.5741) and 66 (m/z 943.5265) that presented a difference of a hexosyl (162 u). Thus, the annotated saponins were di-O-hexosyl deoxyhexosyl glucuronyl triterpenoid saponin (abrisaponin SB or D2) (65), O-hexosyl deoxyhexosyl glucuronyl triterpenoid saponin (soyasaponin I or Bb) (66), O-hexosyl glucuronyl triterpenoid saponin (soyasaponin III or Bb’) (67), O-hexosyl deoxyhexosyl glucuronyl triterpenoid saponin (dehydrosoyasaponin I) (68), di-O-hexosyl deoxyhexosyl glucuronyl triterpenoid saponin (soyasaponin VI or βg) (69), and di-O-hexosyl glucuronyl triterpenoid saponin (soyasaponin γg) (70).
Table 3: Compounds Annotated from Cluster 24 by LC-DAD-MS Data That Were Detected Only from Aeschynomene denticulataa
Cytotoxicity Effects of Alkaloids from S. glaucophyllum and O. diospyrifolia and Flow Cytometry
3.3
The extracts from S. glaucophyllum and O. diospyrifolia were subjected to alkali-acid extraction, yielding their respective alkaloid fractions (Alk_fr). These fractions were analyzed by LC-DAD-MS, and their chromatogram profiles are illustrated in Figure 5. In the Alk_fr of S. glaucophyllum, alkaloids 13–14, 16–17, 20–21, 23, and 34–38 were annotated, while alkaloids 41–49 and 51–53 were detected in the Alk_fr of O. diospyrifolia. These classes of alkaloids have shown cytotoxic properties against cancer cell lines, representing an important source for drug discovery.^25,26^
Base peak chromatograms from S. glaucophyllum and O. diospyrifolia extracts and their alkaloid fractions (Alk_fr).
The K-562 cell line demonstrates the highest sensitivity among the leukemia lines evaluated in this study, whereas the KG-1 line showed greater resistance.^27^ These two cell lines were therefore selected to assess the cytotoxic activity of the alkaloid fractions from S. glaucophyllum and O. diospyrifolia (Figure 6), and EC_50_ values were calculated (Table 4). For the K-562 lineage, the EC_50_ values of alkaloid fractions from S. glaucophyllum and O. diospyrifolia were 13.9 and 6.4 μg/mL, respectively, while for the KG-1 lineage, the values were 13.5 and 13.4 μg/mL. The alkaloid fractions exhibited higher cytotoxic activity compared to the crude extracts of S. glaucophyllum and O. diospyrifolia, suggesting that these alkaloids can contribute to the antileukemic activity observed.
Table 4: EC50 of Alkaloid Fractions (Alk_fr) from S. glaucophyllum and O. diospyrifolia and Boldine against Leukemia Cancer Cell Linesa
*Cell proliferation and cytotoxic profile of boldine on Kasumi-1, K-562, and KG-1 cells (A) and alkaloid fractions (Alk_fr) from S. glaucophyllum and O. diospyrifolia on K-562 (B) and KG-1 (C). Cell viability was assessed by using a resazurin assay. The cytotoxic activities of Alk_fr from S. glaucophyllum and O. diospyrifolia (D, E) in K-562 and KG-1 were assessed by analysis of Annexin V-FITC/DRAQ5 staining after 24 h with EC50 for 24 h (F, G). The results are the means ± SEM of three independent experiments performed in triplicate. P < 0.05. One-way ANOVA followed by Dunnett’s post hoc test was used.
Boldine (46), a natural aporphine alkaloid, was evaluated at different concentrations against Kasumi-1, KG-1, and K-562 leukemia cells (Figure 6A–C) and revealed EC_50_ of 46, 116, and 145 μM, respectively (Table 4). This alkaloid has been evaluated against various cancer cell lines, showing EC_50_ values of 46.5, 50.8, and 160 μg/mL for MDA-MB231, MDA-MB468, and MCF-7 human breast cancer cells.^26,28^ Additionally, boldine has been reported to induce the activation of caspase-9 and caspase-3/7 and inhibits the kappa B factor and breast cancer in vivo at doses of 50 or 100 mg/kg in animal models. In addition, this alkaloid did not demonstrate acute toxicity at a dose of 100 mg/kg,^28^ and it showed activity against U138-MG human glioma cells and increased the cells in the G2/M phase after 24 h.^25^
The alkaloids norisoboldine (42), reticuline (45), and hernangerine/litsferine (51) were the most intense of the peaks in Alk_fr of O. diospyrifolia. Hernangerine (51) has shown EC_50_ of 1.09 (3.5 μM), 1.53, 2.83, and 2.94 μg/mL against P388 leukemia, KB-16 nasopharyngeal, A549 nonsmall cell lung, and HT29 colorectal human cancer cell lines, respectively.^29^ Reticuline has revealed EC_50_ of 38, 32.1, and 18.3 μM for SUP-B15 (acute lymphoblastic leukemia), KOPN-8 (acute lymphoblastic leukemia with MLL-MLLt1/ENL fusion), and NALM-06 (non-T/non-B acute lymphoblastic leukemia at relapse with P15INK4B and P16INK4A deletions), respectively.^30^
The cytotoxic activity induced by alkaloid fractions (Alk_fr) of S. glaucophyllum and O. diospyrifolia was investigated through Annexin V and DRAQ5 staining to evaluate the treatments for phosphatidylserine externalization and membrane integrity loss. An Anx+/DRAQ5- response indicates phosphatidylserine externalization and the onset of early apoptosis. In contrast, double staining (Anx+/DRAQ5+) indicates late apoptosis/necrosis-like characterized by both the loss of membrane integrity and labeling of phosphatidylserine.^31^ The treatment with the EC_50_ of the alkaloid fraction of S. glaucophyllum on K-562 (Figure 6D,F) resulted in a significant reduction in cell viability, predominantly due to compromised plasma membrane integrity. In contrast, the treatment with an alkaloid fraction of O. diospyrifolia at a concentration of EC_50_ also reduced the cell viability, but it showed relatively less impact on plasma membrane integrity. For KG-1 cells (Figure 6D,G), the exposure to the alkaloid fraction of S. glaucophyllum induced a milder reduction in membrane integrity with cell death displaying apoptotic characteristics, while the alkaloid fraction of O. diospyrifolia was associated with the loss of membrane integrity and the onset of late apoptosis.
Evidence that alkaloid fractions of S. glaucophyllum and O. diospyrifolia induced apoptosis in K-562 and KG-1 cells prompted an assessment of whether these treatments effectively triggered caspase-3 activation. In both K-562 and KG-1 cells, the treatments increased cleaved caspase-3 and the alkaloid fraction of O. diospyrifolia induced approximately a 3-fold increase in both cell lines (Figure 7A,B). Caspases are endopeptidases that cleave specific sites on approximately 1500 substrates and play a crucial role in mediating apoptosis. Among them, caspase-3 is considered the most critical enzyme in this process. The activation of caspase-3 is commonly linked with phosphatidylserine externalization and other morphological changes characteristic of apoptosis.^32^ Additionally, the phosphorylation of the Ser-139 residue in the H2AX histone variant constitutes an early cellular response to the induction of double-strand breaks in DNA. This phosphorylation is regarded as a specific and sensitive molecular marker of DNA damage.^33^ In K-562 and KG-1 cells, a significant increase in p-H2AX was observed only for the treatment with the Alk_fr of O. diospyrifolia, whereas in KG-1 cells, the Alk_fr of S. glaucophyllum caused a decrease in phosphorylation in this protein.
*Analysis of apoptosis and DNA damage cell signaling from the alkaloid fractions (Alk_fr) of S. glaucophyllum and O. diospyrifolia. (A, B) Cleaved caspase-3 activation. Activation of p-H2AX (Ser-139) in K-562 (C) and KG-1 cells after 24 h (D) and typical flow cytometry histograms. The results are the means ± SEM of three independent experiments performed in triplicate. P < 0.05. One-way ANOVA followed by Dunnett’s post hoc test was used.
Therefore, our findings are significant and highlight potential antileukemic extracts and lead compounds, such as aporphine alkaloids. It is important to note that the inclusion of diverse plant families with various chemical constituents posed challenges for statistical analysis. However, these analyses were conducted thoroughly and complemented by molecular networking, which assisted in the determination of lead compounds. Furthermore, the most representative samples identified in this study can serve as a source for future research focusing on specific plant genera or families, mainly involved in alkaloid biosynthesis. In addition to the active extracts from O. diospyrifolia and S. glaucophyllum that demonstrated efficacy against leukemia cell lines, our study also identified other promising samples. These samples have potential for future research aimed at discovering bioactive metabolites and elucidating their mechanisms of action.
Conclusions
4
Our study highlights the innovative application of metabolomics and molecular networking to identify potential bioactive compounds against leukemia cancer cells. By the integration of advanced statistical analyses and targeted metabolite annotation, we successfully distinguished chemical differences across plant extracts from 14 families. Then, steroidal and aporphine alkaloids were identified as promising candidates for cytotoxic activity, particularly those derived from Solanum glaucophyllum and Ocotea diospyrifolia, which demonstrated significant proapoptotic effects, caspase-3 activation, and DNA damage induction.
The alkaloid fractions exhibited superior cytotoxic activity compared to that of crude extracts, emphasizing the importance of alkaloids for the activity. Furthermore, the approach of molecular networking enabled the discovery of unique metabolite clusters, including novel steroidal saponins and aporphine alkaloids, which represent valuable leads for antileukemic drug development. Therefore, these strategies employed in this study serve as a connection between chemical diversity and targeted bioactivity, providing a robust framework for future investigations of natural products as potential therapeutic agents.
The reference list from the paper itself. Each links out to its DOI / PubMed record.
- 1Senft D.; Jeremias I. A rare subgroup of leukemia stem cells harbors relapse-inducing potential in acute lymphoblastic leukemia. Exp. Hematol. 2019, 69, 1–10. 10.1016/j.exphem.2018.09.006.30261200 PMC 6542675 · doi ↗ · pubmed ↗
- 2Vos T.; Lim S. S.; Abbafati C.; et al. Global burden of 369 diseases and injuries in 204 countries and territories, 1990–2019: a systematic analysis for the global burden of disease study 2019. Lancet 2020, 3960 (10258), 1204–1222. 10.1016/S 0140-6736(20)30925-9.PMC 756702633069326 · doi ↗ · pubmed ↗
- 3Sharma R.; Jani C. Mapping incidence and mortality of leukemia and its subtypes in 21 world regions in last three decades and projections to 2030. Ann. Hematol. 2022, 101 (7), 1523–1534. 10.1007/s 00277-022-04843-6.35536353 · doi ↗ · pubmed ↗
- 4O’Reilly E.; Zeinabad H. A.; Szegezdi E. Hematopoietic versus leukemic stem cell quiescence: Challenges and therapeutic opportunities. Blood Rev. 2021, 50, 10085010.1016/j.blre.2021.100850.34049731 · doi ↗ · pubmed ↗
- 5van Gils N.; Denkers F.; Smit L. Escape from treatment; the different faces of leukemic stem cells and therapy resistance in acute myeloid leukemia. Front. Oncol. 2021, 11, 65925310.3389/fonc.2021.659253.34012921 PMC 8126717 · doi ↗ · pubmed ↗
- 6Newman D. J.; Cragg G. M. Natural products as sources of new drugs over the nearly four decades from 01/1981 to 09/2019. J. Nat. Prod. 2020, 83 (3), 770–803. 10.1021/acs.jnatprod.9b 01285.32162523 · doi ↗ · pubmed ↗
- 7Dong S. H.; Duan Z.-K.; Bai M.; Huang X.-X.; Song S.-J. Advanced technologies targeting isolation and characterization of natural products. Trends Anal. Chem. 2024, 175, 11771110.1016/j.trac.2024.117711. · doi ↗
- 8Pilon A. C.; Del Grande M.; Silvério M. R. S.; Silva R. R.; Albernaz L. C.; Vieira P. C.; Lopes J. L. C.; Espindola L. S.; Lopes N. P. Combination of GC-MS molecular networking and larvicidal effect against Aedes aegypti for the discovery of bioactive substances in commercial essential oils. Molecules 2022, 27 (5), 158810.3390/molecules 27051588.35268689 PMC 8912102 · doi ↗ · pubmed ↗