Investigating Associations Between Prognostic Factors in Gliomas: Unsupervised Multiple Correspondence Analysis
Maria Eduarda Goes Job, Heidge Fukumasu, Tathiane Maistro Malta, Pedro Luiz Porfirio Xavier

TL;DR
This paper uses a data science method called MCA to explore how different factors in glioma tumors are related, especially focusing on their connection to a stem-like cell trait called stemness.
Contribution
The novel application of unsupervised multiple correspondence analysis (MCA) to uncover associations between glioma prognostic factors and stemness phenotype.
Findings
Higher DNA methylation stemness index is strongly associated with poor prognosis features like glioblastoma and IDH wild type.
MCA successfully identifies significant associations between clinical and molecular variables in glioma datasets.
MGMT promoter unmethylation and telomerase expression are linked to increased stemness in gliomas.
Abstract
Multiple correspondence analysis (MCA) is an unsupervised data science methodology that aims to identify and represent associations between categorical variables. Gliomas are an aggressive type of cancer characterized by diverse molecular and clinical features that serve as key prognostic factors. Thus, advanced computational approaches are essential to enhance the analysis and interpretation of the associations between clinical and molecular features in gliomas. This study aims to apply MCA to identify associations between glioma prognostic factors and also explore their associations with stemness phenotype. Clinical and molecular data from 448 patients with brain tumors were obtained from the Cancer Genome Atlas. The DNA methylation stemness index, derived from DNA methylation patterns, was built using a one-class logistic regression. Associations between variables were evaluated…
Genes, proteins, chemicals, diseases, species, mutations and cell lines named across the full text — each resolved to its canonical identifier and authoritative record.
Click any figure to enlarge with its caption.
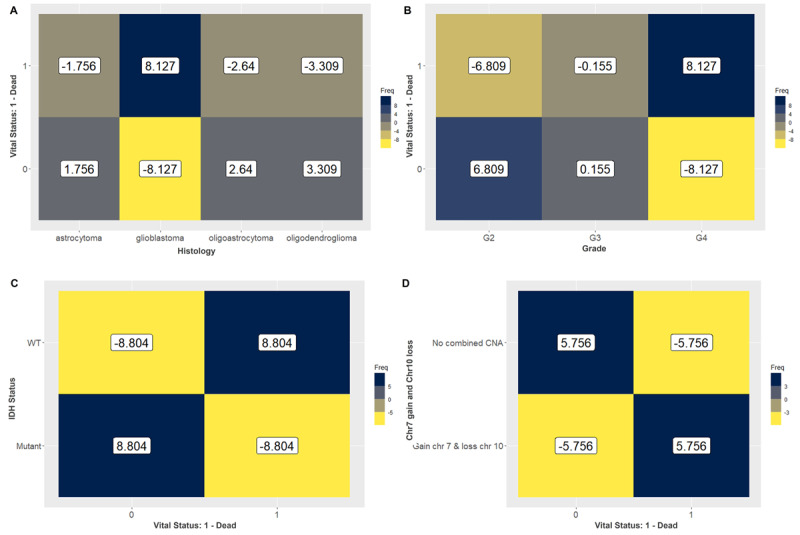 Figure 1
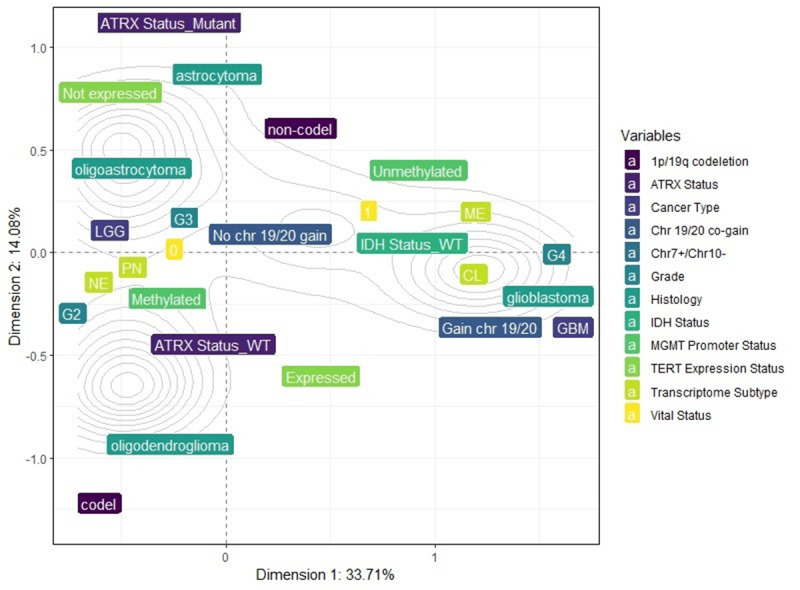 Figure 2
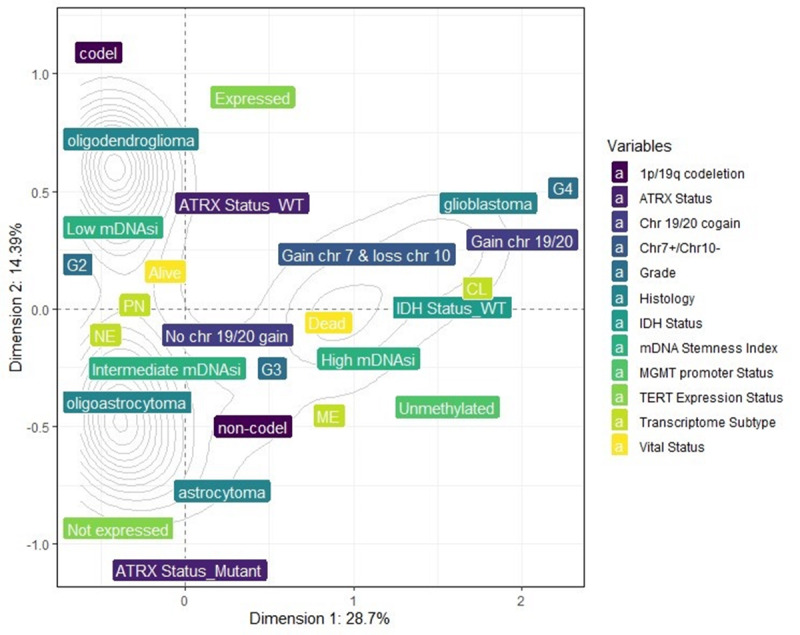 Figure 3
| Glioma variables | Patient vital status | Categories associated with | |
|---|---|---|---|
| Alive | Dead | ||
| Glioblastoma | — | 8.127 | Dead |
| Oligoastrocytoma | 2.64 |
| Alive |
| Oligodendroglioma | 3.309 |
| Alive |
| Astrocytoma | 1.756 |
| Not associated |
| Grade 2 | 6.809 |
| Alive |
| Grade 3 | 0.155 |
| Not associated |
| Grade 4 |
| 8.127 | Dead |
| IDH |
| 8.804 | Dead |
| IDH mutant | 8.804 |
| Alive |
| 1p/19q codeletion | 5.265 |
| Alive |
| 1p/19q non-codeletion |
| 5.265 | Dead |
| Methylated MGMT | 5.26 |
| Alive |
| Unmethylated MGMT promoter |
| 5.26 | Dead |
| No combined Chr7+/Chr10– | 5.756 |
| Alive |
| Chr7+/Chr10– |
| 5.756 | Dead |
| Not expressed TERT | 3.078 |
| Alive |
| Expressed TERT |
| 3.078 | Dead |
| ATRX | 2.311 |
| Alive |
| ATRX wild type |
| 2.311 | Dead |
| Proneural subtype | 4.122 |
| Alive |
| Neural subtype | 3.593 |
| Alive |
| Mesenchymal subtype |
| 4.635 | Dead |
| Classical subtype |
| 4.852 | Dead |
| Category | Dimension 1 (x-axis) | Dimension 2 (y-axis) |
|---|---|---|
| GBM | 1.6650830 | −0.0896760 |
| Low-grade glioma | −0.4723301 | 0.0254382 |
| Astrocytoma | −0.2672355 | 0.9527631 |
| Glioblastoma | 1.6650830 | −0.0896760 |
| Oligoastrocytoma | −0.5334711 | 0.3276318 |
| Oligodendroglioma | −0.6011671 | −0.9346433 |
| Grade 2 | −0.6611308 | −0.1971919 |
| Grade 3 | −0.2970898 | 0.2320783 |
| Grade 4 | 1.6650830 | −0.0896760 |
| 0-Alive | −0.3185609 | −0.0551369 |
| 1-Dead | 0.7544862 | 0.1305874 |
| IDH | −0.6734117 | −0.0548104 |
| IDH wild type | 1.1888626 | 0.0967641 |
| 1p/19q codel | −0.6877365 | −13.034.766 |
| 1p/19q non-codel | 0.2750946 | 0.5213906 |
| Methylated | −0.3429710 | −0.1087842 |
| Unmethylated | 1.0048449 | 0.3187185 |
| Chr7+/Chr10− | 1.4087248 | −0.0210234 |
| No combined Chr7+/Chr10− | −0.4205758 | 0.0062766 |
| Chr 19/20 co-gain | 1.4900007 | −0.1295089 |
| No Chr 19/20 co-gain | −0.0843397 | 0.0073307 |
| Expressed TERT | 0.3715020 | −0.6845760 |
| Not expressed TERT | −0.4690682 | 0.8643636 |
| ATRX | −0.6448249 | 1.0773395 |
| ATRX wild type | 0.2693572 | −0.4500279 |
| Classical | 1.2675815 | −0.0217510 |
| Mesenchymal | 1.0920361 | 0.2687642 |
| Neural | −0.5475482 | −0.0650952 |
| Proneural | −0.5971662 | −0.0604168 |
| Glioma Variables | mDNAsi | Categories associated with | ||
|---|---|---|---|---|
| Low | Intermediate | High | ||
| Glioblastoma | — | — | 8.507 | High |
| Oligoastrocytoma | — | — | — | Not associated |
| Oligodendroglioma | 3.949 | — | — | Low |
| Astrocytoma | — | — | 2.832 | High |
| G2 | 3.279 | 4.057 | — | Low and intermediate |
| G3 | — | — | 2.392 | High |
| G4 | — | — | 8.507 | High |
| IDH | — | — | 15.904 | High |
| IDH mutant | 8.743 | 7.057 | — | Low and intermediate |
| 1p/19q codeletion | 5.772 | 2.102 | — | Low and intermediate |
| 1p/19q non-codeletion | — | — | 7.964 | High |
| Methylated MGMT | 5.944 | 3.961 | — | Low and intermediate |
| Unmethylated MGMT promoter | — | — | 9.983 | High |
| No combined Chr7+/Chr10− | 6.436 | 5.927 | — | Low and intermediate |
| Chr7+/Chr10− | — | — | 12.433 | High |
| Not expressed TERT | — | 3.216 | — | Intermediate |
| Expressed TERT | — | — | 3.351 | High |
| ATRX | — | 3.505 | — | Intermediate |
| ATRX wild type | — | — | 4.949 | High |
| Proneural subtype | 8.476 | — | — | Low |
| Neural subtype | — | 4.218 | — | Intermediate |
| Mesenchymal subtype | — | — | 4.771 | High |
| Classical subtype | — | — | 10.981 | High |
Peer Reviews
No public reviews on file for this paper yet. If you reviewed it on a platform where reviews are public (OpenReview, ICLR, NeurIPS, ICML), you can paste yours below so the community can read it here.
Videos
No videos yet. Explain this paper in a talk, walkthrough, or lecture? Add one.
Taxonomy
TopicsRadiomics and Machine Learning in Medical Imaging · Glioma Diagnosis and Treatment · Brain Tumor Detection and Classification
Introduction
Cancer is a dynamic and heterogeneous disease characterized by several hallmarks controlling and contributing to its development and progression [1]. Cancer research continually generates large scales of data encompassing clinical information, genomic and transcriptomic profiles, prognostic and diagnostic markers, and therapeutic targets [2]. Different approaches have been used to study and associate all these variables to manage this complexity, aiming to reduce the dimensionality and enhance data interpretation and decision-making process. Several features used to study and classify the different types of cancer are based on categorical variables. For instance, the most widely used cancer staging system, TNM, is based on categorical variables, where “T” refers to the size of the primary tumor, “N” refers to the number of lymph nodes affected by cancer, and “M” refers to absence or presence of metastasis [3]. Thus, these biological and clinical variables interact, and their associations can be measured and diagnosticated using statistical tests such as Fisher exact tests and χ² tests. However, these approaches could not provide a global and comprehensive picture of the associations between these variables, particularly in datasets with a large number of categorical variables. Therefore, using multivariate and visual analysis methods can significantly improve the analysis and interpretation of associations between clinical and molecular cancer phenotypes.
Brain tumors are a particularly aggressive type of cancer, mostly due to local tissue damage and highly invasive growth. Gliomas, which originate from neuroglial stem cells or progenitor cells, account for 30% of primary brain tumors and 80% of malignant brain tumors [4]. This heterogeneous disease is histologically classified based on anaplasia criteria and predominant cell types such as oligodendroglioma, astrocytoma, and glioblastoma (GBM) [5]. Nevertheless, as further investigation aimed to elucidate the neuropathological mechanisms of gliomas, new variables are considered for characterizing this cancer tumor, leading to reclassifications based on mutational profiles, clinical data, and epigenetic factors [6]. This scenario resulted in different prognosis predictions, diagnosis determination, and treatment responses, contributing to an increasingly complex and stratified understanding of gliomas.
Stemness is a key phenotype of cancer stem cells (CSCs), related to tumor initiation and progression, therapy resistance, and metastasis [7]. CSCs are referred to as a subpopulation of tumor cells able to self-renew and differentiate into distinct cell lineages, enabling those cells to adapt to different environmental situations [8]. Moreover, recent studies have demonstrated associations between stemness features and different histologic classifications or prognostic factors of gliomas [9-11]. Therefore, providing a comprehensive visualization of the associations between clinical features and stemness in brain tumors could be valuable for identifying and determining potential prognostic and therapeutic markers.
Multiple correspondence analysis (MCA) is an unsupervised data science methodology that aims to observe and represent associations between variables disposed in contingency tables, visualizing these associations in a 2D perceptual map. This approach allows for the simultaneous visualization of the relationship between 2 or more characteristics [12]. MCA shares general characteristics, and it is an extension of principal component analysis which is effective in reducing data dimensionality. Thus, MCA can significantly reduce the workload and simplify statistical analysis in healthy research [13]. The results of MCA are typically interpreted in a 2D map, where the relative positions of categories of each variable and their distribution along the dimensions are analyzed. Categories that cluster together and are closer are more likely to be associated, providing key insights into the relationship [14]. Despite its applicability, rigor, and success in other disciplines such as Geography, Epidemiology, and Human Physiology, MCA remains underused in Oncology research and few studies are applying [1214-16undefinedundefined].
By using MCA, we aimed to gain a deeper understanding of the interdependence between stemness and prognostic factors. Our findings revealed associations among molecular and clinical characteristics and prognostic factors, as previously described by the literature [17]. Additionally, we demonstrated the capability of MCA to identify associations between stemness and these prognostic factors. Our results exhibited a strong association between higher stemness index and features related to poorer prognosis, demonstrating the utility of MCA as an analytical tool for elucidating oncological heterogeneity and may also offer a valuable strategy for therapeutic decision-making. This study highlights MCA as a powerful tool for overcoming the barrier of representing the heterogeneity and complexity of cancer variables, particularly in glioma.
Methods
Dataset of the Tumor Samples
Clinical and molecular information of a total of 448 patients with brain tumors was obtained from the Cancer Genome Atlas (TCGA). We tailored the dataset to contain only qualitative information, with 12 variables: cancer type, histology, grade, patient’s vital status, IDH (isocitrate dehydrogenase) status, codeletion of chromosomes 1p and 19q arms, MGMT (methylguanine methyltransferase) gene methylation, telomerase reverse transcriptase (TERT) expression, gain of chromosome 19 and 20, chromosome 7 gain and chromosome 10 loss, ATRX (alpha thalassemia/mental retardation syndrome, X-linked) status, and GBM transcriptome subtypes. All categorical variables were selected based on their established role as prognostic factors for brain tumors.
DNA Methylation Stemness Index
The DNA methylation stemness index (mDNAsi) based on DNA methylation was built using a one-class logistic regression [18] on the pluripotent stem cell samples (embryonic stem cell and induced pluripotent stem cell) from the Progenitor Cell Biology Consortium dataset [1920]. The algorithm was built and validated as described in the original paper [21]. The mDNAsi was applied in 381 samples from the TCGA database. Malta’s model presented a high correlation among other CSC signatures, providing significant insights into the biological and clinical features of pan-cancer. The workflow to generate the mDNAsi is available in the original paper [21].
Multiple Correspondence Analysis
MCAs were conducted in the RStudio (version 4.3.1; Posit, PBC) environment using the packages FactoMineR (version 2.11; Institut Agro) [22] and cabootcrs (version 2.1.0; Cranfield University), for creating matrices for MCAs. Contingency tables for the categorical variables were generated, and associations between variables were assessed using a χ² test with k degrees of freedom. This was followed by the analysis of the adjusted standardized residuals (ASRs). The χ² test evaluates whether the observed associations between categorical variables are nonrandomly associated (P value <.05). ASRs higher than 1.96 indicate a significant association between variables in the matrix. To perform MCA, the categorical variables should not be randomly associated. To create the perceptual map, inertia was determined as the total χ² divided by the number of samples, resulting in the number of associations in the dataset. MCA was performed based on the binary matrices and row and column profiles were determined to demonstrate the influence of each category of variables on the others. Matrices were defined based on the row and column profiles. Eigenvalues were then extracted to represent the number of dimensions that could be captured in the analysis. Finally, the x- and y-axis coordinates of the perceptual map were determined, allowing the category of the variables to be represented and established. In MCA, the spatial distance between categories of different variables reflects their associations. Categories with high coordinates that are close in space are directly associated, while categories presenting high coordinates but opposing coordinates are inversely associated.
Statistical Analysis
Fisher exact tests and χ² tests were performed using RStudio 4.3.1 environment and GraphPad Prism (version 10.3.0; Dotmatics, USA).
Ethical Considerations
The results published in this paper are in whole based upon data generated by the TCGA Research Network [23]. TCGA Ethics and Policies was originally published by the National Cancer Institute [24].
Results
MCA Can Identify Associations Between Different Variables of Gliomas and Patient Vital Status
To determine the suitability of glioma variables for MCA, we first evaluated whether categorical glioma variables were randomly or nonrandomly associated. This involved creating individual contingency tables for each pair of glioma variables (Multimedia Appendices 1-13). Then, we applied χ² tests for each contingency table to confirm nonrandom associations (P value <.05). We also confirmed the associations between categorical variables and patients’ vital status using the Fisher exact test (P value <.05) (Multimedia Appendix 14). Based on the χ² test, the results indicated that only 2 categorical variables, gender and DAXX expression, were randomly associated, suggesting no significant association patterns between these variables and the others. Consequently, gender and DAXX expression were excluded from further analysis.
In the subsequent analysis, we observed and measured the strength of associations between the patient vital status (0-alive; 1-dead) and different factors including cancer type, histology, grade, IDH status, 1p19q codeletion, MGMT promoter methylation, gain of chromosome (Chr) 7 and loss of Chr10 (7+/10–), co-gain of Chr19 and Chr20 (19+/20+), TERT expression, ATRX status, and transcriptome subtype, aiming to determine whether MCA could identify associations between prognostic factors for this disease. We used ASRs to assess these associations, considering a category of each variable to be associated with either alive or dead vital status when the ASR values were higher than 1.96. Patients’ vital status classified as dead were associated with poorer prognostics factors such as GBMs, grade 4, IDH wild type, non-codeleted 1p19q, unmethylated MGMT promoter, gain of Chr7 and loss of Chr10, expression of TERT, ATRX wild type, and classical (CL) and mesenchymal (ME) transcriptome subtypes (Table 1). In contrast, patients classified as alive were linked to favorable prognostic variables, including oligoastrocytomas and oligodendrogliomas, grade 2, IDH mutant, codeleted 1p19q, methylated MGMT promoter, absence of combined Chr7+/Chr10– (chromosome 7 gain and 10 loss), lack of TERT expression, ATRX mutant, and the proneural (PN) and neural (NE) transcriptome subtypes (Table 1). Histological classification, grade, IDH status, and Chr7+/Chr10– were the most strongly associated features with patient vital status. These associations were further illustrated in a heatmap (Figure 1A-D).
Heatmap exhibiting the values of the adjusted standardized residuals. Categories of variables with values higher than 1.96 are associated. We could observe a strong association of (A) glioblastoma (8.127), (B) grade 4 (8.127), (C) IDH wild type (8.804), and (D) Chr7+/Chr10– (5.756) with dead vital status. Favorable prognostic factors including (A) oligoastrocytoma and oligodendroglioma, (B) grade 2, (C) IDH mutant, and (D) no combined copy number alterations were associated with alive vital status. Chr7+/Chr10–: chromosome 7 gain and 10 loss; IDH: isocitrate dehydrogenase.
Using MCA, we observed that dimension 1 (x-axis) accounted for 33.71% of the variance, while dimension 2 (y-axis) accounted for 14.08%. The inertia (sum of the variances) for these 2 dimensions was 47.79%. The variance of the overall dimensions (17 dimensions) for the combinations of the variables is illustrated in Multimedia Appendix 15. The main idea was to present the percentage of explained variance for each dimension and not the influence of individual variables. The total inertia (sum of the variances) was 1.41.
The results obtained from the MCA were visualized in a 2D perceptual map (Figure 2), highlighting the associations between the categories of each variable. The coordinates of each category are detailed in Table 2. The perceptual map reveals that categories such as GBM, unmethylated MGMT promoter, IDH wild type, Chr7 gain and Chr10 loss, grade 4, GBM ATRX wild type, TERT expression, non-codel 1p.19q, and CL and ME transcriptome subtypes are closely associated with dead vital status, appearing along the positive x-axis (dimension 1). Conversely, categories like oligoastrocytomas and oligodendrogliomas, grade 2, IDH mutant, codel 1p19q, methylated MGMT promoter, no combined copy number alterations, no expression of TERT, ATRX mutant, and PN and NE transcriptome subtypes are closely associated with alive vital status, appearing along the negative x-axis (dimension 1) (Figure 2).
These findings highlight the utility and capacity of MCA in reducing data dimensionality and demonstrate that, in gliomas, variables interact cohesively. MCA allows us to further visualize these interactions on a global perceptual map, organizing the characteristics into distinct clusters that correspond to different prognostic profiles.
Multiple correspondence analysis (MCA) 2D perceptual map demonstrating the association between the categories of each categorical variable. Categories that are closely clustered are strongly associated with each other. Categories such as glioblastoma, unmethylated MGMT promoter, IDH wild type, chromosome 7 gain and 10 loss (Chr7+/Chr10–), grade 4, glioblastoma ATRX wild type, TERT expression, non-codel 1p.19q, CL and ME transcriptome subtypes are closely associated with dead vital status (1), appearing along the positive x-axis (dimension 1). ATRX: alpha thalassemia/mental retardation syndrome, X-linked; CL: classical; GBM: glioblastoma; IDH: isocitrate dehydrogenase; ME: mesenchymal; MGMT: methylguanine methyltransferase; NE: neural; PN: proneural; TERT: telomerase reverse transcriptase.
MCA Can Associate an Epigenetic Stemness Index (mDNAsi) as a Prognostic Factor in Gliomas
After demonstrating that MCA effectively reduces dimensionality and identifies associations between prognostic factors and clinical data in the glioma database, we proceeded to explore whether MCA could also associate these variables with stemness phenotype. For this analysis, we updated our database by including mDNAsi as a new variable, categorized into low, intermediate, and high levels of stemness. These categories were based on the DNA methylation index related to tumor pathology and clinical outcomes, as previously studied by [21].
First, we evaluated whether the categorical glioma variables were randomly or nonrandomly associated with mDNAsi by creating individual contingency tables for each pair of glioma variables and applying χ² tests (Multimedia Appendix 16). We also confirmed the associations between categorical variables using the Fisher exact test (P value <.05) ( Multimedia Appendix 17). All the variables were found to be suitable for MCA. Then, using ASR values to evaluate the strength of these associations, our results indicated strong associations between high mDNAsi levels and poor prognostic and clinical factors. Higher mDNAsi levels were associated with GBM, IDH wild-type, absence of 1p19q co-deletion, unmethylated MGMT promoter, TERT expression, grade 3 and 4, patient’s vital status as dead, Chr7+/Chr10–, chromosomes 19/20 co-gain, ATRX wildtype and ME and CL transcriptome subtypes (Table 3). Conversely, intermediate and lower levels of mDNAsi were associated with characteristics related to favorable prognosis, including oligodendroglioma, IDH mutant, 1p19q co-deletion, methylation of MGMT promoter, absence of TERT expression, grade 2, patient’s vital status as alive, no combined copy number alteration, absence of chromosomes 19/20 co-gain, ATRX mutant, and PN and NE transcriptome subtypes (Table 3).
Using MCA, dimension 1 (x-axis) accounted for 28.7% of the variance, while dimension 2 (y-axis) accounted for 14.39%. The inertia (sum of the variances) for these 2 dimensions was 43.09%. The variance of the overall dimensions (18 dimensions) for the combinations of the variables is illustrated in Multimedia Appendix 18. The total inertia (sum of the variances) was 1.5. The 2D perceptual map exhibited the associations between the categories of each variable (Figure 3). The perceptual map reveals categories such as GBM, unmethylated MGMT promoter, IDH wild type, Chr7 gain and Chr10 loss, grade 4, GBM ATRX wild type, TERT expression, non-codel 1p.19q, and CL and ME transcriptome subtypes are closely associated with high mDNAsi, appearing along the positive x-axis (dimension 1). Conversely, categories like oligoastrocytomas and oligodendrogliomas, grade 2, IDH mutant, codel 1p19q, methylated MGMT promoter, no combined copy number alterations, no expression of TERT, ATRX mutant, and PN and NE transcriptome subtypes are closely associated with alive vital status, appearing along the negative x-axis (dimension 1) (Figure 3).
Multiple correspondence analysis (MCA) 2D perceptual map demonstrating the association between the categories of each categorical variable. Categories that are closely clustered are strongly associated with each other. Categories such as glioblastoma, unmethylated MGMT promoter, IDH wild type, chromosome 7 gain and 10 loss (Chr7+/Chr10–), grade 4, glioblastoma ATRX wild type, TERT expression, non-codel 1p.19q, and CL and ME transcriptome subtypes are closely associated with high mDNAsi, appearing along the positive x-axis (dimension 1). ATRX: alpha thalassemia/mental retardation syndrome, X-linked; CL: classical; IDH: isocitrate dehydrogenase; mDNAsi: DNA methylation stemness index; ME: mesenchymal; MGMT: methylguanine methyltransferase; NE: neural; PN: proneural; TERT: telomerase reverse transcriptase.
Discussion
Principal Findings
Multiple efforts have been made to explore the diversity of oncologic diseases, with significant contributions from genetics, cell and tissue biology, as well as computational and experimental technologies, providing a wealth of information on cancer manifestations. In the field of glioma research, emerging approaches have sought to clarify tumor pathology and grading through the introduction of novel types and subtypes, as well as by identifying molecular markers and genetic mutations that contribute to predicting diagnosis and prognosis. However, it also results in an accumulation of extensive datasets, presenting challenges in interpretation and visualization regarding the associations between prognostic factors. In this study, we used MCA, an unsupervised data science approach, to establish statistical associations between different qualitative variables of gliomas. This method was able to reduce data dimensionality and represent it on a 2D perceptual map, revealing associations between various established glioma prognostic factors, including histological classification, IDH status, MGMT promoter methylation, and transcriptome subtypes. Furthermore, we associated these clinical and prognostic variables with an epigenetic-based stemness index (mDNAsi), demonstrating that higher stemness levels were associated with poorer prognostic factors, providing a useful tool to associate prognostic markers in brain tumors.
Comparison to Prior Studies
Several clinical and molecular factors are considered in predicting the prognosis and survival of brain tumors, more specifically for gliomas. Beyond histological classification and tumor grade, genetic and molecular biomarkers have been incorporated as potential prognostic indicators. Thus, we first evaluated the ability of MCA to associate these consolidated prognostic variables with the patient’s vital status. Our findings demonstrate that MCA effectively clusters poor prognostic factors with dead vital status. All these prognostic factors are well consolidated and associated with malignancy of gliomas. IDH mutation represents one of the main prognostic markers for gliomas [25]. It has been identified that one of the mechanisms given by this favorable outcome is the impaired production of nicotinamide adenine dinucleotide phosphate in Krebs cycle caused by IDH1 enzyme mutation that can sensitize tumor cells to chemotherapy and explain the favorable prognosis of patients with IDH mutation [25]. Likewise, co-deletion of 1p19q chromosome arms, especially when combined with other biomarkers such as IDH mutation and TERT expression, has been used as a predictive biomarker and recent studies investigated biological mechanisms to be significantly linked to genes involved in cell division, angiogenesis, and DNA repair responses [26]. Thus, we demonstrated that MCA was able to capture and associate key glioma hallmarks with patients’ vital status, which was applied to different clinical variables.
Subsequently, we applied MCA to explore the association between high stemness levels (mDNAsi) and characteristics related to poor prognosis. Stemness has been considered an important phenotype in glioma malignancy and is potentially associated with CL genetic alterations, such as the gain of chromosome 7. Chromosome 7 harbors some key genes related to stemness, including Epidermal Growth Factor Receptor (EGFR), Mesenchymal-Epithelial Transition Factor (MET), and Homeobox A gene (HOXA). A study of 86 GBMs reported that EGFR amplification occurs with higher probability in samples that have a gain of chromosome 7 (82.1%) compared with those without it (66.7%) [27]. In addition, EGFR amplification is more prevalent in IDH-wildtype diffuse gliomas (66.0%) and GBM (85.5%) [28], which are also associated with poorer prognostic factors, consistent with our findings. High mDNAsi has been previously linked to EGFR mutations [21]. The HOXA and MET loci, also located on chromosome 7, have been implicated in stemness-related pathways. Notably, studies have demonstrated interactions between chromosome 7 gain and the expression of a stem cell-related HOX signature in GBMs [29]. Analysis of the MET gene at 7q31.2 revealed that gain occurs in 47% of primary and 44% of secondary GBMs, suggesting that this genetic alteration contributes to the pathogenesis of both GBM subtypes [30].
Overall, relatively few studies have used MCA to explore associations with cancer phenotypes. Previous studies have applied MCA to different approaches, such as analyzing prognosis low rectal cancer surgery [31], investigating the association between some types of cancer in rural or urban areas [15], examining the association between Traditional Chinese Medicine Syndrome and histopathology of colorectal cancer [32], assessing clinically relevant demographic variables across multiple gastrointestinal cancers [33], and the relationship between types of diagnostic classification in breast cancer [34]. Our study also highlights the utility of MCA in investigating associations within the context of brain tumors. MCA enables the investigation of the pattern among many categorical factors in gliomas, providing a powerful computational approach to identify and test prognostic variables. It was possible to visually and quantitatively represent the associations, which facilitates the identification of distinct patient clusters based on shared prognostic characteristics. Our findings were consistent with previous literature and emphasized stemness as an important phenotype for gliomas.
Limitations
Our study has inherent limitations. First, as a retrospective analysis of TCGA data, it is subject to selection bias. Second, we associated all the prognostic variables with patients’ vital status, which may not be the most optimal variable for determining prognosis. For the future, we intend to improve our model validating its applicability in other prospective datasets. Third, the absence of therapy data is another limitation of this study. Finally, an intrinsic limitation of MCA is that retaining only 2 or 3 dimensions may not sufficiently capture all the significant features in the data. In our analysis, the percentage of explained inertia was approximately 40%. While there is not an accepted threshold for adequately explained inertia, common guidelines recommend retaining dimensions that represent over 70% of the inertia [35]. However, explained inertia in the range of 40%‐60% is often considered informative, and the interpretability and relevance of the patterns revealed by the dimensions are frequently more important than the exact percentage of inertia explained, especially in a complex heterogeneous disease such as brain tumors [36].
Conclusion and Future Perspectives
In conclusion, our findings suggest that MCA is a valuable tool for understanding the interdependence between prognostic markers in gliomas. MCA facilitates the exploration of a large-scale dataset and enhances the identification of associations. Considering the advances in computational oncology and the emergence of new oncological features, such as stemness phenotype, incorporating MCA into cancer research as an approach to exploring the complex heterogeneity of the oncologic field becomes a powerful tool for simplifying data management. It contributes to researchers statistically identifying associations between variables within extensive databases and improves the visual representation, leading to a deeper understanding of cancer findings.
Supplementary material
10.2196/65645Multimedia Appendix 1Individual contingency tables for cancer type.
10.2196/65645Multimedia Appendix 2Individual contingency tables for histology.
10.2196/65645Multimedia Appendix 3Individual contingency tables for grade.
10.2196/65645Multimedia Appendix 4Individual contingency tables for gender.
10.2196/65645Multimedia Appendix 5Individual contingency tables for vital status.
10.2196/65645Multimedia Appendix 6Individual contingency tables for IDH (isocitrate dehydrogenase) status.
10.2196/65645Multimedia Appendix 7Individual contingency tables for X1p.19q.codeletion.
10.2196/65645Multimedia Appendix 8Individual contingency tables for MGMT (methylguanine methyltransferase) promoter.
10.2196/65645Multimedia Appendix 9Individual contingency tables for Chr 7 gain and Chr 10 loss.
10.2196/65645Multimedia Appendix 10Individual contingency tables for Chr 19/20 co-gain.
10.2196/65645Multimedia Appendix 11Individual contingency tables for TERT (telomerase reverse transcriptase) expression status.
10.2196/65645Multimedia Appendix 12Individual contingency tables for ATRX (Alpha Thalassemia/Mental Retardation Syndrome X-linkedalpha thalassemia/mental retardation syndrome, X-linked) status.
10.2196/65645Multimedia Appendix 13Individual contingency tables for DAXX status.
10.2196/65645Multimedia Appendix 14Fisher exact test and χ² test for vital status × glioma prognostic factors.
10.2196/65645Multimedia Appendix 15Percentage of explained variances of the overall (17) dimensions.
10.2196/65645Multimedia Appendix 16Individual contingency table for mDNAsi.
10.2196/65645Multimedia Appendix 17Fisher exact test and χ² test for mDNAsi (DNA methylation stemness index) × glioma prognostic factors.
10.2196/65645Multimedia Appendix 18Percentage of explained variances of the overall (18) dimensions.
The reference list from the paper itself. Each links out to its DOI / PubMed record.
- 1Hanahan D Hallmarks of cancer: new dimensions Cancer Discov 0120221213146 doi 10.1158/2159-8290.CD-21-1059 Medline 35022204 · doi ↗ · pubmed ↗
- 2Dagogo-Jack I Shaw AT Tumour heterogeneity and resistance to cancer therapies Nat Rev Clin Oncol Feb 20181528194 doi 10.1038/nrclinonc.2017.166Medline 29115304 · doi ↗ · pubmed ↗
- 3Brierley J O’Sullivan B Asamura H et al Global consultation on cancer staging: promoting consistent understanding and use Nat Rev Clin Oncol Dec 20191612763771 doi 10.1038/s 41571-019-0253-x Medline 31388125 PMC 7136160 · doi ↗ · pubmed ↗
- 4Weller M Wick W Aldape K et al Glioma Nat Rev Dis Primers 07162015115017 doi 10.1038/nrdp.2015.17Medline 27188790 · doi ↗ · pubmed ↗
- 5Louis DN Ohgaki H Wiestler OD et al The 2007 WHO classification of tumours of the central nervous system Acta Neuropathol Aug 2007114297109 doi 10.1007/s 00401-007-0243-4Medline 17618441 PMC 1929165 · doi ↗ · pubmed ↗
- 6Louis DN Perry A Wesseling P et al The 2021 WHO classification of tumors of the central nervous system: a summary Neuro Oncol Aug 2202123812311251 doi 10.1093/neuonc/noab 106Medline 34185076 PMC 8328013 · doi ↗ · pubmed ↗
- 7Ayob AZ Ramasamy TS Cancer stem cells as key drivers of tumour progression J Biomed Sci Mar 6201825120 doi 10.1186/s 12929-018-0426-4Medline 29506506 PMC 5838954 · doi ↗ · pubmed ↗
- 8Batlle E Clevers H Cancer stem cells revisited Nat Med Oct 62017231011241134 doi 10.1038/nm.4409 Medline 28985214 · doi ↗ · pubmed ↗