Two‐Sample Mendelian Randomization Analyses Identified Lipid Species Associated With Intracranial Aneurysm Formation
Junqing Yan

TL;DR
This study finds specific lipid types that are linked to the formation of unruptured brain aneurysms, which could help in assessing risk and developing treatments.
Contribution
The study identifies novel lipid species with causal links to unruptured intracranial aneurysms using Mendelian randomization.
Findings
Seven lipid species were found to be associated with unruptured intracranial aneurysms.
Some lipids act as risk factors, while others show protective effects against aneurysm formation.
Reverse MR analysis found no bidirectional causal relationships between lipids and aneurysms.
Abstract
Intracranial aneurysm (IA) poses a significant health risk, and its formation involves various factors, including lipid metabolism, while former research only focused on the standard lipid. The purpose of this study is to explore 179 lipid variants' impact on unruptured intracranial aneurysms (uIA). Utilizing GWAS data for lipids and uIAs, MR analyses were employed with pleiotropy, heterogeneity, and sensitivity tests. Reverse MR analyses were then conducted. MR analyses revealed seven lipids associated with uIAs: TAG (51:3). SE (27:1/16:1), PC (18:2_18:2), TAG (48:1), TAG (48:2), and TAG (51:3) were identified as uIA risk factors, while SE (27:1/18:1) and SM (d34:0) exhibited protective effects. Reverse MR analysis showed no bidirectional causal relationships. This study identifies specific lipid variants causally linked to uIAs, shedding light on their roles in IA formation. These…
Genes, proteins, chemicals, diseases, species, mutations and cell lines named across the full text — each resolved to its canonical identifier and authoritative record.
Click any figure to enlarge with its caption.
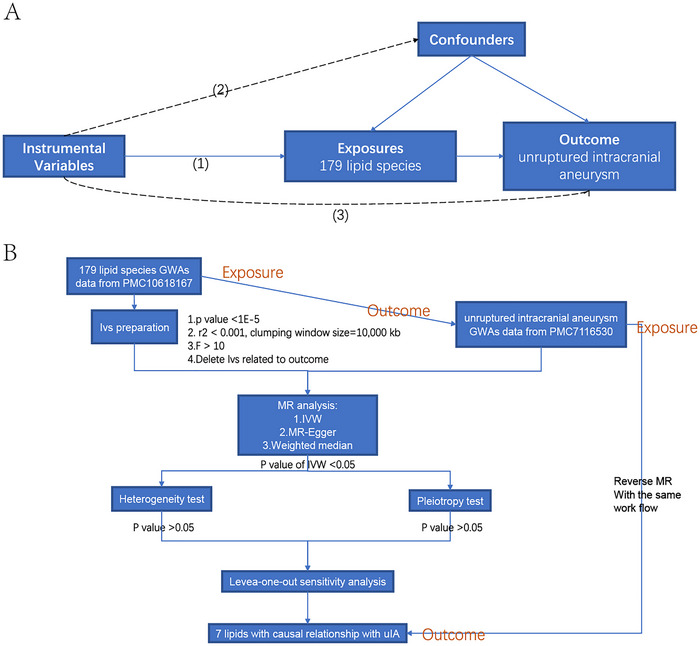 FIGURE 1
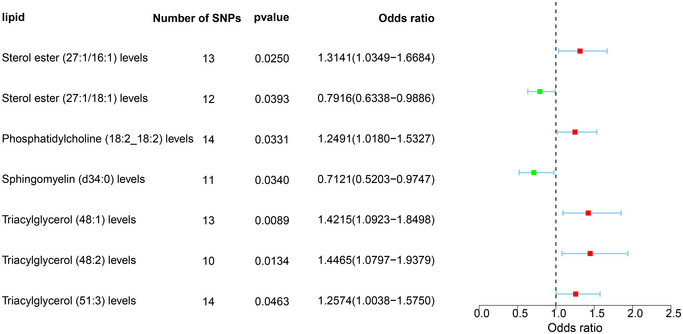 FIGURE 2
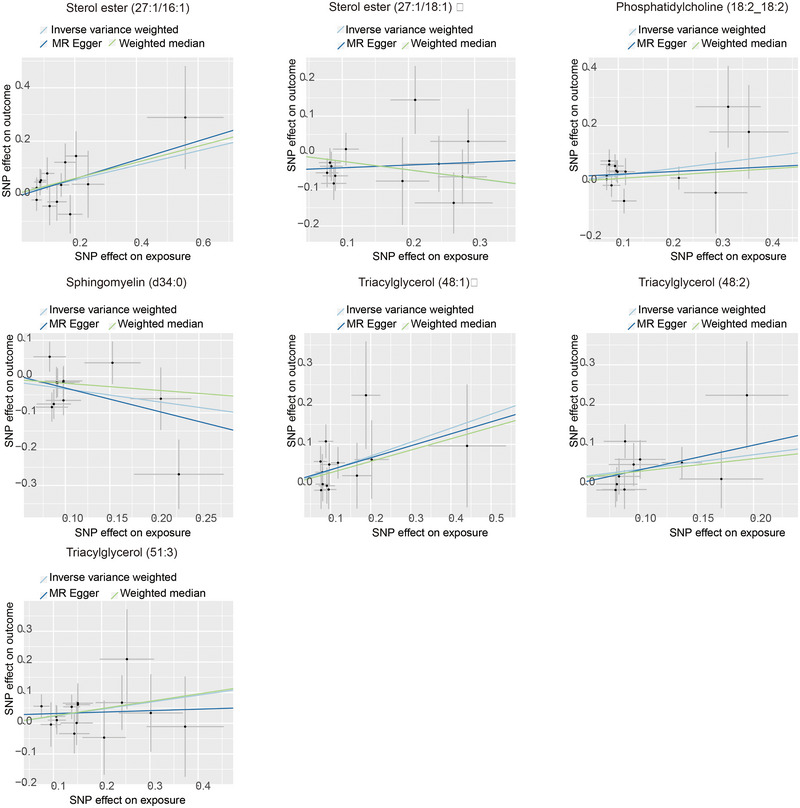 FIGURE 3
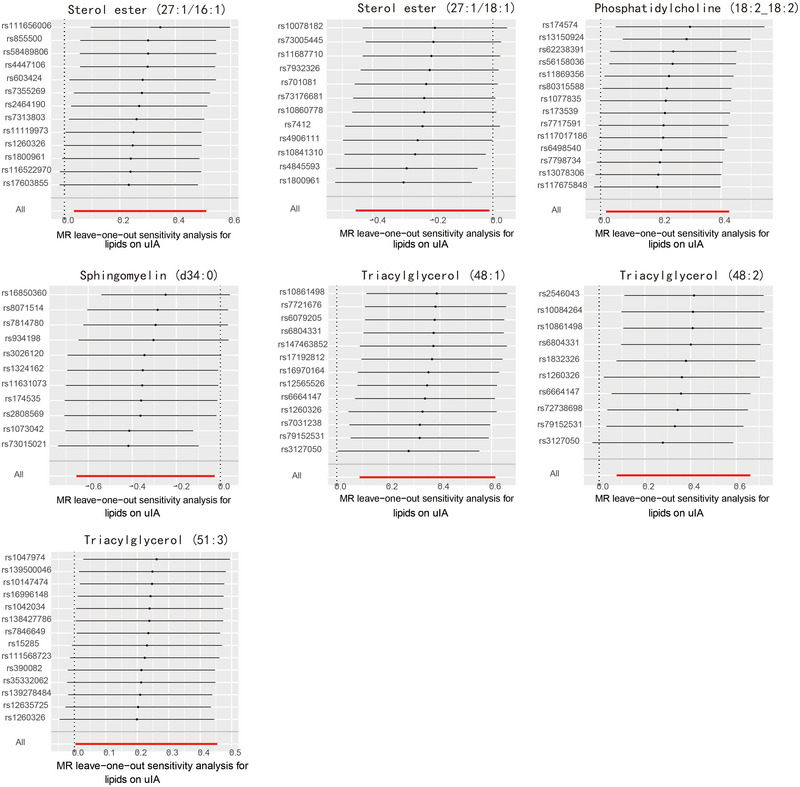 FIGURE 4
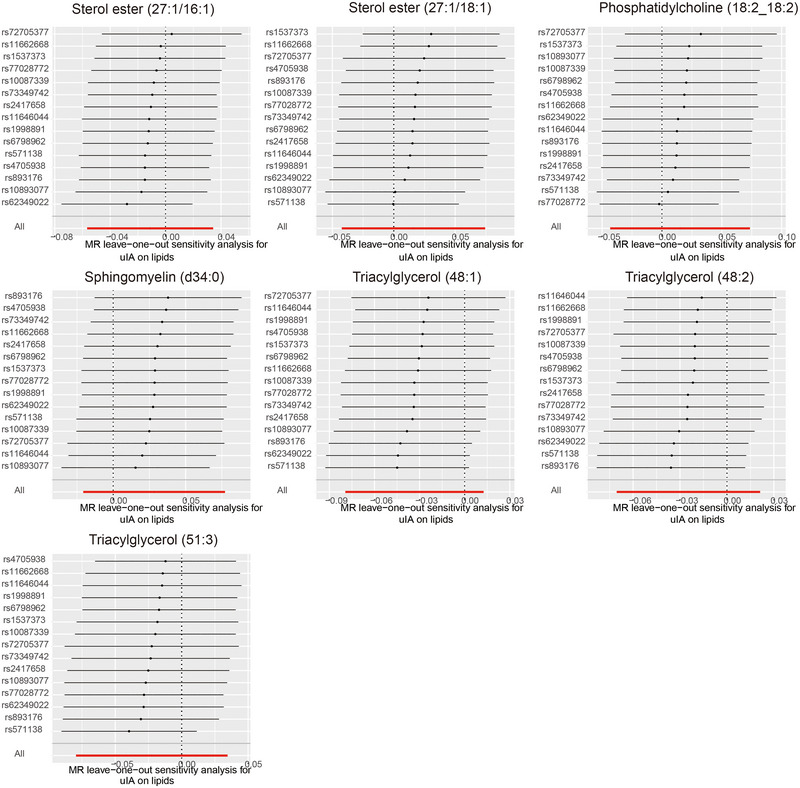 FIGURE 5
| Lipid | Method | nsnp |
| SE |
| lo_ci | up_ci | OR | OR_lci95 | OR_uci95 |
|
|
|---|---|---|---|---|---|---|---|---|---|---|---|---|
| Sterol ester (27:1/16:1) | Inverse variance weighted | 13 | 0.27311567 | 0.12182052 | 0.02496452 | 0.03434745 | 0.51188388 | 1.31405223 | 1.03494414 | 1.66843136 | 0.61905496 | 0.762075658 |
| MR‐Egger | 13 | 0.35302978 | 0.28483886 | 0.24098861 | −0.2052544 | 0.91131395 | 1.42337353 | 0.81444011 | 2.48758896 | 0.542262508 | ||
| Weighted median | 13 | 0.30191559 | 0.1656036 | 0.06828489 | −0.0226675 | 0.62649864 | 1.35244706 | 0.97758752 | 1.87104788 | |||
| Sterol ester (27:1/18:1) | Inverse variance weighted | 12 | −0.2337532 | 0.11339833 | 0.03927007 | −0.4560139 | −0.0114924 | 0.79155718 | 0.63380504 | 0.98857336 | 0.4194889 | 0.146435665 |
| MR‐Egger | 12 | 0.07451407 | 0.22552471 | 0.74791335 | −0.3675144 | 0.51654249 | 1.0773605 | 0.69245339 | 1.67622207 | 0.550376559 | ||
| Weighted median | 12 | −0.2318063 | 0.16129725 | 0.15067897 | −0.5479489 | 0.08433631 | 0.79309972 | 0.57813439 | 1.08799473 | |||
| Phosphatidylcholine (18:2_18:2) | Inverse variance weighted | 14 | 0.22245343 | 0.10437085 | 0.03305825 | 0.01788656 | 0.42702029 | 1.24913764 | 1.01804749 | 1.53268376 | 0.47181124 | 0.565471847 |
| MR‐Egger | 14 | 0.08830073 | 0.25043574 | 0.73051238 | −0.4025533 | 0.57915478 | 1.09231657 | 0.66861069 | 1.78452948 | 0.419259942 | ||
| Weighted median | 14 | 0.11346516 | 0.14452744 | 0.43240845 | −0.1698086 | 0.39673893 | 1.12015286 | 0.8438263 | 1.48696768 | |||
| Sphingomyelin (d34:0) | Inverse variance weighted | 11 | −0.3395189 | 0.16014051 | 0.03399497 | −0.6533943 | −0.0256435 | 0.71211283 | 0.52027679 | 0.97468249 | 0.136447755 | 0.635896397 |
| MR‐Egger | 11 | −0.6151872 | 0.58680091 | 0.32180243 | −1.765317 | 0.53494259 | 0.5405397 | 0.17113253 | 1.70735023 | 0.10578214 | ||
| Weighted median | 11 | −0.1852536 | 0.18719284 | 0.32235003 | −0.5521515 | 0.18164442 | 0.83089358 | 0.57570982 | 1.19918771 | |||
| Triacylglycerol (48:1) | Inverse variance weighted | 13 | 0.35168041 | 0.1343958 | 0.00887709 | 0.08826465 | 0.61509617 | 1.42145417 | 1.09227716 | 1.84983449 | 0.741592836 | 0.877826065 |
| MR‐Egger | 13 | 0.30160055 | 0.34549716 | 0.40134661 | −0.3755739 | 0.97877498 | 1.35202106 | 0.68689497 | 2.66119424 | 0.666491067 | ||
| Weighted median | 13 | 0.28499869 | 0.17973416 | 0.11281466 | −0.0672803 | 0.63727764 | 1.32976028 | 0.93493314 | 1.89132499 | |||
| Triacylglycerol (48:2) | Inverse variance weighted | 10 | 0.36914213 | 0.14922402 | 0.01337052 | 0.07666306 | 0.66162121 | 1.44649318 | 1.07967822 | 1.93793158 | 0.568789918 | 0.651940704 |
| MR‐Egger | 10 | 0.62913727 | 0.57468717 | 0.30548918 | −0.4972496 | 1.75552411 | 1.8759914 | 0.60820117 | 5.78647971 | 0.489983389 | ||
| Weighted median | 10 | 0.31876718 | 0.20786652 | 0.12514813 | −0.0886512 | 0.72618556 | 1.37543106 | 0.91516472 | 2.06718042 | |||
| Triacylglycerol (51:3) | Inverse variance weighted | 14 | 0.22901092 | 0.1149198 | 0.04628454 | 0.00376812 | 0.45425372 | 1.25735577 | 1.00377523 | 1.57499756 | 0.97287093 | 0.554358558 |
| MR‐Egger | 14 | 0.04803179 | 0.31896135 | 0.88280231 | −0.5771325 | 0.67319603 | 1.04920401 | 0.5615062 | 1.96049312 | 0.966326309 | ||
| Weighted median | 14 | 0.23930311 | 0.14981931 | 0.11020371 | −0.0543427 | 0.53294895 | 1.27036353 | 0.94710745 | 1.70394976 |
| Lipid | SNP |
| SE | Sample size |
|
|
|
|---|---|---|---|---|---|---|---|
| Sterol ester (27:1/16:1) | rs11119973 | 0.110738 | 0.0231985 | 7172 | 1.84338e−06 | 0.00316706 | 22.7799317 |
| rs111656006 | 0.185117 | 0.0400311 | 7172 | 3.81832e−06 | 0.00297279 | 21.3784608 | |
| rs116522970 | 0.55842 | 0.12419 | 7172 | 7.01117e−06 | 0.00281116 | 20.2128498 | |
| rs1260326 | −0.0904035 | 0.0174668 | 7172 | 2.32931e−07 | 0.00372121 | 26.7807459 | |
| rs17603855 | 0.169155 | 0.0356528 | 7172 | 2.1289e−06 | 0.00312882 | 22.5040803 | |
| rs1800961 | −0.204194 | 0.0372477 | 7172 | 4.34267e−08 | 0.00417283 | 30.044564 | |
| rs2464190 | 0.0764228 | 0.0167672 | 7172 | 5.24998e−06 | 0.00288821 | 20.7684304 | |
| rs4447106 | 0.118474 | 0.0242138 | 7172 | 1.01459e−06 | 0.00332685 | 23.9331067 | |
| rs58489806 | −0.142087 | 0.0315082 | 7172 | 6.59485e−06 | 0.00282743 | 20.3301404 | |
| rs603424 | −0.155845 | 0.0259739 | 7172 | 2.06545e−09 | 0.00499455 | 35.9907 | |
| rs7313803 | 0.0873092 | 0.0194117 | 7172 | 6.96926e−06 | 0.00281274 | 20.2242186 | |
| rs7355269 | 0.243229 | 0.0529062 | 7172 | 4.35121e−06 | 0.00293832 | 21.1298515 | |
| rs855500 | 0.0761958 | 0.0168529 | 7172 | 6.24211e−06 | 0.00284208 | 20.4358005 | |
| Sterol ester (27:1/18:1) | rs10078182 | 0.268326 | 0.0586987 | 7174 | 4.92541e−06 | 0.00290432 | 20.8904337 |
| rs10841310 | −0.105591 | 0.019433 | 7174 | 5.69845e−08 | 0.00409854 | 29.5156949 | |
| rs10860778 | −0.0815118 | 0.0167481 | 7174 | 1.15667e−06 | 0.00329092 | 23.6803864 | |
| rs11687710 | 0.08949 | 0.0191687 | 7174 | 3.08593e−06 | 0.0030289 | 21.7892661 | |
| rs1800961 | −0.21016 | 0.037228 | 7174 | 1.71172e−08 | 0.00442257 | 31.8595486 | |
| rs4845593 | −0.290262 | 0.0571029 | 7174 | 3.80059e−07 | 0.00358873 | 25.8311027 | |
| rs4906111 | −0.245889 | 0.0540683 | 7174 | 5.50919e−06 | 0.00287462 | 20.6762455 | |
| rs701081 | −0.0836375 | 0.0171434 | 7174 | 1.08975e−06 | 0.0033068 | 23.795075 | |
| rs73005445 | −0.087242 | 0.0191832 | 7174 | 5.50635e−06 | 0.00287473 | 20.6770237 | |
| rs73176681 | 0.191002 | 0.0404108 | 7174 | 2.32683e−06 | 0.00310434 | 22.333657 | |
| rs7412 | −0.281493 | 0.0371564 | 7174 | 4.00681e−14 | 0.00793681 | 57.3781906 | |
| rs7932326 | 0.0772058 | 0.0171159 | 7174 | 6.55748e−06 | 0.00282819 | 20.3413271 | |
| Phosphatidylcholine (18:2_18:2) | rs1077835 | 0.114534 | 0.019222 | 7174 | 2.6626e−09 | 0.00492455 | 35.4936465 |
| rs117017186 | 0.362427 | 0.0795703 | 7174 | 5.32894e−06 | 0.00288352 | 20.7404419 | |
| rs117675848 | 0.320882 | 0.0654187 | 7174 | 9.53745e−07 | 0.0033425 | 24.0528089 | |
| rs11869356 | −0.0766319 | 0.0171208 | 7174 | 7.72162e−06 | 0.00278483 | 20.0285721 | |
| rs13078306 | −0.0818989 | 0.0176422 | 7174 | 3.50558e−06 | 0.00299493 | 21.5441599 | |
| rs13150924 | −0.111583 | 0.0250095 | 7174 | 8.25191e−06 | 0.00276708 | 19.9005444 | |
| rs173539 | 0.0984345 | 0.0184699 | 7174 | 1.01409e−07 | 0.00394356 | 28.3951717 | |
| rs174574 | −0.22178 | 0.0168521 | 7174 | 4.16328e−39 | 0.02357301 | 173.147255 | |
| rs56158036 | 0.295692 | 0.0637559 | 7174 | 3.57995e−06 | 0.00298935 | 21.5039032 | |
| rs62238391 | 0.0863635 | 0.017876 | 7174 | 1.38372e−06 | 0.00324301 | 23.33451 | |
| rs6498540 | 0.0934402 | 0.0177453 | 7174 | 1.43628e−07 | 0.00385003 | 27.7191389 | |
| rs7717591 | −0.095992 | 0.0178967 | 7174 | 8.4065e−08 | 0.00399415 | 28.7609398 | |
| rs7798734 | −0.081769 | 0.0176579 | 7174 | 3.70478e−06 | 0.00298017 | 21.4376993 | |
| rs80315588 | −0.0767847 | 0.0168318 | 7174 | 5.15184e−06 | 0.00289247 | 20.8049735 | |
| Sphingomyelin (d34:0) | rs1073042 | −0.0823051 | 0.0182851 | 6207 | 6.87365e−06 | 0.00325358 | 20.2543754 |
| rs11631073 | −0.0911807 | 0.0186999 | 6207 | 1.1084e−06 | 0.0038158 | 23.7677087 | |
| rs1324162 | 0.0899835 | 0.0201129 | 6207 | 7.81063e−06 | 0.00321437 | 20.0095082 | |
| rs16850360 | 0.227483 | 0.0504095 | 6207 | 6.51148e−06 | 0.00327016 | 20.3579084 | |
| rs174535 | −0.0976311 | 0.0183889 | 6207 | 1.13756e−07 | 0.0045208 | 28.1789563 | |
| rs2808569 | −0.0978734 | 0.0210823 | 6207 | 3.50945e−06 | 0.00346024 | 21.545343 | |
| rs3026120 | −0.207247 | 0.0341995 | 6207 | 1.43923e−09 | 0.00588157 | 36.7110691 | |
| rs73015021 | −0.15289 | 0.0315851 | 6207 | 1.32465e−06 | 0.00376076 | 23.4236025 | |
| rs7814780 | −0.0869509 | 0.0192999 | 6207 | 6.74575e−06 | 0.00325941 | 20.2907494 | |
| rs8071514 | 0.0848261 | 0.0180916 | 6207 | 2.80367e−06 | 0.00352929 | 21.9768319 | |
| rs934198 | 0.0978059 | 0.0198357 | 6207 | 8.3951e−07 | 0.00390171 | 24.3049698 | |
| Triacylglycerol (48:1) | rs10861498 | −0.0952476 | 0.019381 | 7019 | 9.09524e−07 | 0.00342917 | 24.1452637 |
| rs12565526 | 0.0795461 | 0.0175846 | 7019 | 6.17408e−06 | 0.00290692 | 20.4573337 | |
| rs1260326 | −0.118511 | 0.0176221 | 7019 | 1.88871e−11 | 0.00640232 | 45.2145525 | |
| rs147463852 | −0.440217 | 0.096887 | 7019 | 5.61791e−06 | 0.00293259 | 20.6385336 | |
| rs16970164 | −0.202438 | 0.0425919 | 7019 | 2.04282e−06 | 0.00320818 | 22.5842817 | |
| rs17192812 | 0.165787 | 0.0366097 | 7019 | 6.03367e−06 | 0.00291317 | 20.5014623 | |
| rs3127050 | 0.0882816 | 0.018625 | 7019 | 2.17713e−06 | 0.00319069 | 22.4607401 | |
| rs6079205 | −0.0765162 | 0.0172598 | 7019 | 9.41841e−06 | 0.00279219 | 19.6476903 | |
| rs6664147 | −0.0967534 | 0.0216447 | 7019 | 7.93696e−06 | 0.0028387 | 19.9758636 | |
| rs6804331 | −0.0803188 | 0.0180013 | 7019 | 8.24665e−06 | 0.00282827 | 19.9022839 | |
| rs7031238 | 0.0750969 | 0.0168493 | 7019 | 8.43547e−06 | 0.00282213 | 19.8589612 | |
| rs7721676 | −0.0907963 | 0.0204262 | 7019 | 8.91782e−06 | 0.00280715 | 19.7531962 | |
| rs79152531 | −0.188193 | 0.0360273 | 7019 | 1.80354e−07 | 0.00387243 | 27.2784527 | |
| Triacylglycerol (48:2) | rs10084264 | 0.172089 | 0.0363614 | 7071 | 2.25621e−06 | 0.0031577 | 22.3924789 |
| rs10861498 | −0.0879739 | 0.0192951 | 7071 | 5.21205e−06 | 0.00293128 | 20.782164 | |
| rs1260326 | −0.137885 | 0.0175462 | 7071 | 4.45849e−15 | 0.00865786 | 61.7369316 | |
| rs1832326 | 0.0832489 | 0.0187957 | 7071 | 9.59737e−06 | 0.00276666 | 19.6117859 | |
| rs2546043 | −0.0802241 | 0.0167299 | 7071 | 1.65631e−06 | 0.0032414 | 22.9879456 | |
| rs3127050 | 0.0885169 | 0.0185552 | 7071 | 1.87213e−06 | 0.00320808 | 22.750883 | |
| rs6664147 | −0.0959268 | 0.0215573 | 7071 | 8.71861e−06 | 0.00279252 | 19.7955844 | |
| rs6804331 | −0.081343 | 0.0179395 | 7071 | 5.86932e−06 | 0.0028992 | 20.5540234 | |
| rs72738698 | 0.101596 | 0.0220537 | 7071 | 4.15883e−06 | 0.00299232 | 21.2161921 | |
| rs79152531 | −0.194281 | 0.0359655 | 7071 | 6.80166e−08 | 0.00410978 | 29.1719594 | |
| Triacylglycerol (51:3) | rs10147474 | −0.205161 | 0.0449078 | 7119 | 4.9914e−06 | 0.00292318 | 20.8652709 |
| rs1042034 | 0.107098 | 0.0186743 | 7119 | 1.01247e−08 | 0.00459889 | 32.8815311 | |
| rs1047974 | 0.143421 | 0.0316816 | 7119 | 6.0771e−06 | 0.00287041 | 20.4875135 | |
| rs111568723 | 0.242108 | 0.0546607 | 7119 | 9.58185e−06 | 0.00274823 | 19.6130834 | |
| rs1260326 | −0.13791 | 0.0174639 | 7119 | 3.27832e−15 | 0.00868365 | 62.3429025 | |
| rs12635725 | 0.0753128 | 0.0167629 | 7119 | 7.13444e−06 | 0.00282742 | 20.1798184 | |
| rs138427786 | 0.301941 | 0.0665321 | 7119 | 5.76122e−06 | 0.00288475 | 20.5901584 | |
| rs139278484 | 0.252416 | 0.0563323 | 7119 | 7.53858e−06 | 0.0028124 | 20.0722828 | |
| rs139500046 | −0.37314 | 0.0798691 | 7119 | 3.03631e−06 | 0.00305659 | 21.8204652 | |
| rs15285 | −0.105751 | 0.0189806 | 7119 | 2.61547e−08 | 0.00434151 | 31.033236 | |
| rs16996148 | −0.148112 | 0.0334981 | 7119 | 9.93836e−06 | 0.00273861 | 19.5442098 | |
| rs35332062 | −0.150726 | 0.0254703 | 7119 | 3.41151e−09 | 0.00489506 | 35.0095235 | |
| rs390082 | 0.150707 | 0.0313089 | 7119 | 1.51269e−06 | 0.00324415 | 23.1637678 | |
| rs7846649 | 0.0948767 | 0.0212506 | 7119 | 8.1378e−06 | 0.00279218 | 19.9275873 |
| Lipid | Method | nsnp |
| SE |
| lo_ci | up_ci | OR | OR_lci95 | OR_uci95 |
|
|
|---|---|---|---|---|---|---|---|---|---|---|---|---|
| Sterol ester (27:1/16:1) | Inverse variance weighted | 15 | −0.0111488 | 0.02320979 | 0.63097773 | −0.05664 | 0.03434233 | 0.98891307 | 0.94493416 | 1.03493884 | 0.476912826 | 0.467332845 |
| MR‐Egger | 15 | −0.0621994 | 0.07204397 | 0.40359054 | −0.2034056 | 0.07900674 | 0.93969545 | 0.8159472 | 1.08221162 | 0.442002712 | ||
| Weighted median | 15 | −0.0130895 | 0.03310102 | 0.69251794 | −0.0779675 | 0.05178852 | 0.98699582 | 0.92499451 | 1.053153 | |||
| Sterol ester (27:1/18:1) | Inverse variance weighted | 15 | 0.01605737 | 0.02979205 | 0.58989945 | −0.0423351 | 0.0744498 | 1.01618699 | 0.95854856 | 1.07729126 | 0.058509544 | 0.937617013 |
| MR‐Egger | 15 | 0.02328463 | 0.09570366 | 0.81157052 | −0.1642945 | 0.2108638 | 1.02355784 | 0.84849208 | 1.23474417 | 0.040511803 | ||
| Weighted median | 15 | −0.0073018 | 0.03345764 | 0.82724124 | −0.0728788 | 0.05827513 | 0.99272476 | 0.92971351 | 1.0600066 | |||
| Phosphatidylcholine (18:2_18:2) | Inverse variance weighted | 15 | 0.01513174 | 0.02977265 | 0.611283 | −0.0432227 | 0.07348613 | 1.0152468 | 0.95769813 | 1.07625361 | 0.059329482 | 0.832808868 |
| MR‐Egger | 15 | 0.03458989 | 0.09546036 | 0.72291435 | −0.1525124 | 0.2216922 | 1.03519508 | 0.85854823 | 1.24818712 | 0.041962848 | ||
| Weighted median | 15 | −0.0392082 | 0.03436573 | 0.25390795 | −0.106565 | 0.02814868 | 0.96155053 | 0.89891662 | 1.02854859 | |||
| Sphingomyelin (d34:0) | Inverse variance weighted | 15 | 0.02823919 | 0.02494714 | 0.25765083 | −0.0206572 | 0.07713559 | 1.0286417 | 0.97955469 | 1.08018853 | 0.548985476 | 0.856623974 |
| MR‐Egger | 15 | 0.04169092 | 0.07713488 | 0.59799539 | −0.1094934 | 0.19287528 | 1.04257219 | 0.89628805 | 1.21273153 | 0.472648918 | ||
| Weighted median | 15 | 0.03776757 | 0.03525381 | 0.28403244 | −0.0313299 | 0.10686504 | 1.03848983 | 0.9691558 | 1.11278406 | |||
| Triacylglycerol (48:1) | Inverse variance weighted | 15 | −0.0334031 | 0.02346 | 0.15449563 | −0.0793847 | 0.01257854 | 0.96714866 | 0.92368455 | 1.01265799 | 0.462430251 | 0.353077668 |
| MR‐Egger | 15 | 0.0327216 | 0.0725565 | 0.65943385 | −0.1094891 | 0.17493233 | 1.03326283 | 0.8962919 | 1.1911656 | 0.455351514 | ||
| Weighted median | 15 | −0.0477989 | 0.03367784 | 0.15581202 | −0.1138075 | 0.01820966 | 0.95332548 | 0.89242976 | 1.01837647 | |||
| Triacylglycerol (48:2) | Inverse variance weighted | 15 | −0.0246066 | 0.02338199 | 0.29262771 | −0.0704353 | 0.02122208 | 0.97569367 | 0.93198804 | 1.02144887 | 0.45914209 | 0.172845623 |
| MR‐Egger | 15 | 0.07416298 | 0.0723576 | 0.32408123 | −0.0676579 | 0.21598387 | 1.07698232 | 0.93458013 | 1.24108236 | 0.544650721 | ||
| Weighted median | 15 | −0.0366348 | 0.03404725 | 0.28192728 | −0.1033674 | 0.03009777 | 0.9640281 | 0.90179555 | 1.03055529 | |||
| Triacylglycerol (51:3) | Inverse variance weighted | 15 | −0.0225039 | 0.02910945 | 0.43947558 | −0.0795584 | 0.03455061 | 0.97774742 | 0.92352407 | 1.03515442 | 0.080285299 | 0.085553138 |
| MR‐Egger | 15 | 0.12382717 | 0.08309871 | 0.16005089 | −0.0390463 | 0.28670065 | 1.13182024 | 0.96170617 | 1.33202541 | 0.185538013 | ||
| Weighted median | 15 | −0.0105491 | 0.03405797 | 0.75675899 | −0.0773027 | 0.05620452 | 0.98950634 | 0.9256096 | 1.05781401 |
| Lipid | SNP |
| SE | Sample size |
|
|
|
|---|---|---|---|---|---|---|---|
| Sterol ester (27:1/16:1) | rs10087339 | 0.1966 | 0.0434 | 74022 | 6.005e−06 | 0.00027714 | 20.519928 |
| rs10893077 | −0.2538 | 0.054 | 74022 | 2.634e−06 | 0.00029834 | 22.0894032 | |
| rs11646044 | −0.2051 | 0.0398 | 74022 | 2.534e−07 | 0.00035863 | 26.5554364 | |
| rs11662668 | −0.1761 | 0.0391 | 74022 | 6.554e−06 | 0.00027396 | 20.2839935 | |
| rs1537373 | −0.1954 | 0.0342 | 74022 | 1.075e−08 | 0.0004408 | 32.6426322 | |
| rs1998891 | −0.151 | 0.0339 | 74022 | 8.38e−06 | 0.00026796 | 19.8400501 | |
| rs2417658 | −0.2178 | 0.046 | 74022 | 2.23e−06 | 0.00030277 | 22.4175606 | |
| rs4705938 | 0.1482 | 0.0335 | 74022 | 9.802e−06 | 0.00026432 | 19.5701908 | |
| rs571138 | −0.2042 | 0.0397 | 74022 | 2.75e−07 | 0.00035728 | 26.4556677 | |
| rs62349022 | −0.2468 | 0.0517 | 74022 | 1.839e−06 | 0.00030776 | 22.7875424 | |
| rs6798962 | −0.1876 | 0.0409 | 74022 | 4.612e−06 | 0.00028414 | 21.0381389 | |
| rs72705377 | −0.5121 | 0.1094 | 74022 | 2.857e−06 | 0.00029593 | 21.9110492 | |
| rs73349742 | 0.8042 | 0.1775 | 74022 | 5.915e−06 | 0.00027724 | 20.5267262 | |
| rs77028772 | −0.2715 | 0.0567 | 74022 | 1.696e−06 | 0.00030966 | 22.92777 | |
| rs893176 | 0.3235 | 0.0716 | 74022 | 6.158e−06 | 0.0002757 | 20.4131859 | |
| Sterol ester (27:1/18:1) | rs10087339 | 0.1966 | 0.0434 | 74022 | 6.005e−06 | 0.00027714 | 20.519928 |
| rs10893077 | −0.2538 | 0.054 | 74022 | 2.634e−06 | 0.00029834 | 22.0894032 | |
| rs11646044 | −0.2051 | 0.0398 | 74022 | 2.534e−07 | 0.00035863 | 26.5554364 | |
| rs11662668 | −0.1761 | 0.0391 | 74022 | 6.554e−06 | 0.00027396 | 20.2839935 | |
| rs1537373 | −0.1954 | 0.0342 | 74022 | 1.075e−08 | 0.0004408 | 32.6426322 | |
| rs1998891 | −0.151 | 0.0339 | 74022 | 8.38e−06 | 0.00026796 | 19.8400501 | |
| rs2417658 | −0.2178 | 0.046 | 74022 | 2.23e−06 | 0.00030277 | 22.4175606 | |
| rs4705938 | 0.1482 | 0.0335 | 74022 | 9.802e−06 | 0.00026432 | 19.5701908 | |
| rs571138 | −0.2042 | 0.0397 | 74022 | 2.75e−07 | 0.00035728 | 26.4556677 | |
| rs62349022 | −0.2468 | 0.0517 | 74022 | 1.839e−06 | 0.00030776 | 22.7875424 | |
| rs6798962 | −0.1876 | 0.0409 | 74022 | 4.612e−06 | 0.00028414 | 21.0381389 | |
| rs72705377 | −0.5121 | 0.1094 | 74022 | 2.857e−06 | 0.00029593 | 21.9110492 | |
| rs73349742 | 0.8042 | 0.1775 | 74022 | 5.915e−06 | 0.00027724 | 20.5267262 | |
| rs77028772 | −0.2715 | 0.0567 | 74022 | 1.696e−06 | 0.00030966 | 22.92777 | |
| rs893176 | 0.3235 | 0.0716 | 74022 | 6.158e−06 | 0.0002757 | 20.4131859 | |
| Phosphatidylcholine (18:2_18:2) | rs10087339 | 0.1966 | 0.0434 | 74022 | 6.005e−06 | 0.00027714 | 20.519928 |
| rs10893077 | −0.2538 | 0.054 | 74022 | 2.634e−06 | 0.00029834 | 22.0894032 | |
| rs11646044 | −0.2051 | 0.0398 | 74022 | 2.534e−07 | 0.00035863 | 26.5554364 | |
| rs11662668 | −0.1761 | 0.0391 | 74022 | 6.554e−06 | 0.00027396 | 20.2839935 | |
| rs1537373 | −0.1954 | 0.0342 | 74022 | 1.075e−08 | 0.0004408 | 32.6426322 | |
| rs1998891 | −0.151 | 0.0339 | 74022 | 8.38e−06 | 0.00026796 | 19.8400501 | |
| rs2417658 | −0.2178 | 0.046 | 74022 | 2.23e−06 | 0.00030277 | 22.4175606 | |
| rs4705938 | 0.1482 | 0.0335 | 74022 | 9.802e−06 | 0.00026432 | 19.5701908 | |
| rs571138 | −0.2042 | 0.0397 | 74022 | 2.75e−07 | 0.00035728 | 26.4556677 | |
| rs62349022 | −0.2468 | 0.0517 | 74022 | 1.839e−06 | 0.00030776 | 22.7875424 | |
| rs6798962 | −0.1876 | 0.0409 | 74022 | 4.612e−06 | 0.00028414 | 21.0381389 | |
| rs72705377 | −0.5121 | 0.1094 | 74022 | 2.857e−06 | 0.00029593 | 21.9110492 | |
| rs73349742 | 0.8042 | 0.1775 | 74022 | 5.915e−06 | 0.00027724 | 20.5267262 | |
| rs77028772 | −0.2715 | 0.0567 | 74022 | 1.696e−06 | 0.00030966 | 22.92777 | |
| rs893176 | 0.3235 | 0.0716 | 74022 | 6.158e−06 | 0.0002757 | 20.4131859 | |
| Sphingomyelin (d34:0) | rs10087339 | 0.1966 | 0.0434 | 74022 | 6.005e−06 | 0.00027714 | 20.519928 |
| rs10893077 | −0.2538 | 0.054 | 74022 | 2.634e−06 | 0.00029834 | 22.0894032 | |
| rs11646044 | −0.2051 | 0.0398 | 74022 | 2.534e−07 | 0.00035863 | 26.5554364 | |
| rs11662668 | −0.1761 | 0.0391 | 74022 | 6.554e−06 | 0.00027396 | 20.2839935 | |
| rs1537373 | −0.1954 | 0.0342 | 74022 | 1.075e−08 | 0.0004408 | 32.6426322 | |
| rs1998891 | −0.151 | 0.0339 | 74022 | 8.38e−06 | 0.00026796 | 19.8400501 | |
| rs2417658 | −0.2178 | 0.046 | 74022 | 2.23e−06 | 0.00030277 | 22.4175606 | |
| rs4705938 | 0.1482 | 0.0335 | 74022 | 9.802e−06 | 0.00026432 | 19.5701908 | |
| rs571138 | −0.2042 | 0.0397 | 74022 | 2.75e−07 | 0.00035728 | 26.4556677 | |
| rs62349022 | −0.2468 | 0.0517 | 74022 | 1.839e−06 | 0.00030776 | 22.7875424 | |
| rs6798962 | −0.1876 | 0.0409 | 74022 | 4.612e−06 | 0.00028414 | 21.0381389 | |
| rs72705377 | −0.5121 | 0.1094 | 74022 | 2.857e−06 | 0.00029593 | 21.9110492 | |
| rs73349742 | 0.8042 | 0.1775 | 74022 | 5.915e−06 | 0.00027724 | 20.5267262 | |
| rs77028772 | −0.2715 | 0.0567 | 74022 | 1.696e−06 | 0.00030966 | 22.92777 | |
| rs893176 | 0.3235 | 0.0716 | 74022 | 6.158e−06 | 0.0002757 | 20.4131859 | |
| Triacylglycerol (48:1) | rs10087339 | 0.1966 | 0.0434 | 74022 | 6.005e−06 | 0.00027714 | 20.519928 |
| rs10893077 | −0.2538 | 0.054 | 74022 | 2.634e−06 | 0.00029834 | 22.0894032 | |
| rs11646044 | −0.2051 | 0.0398 | 74022 | 2.534e−07 | 0.00035863 | 26.5554364 | |
| rs11662668 | −0.1761 | 0.0391 | 74022 | 6.554e−06 | 0.00027396 | 20.2839935 | |
| rs1537373 | −0.1954 | 0.0342 | 74022 | 1.075e−08 | 0.0004408 | 32.6426322 | |
| rs1998891 | −0.151 | 0.0339 | 74022 | 8.38e−06 | 0.00026796 | 19.8400501 | |
| rs2417658 | −0.2178 | 0.046 | 74022 | 2.23e−06 | 0.00030277 | 22.4175606 | |
| rs4705938 | 0.1482 | 0.0335 | 74022 | 9.802e−06 | 0.00026432 | 19.5701908 | |
| rs571138 | −0.2042 | 0.0397 | 74022 | 2.75e−07 | 0.00035728 | 26.4556677 | |
| rs62349022 | −0.2468 | 0.0517 | 74022 | 1.839e−06 | 0.00030776 | 22.7875424 | |
| rs6798962 | −0.1876 | 0.0409 | 74022 | 4.612e−06 | 0.00028414 | 21.0381389 | |
| rs72705377 | −0.5121 | 0.1094 | 74022 | 2.857e−06 | 0.00029593 | 21.9110492 | |
| rs73349742 | 0.8042 | 0.1775 | 74022 | 5.915e−06 | 0.00027724 | 20.5267262 | |
| rs77028772 | −0.2715 | 0.0567 | 74022 | 1.696e−06 | 0.00030966 | 22.92777 | |
| rs893176 | 0.3235 | 0.0716 | 74022 | 6.158e−06 | 0.0002757 | 20.4131859 | |
| Triacylglycerol (48:2) | rs10087339 | 0.1966 | 0.0434 | 74022 | 6.005e−06 | 0.00027714 | 20.519928 |
| rs10893077 | −0.2538 | 0.054 | 74022 | 2.634e−06 | 0.00029834 | 22.0894032 | |
| rs11646044 | −0.2051 | 0.0398 | 74022 | 2.534e−07 | 0.00035863 | 26.5554364 | |
| rs11662668 | −0.1761 | 0.0391 | 74022 | 6.554e−06 | 0.00027396 | 20.2839935 | |
| rs1537373 | −0.1954 | 0.0342 | 74022 | 1.075e−08 | 0.0004408 | 32.6426322 | |
| rs1998891 | −0.151 | 0.0339 | 74022 | 8.38e−06 | 0.00026796 | 19.8400501 | |
| rs2417658 | −0.2178 | 0.046 | 74022 | 2.23e−06 | 0.00030277 | 22.4175606 | |
| rs4705938 | 0.1482 | 0.0335 | 74022 | 9.802e−06 | 0.00026432 | 19.5701908 | |
| rs571138 | −0.2042 | 0.0397 | 74022 | 2.75e−07 | 0.00035728 | 26.4556677 | |
| rs62349022 | −0.2468 | 0.0517 | 74022 | 1.839e−06 | 0.00030776 | 22.7875424 | |
| rs6798962 | −0.1876 | 0.0409 | 74022 | 4.612e−06 | 0.00028414 | 21.0381389 | |
| rs72705377 | −0.5121 | 0.1094 | 74022 | 2.857e−06 | 0.00029593 | 21.9110492 | |
| rs73349742 | 0.8042 | 0.1775 | 74022 | 5.915e−06 | 0.00027724 | 20.5267262 | |
| rs77028772 | −0.2715 | 0.0567 | 74022 | 1.696e−06 | 0.00030966 | 22.92777 | |
| rs893176 | 0.3235 | 0.0716 | 74022 | 6.158e−06 | 0.0002757 | 20.4131859 | |
| Triacylglycerol (51:3) | rs10087339 | 0.1966 | 0.0434 | 74022 | 6.005e−06 | 0.00027714 | 20.519928 |
| rs10893077 | −0.2538 | 0.054 | 74022 | 2.634e−06 | 0.00029834 | 22.0894032 | |
| rs11646044 | −0.2051 | 0.0398 | 74022 | 2.534e−07 | 0.00035863 | 26.5554364 | |
| rs11662668 | −0.1761 | 0.0391 | 74022 | 6.554e−06 | 0.00027396 | 20.2839935 | |
| rs1537373 | −0.1954 | 0.0342 | 74022 | 1.075e−08 | 0.0004408 | 32.6426322 | |
| rs1998891 | −0.151 | 0.0339 | 74022 | 8.38e−06 | 0.00026796 | 19.8400501 | |
| rs2417658 | −0.2178 | 0.046 | 74022 | 2.23e−06 | 0.00030277 | 22.4175606 | |
| rs4705938 | 0.1482 | 0.0335 | 74022 | 9.802e−06 | 0.00026432 | 19.5701908 | |
| rs571138 | −0.2042 | 0.0397 | 74022 | 2.75e−07 | 0.00035728 | 26.4556677 | |
| rs62349022 | −0.2468 | 0.0517 | 74022 | 1.839e−06 | 0.00030776 | 22.7875424 | |
| rs6798962 | −0.1876 | 0.0409 | 74022 | 4.612e−06 | 0.00028414 | 21.0381389 | |
| rs72705377 | −0.5121 | 0.1094 | 74022 | 2.857e−06 | 0.00029593 | 21.9110492 | |
| rs73349742 | 0.8042 | 0.1775 | 74022 | 5.915e−06 | 0.00027724 | 20.5267262 | |
| rs77028772 | −0.2715 | 0.0567 | 74022 | 1.696e−06 | 0.00030966 | 22.92777 | |
| rs893176 | 0.3235 | 0.0716 | 74022 | 6.158e−06 | 0.0002757 | 20.4131859 |
Peer Reviews
No public reviews on file for this paper yet. If you reviewed it on a platform where reviews are public (OpenReview, ICLR, NeurIPS, ICML), you can paste yours below so the community can read it here.
Videos
No videos yet. Explain this paper in a talk, walkthrough, or lecture? Add one.
Taxonomy
TopicsIntracranial Aneurysms: Treatment and Complications · Moyamoya disease diagnosis and treatment · Cerebrovascular and Carotid Artery Diseases
Introduction
1
Intracranial aneurysm (IA) is a type of intracranial vascular disorder, and different epidemiological studies show that the incidence rate of IA varies between 2% and 7% in different populations (Freneau et al. 2022; Vlak et al. 2011; Brown and Broderick 2014). Most unruptured intracranial aneurysms (uIAs) are incidentally detected through neuroimaging examinations, typically without specific symptoms, although a few may present focal neurologic dysfunction due to a positional effect (Cianfoni et al. 2013; Goldenberg‐Cohen et al. 2004). However, although the risk of rupture is low, the most dangerous and common manifestation is an aneurysmal subarachnoid hemorrhage (SAH), with a high mortality rate of up to 50% and a complication rate of 70% once it occurs (J. Jin et al. 2022). Therefore, the prevention and treatment of IA formation are crucial topics in the realm of intracranial vascular diseases.
The formation of IAs is multifactorial, involving factors such as variations in parent arterial anatomy, abnormal hemodynamic flow, oxidative stress, and inflammatory reactions (Bor et al. 2008; Etminan and Rinkel 2016; Cebral et al. 2017; Hackenberg et al. 2020). Previous studies have identified several risk factors associated with the development of cerebral aneurysms, including smoking, female gender, positive family history, alcohol consumption, hypertension, advanced age, and certain genetic conditions (Vlak et al. 2011; Lindgren et al. 2014). In addition to these factors, researchers have turned their attention to the role of lipid metabolism in IAs recently (Frosen et al. 2013; Lovik et al. 2021; Ou et al. 2020). Disruptions in lipid metabolism can impact the progression of IAs through various mechanisms, including inducing systemic inflammation and oxidative stress, altering the lipid composition and metabolism of the intracranial arterial wall, weakening the structural strength and elasticity of the intracranial arterial wall, and regulating the expression and activity of various genes, proteins, and related signaling pathways (Vanrossomme et al. 2015).
Past research has traditionally measured plasma lipids using standard lipid profiling, including high‐density lipoprotein cholesterol (HDL‐C), low‐density lipoprotein cholesterol (LDL‐C), triglycerides (TG), and total cholesterol (TC). However, a recent genome‐wide association study (GWAS) has significantly expanded our understanding of circulating lipid variability and diversity using modern high‐throughput lipidomics technologies. This study explored 179 lipid variants across 13 major classes, including cholesterol esters (CE), ceramides (CER), cholesterol (Chol), diacylglycerols (DAG), lysophosphatidylcholines (LPC), lysophosphati‐dylethanolamine (LPE), phosphatidylcholines (PC), phosphatidylcholine ethers (PCO), phosphatidylethanolamines (PE), phosphatidylethanolamine ethers (PEO), phosphatidylinositol (PI), sphingomyelins (SM), and triacylglycerols (TAG). In comparison to standard lipids, this research has improved cardiovascular disease (CVD) risk assessment and provided new therapeutic options for CVDs (Ottensmann et al. 2023).
Given the impact of lipids on IAs, as mentioned earlier, and the similarity between many risk factors for IAs and CVDs, we hypothesize that exploring these lipid variants may also contribute to the prevention and treatment of IAs. Therefore, we conducted a Mendelian randomization (MR) study to investigate whether there is a causal relationship between these 179 lipids and the formation of IAs. Due to our study's focus on the formation of IAs, we exclusively considered data related to uIAs and did not include data on SAH.
MR analysis is a method that establishes causal inference by leveraging naturally occurring genetic variations in the population. It uses genetic variants as instrumental variables (IVs), effectively addressing issues related to confounding and reverse causation (Hong et al. 2023). This approach helps clarify relationships between variables.
Method
2
Study Design
2.1
Figure 1A demonstrates the basic principle of MR analysis. Three conditions are required for MR analysis: (1) robust connection between IVs and exposure factors (Sekula et al. 2016); (2) absence of correlation between IVs and confounders (Jia et al. 2023); (3) IVs exclusively influence outcomes through exposure factors, excluding any involvement of alternative pathways (Q. Jin et al. 2023). The analysis flow is displayed in Figure 1B.
(A) Basic principles of Mendelian randomization. (B)Work flow of the present study.
Data Source and Preparation
2.2
We obtained GWAS data for 179 lipid species from PMC10618167, derived from 7174 Finnish individuals, categorized into 13 classes of lipid (Ottensmann et al. 2023). The GWAS data for UIAs were conducted by The International Stroke Genetics Consortium (ISGC) intracranial aneurysm working group (PMC7116530) (Bakker et al. 2020). The dataset comprises 2070 controls and 71,952 cases.
The IVs were selected by the following standard: Single nucleotide polymorphisms (SNPs) associated with each lipid species at a locus‐wide significance threshold (*p *< 1e−5) were chosen as potential IVs (Zeng et al. 2023). A linkage disequilibrium (LD) window analysis was conducted for all IVs then (R ^2^ < 0.001, clumping window size = 10,000 kb). To ensure SNPs are strongly correlated with exposure factors, only SNPs with an F value greater than 10 are retained. The formula for calculating the F value is as follows (Pierce et al. 2011; Shim et al. 2015):
At last, SNP associations with any confounding factors potentially linked to the outcome were excluded using the Phenoscanner website (http://www.phenoscanner.medschl.cam.ac.uk/).
MR Analysis
2.3
We conducted MR analysis using the inverse‐variance weighting (IVW), weighted median (WM), and MR‐Egger methods. The primary results are based on the IVW method, while the WM and MR‐Egger methods serve as supplementary analyses and offer broader confidence intervals. It is important to note that the IVW method can only be applied after the impact of statistics influenced by horizontal pleiotropy is mitigated. To address this, we performed a test for horizontal pleiotropy (Burgess et al. 2016). Furthermore, we excluded results with heterogeneity among IVs during Cochran's Q test (p > 0.05) (Slob and Burgess 2020). Finally, we performed a leave‐one‐out sensitivity analysis for lipids with a p value of the IVW method < 0.05 of statistically significant causal relationships to arrive at our final results.
To bolster result credibility, we applied the same MR analysis methods described earlier to conduct a reverse MR analysis using uIAs as the exposure and lipids causally associated with uIAs as the outcomes.
All the mentioned analyses were carried out by the R package “TwoSampleMR” (Hemani et al. 2017, Hemani et al. 2018).
Results
3
Following the outlined steps, we conducted MR analysis with various lipid types as exposure factors and uIA as the outcome. Through horizontal pleiotropy tests and heterogeneity tests, we excluded certain statistical data affected by heterogeneity or horizontal pleiotropy, selecting results with p values exceeding 0.05 in both the heterogeneity Q‐test and the pleiotropy test. As shown in Figure 2, the IVW analysis revealed associations between uIAs and seven lipids (SE [27:1/16:1], SE [27:1/18:1], PC [18:2_18:2], SM [d34:0], TAG [48:1], TAG [48:2], TAG [51:3]). However, none of these lipids demonstrated a causal relationship with uIAs in MR‐Egger and WM analyses.
Forest plot of lipids associated with uIA (p < 0.05) identified by IVW method.
Figure 2 illustrates that the causal relationships of these seven lipids, as per IVW results, persist after sensitivity analyses. Detailed information on the SNPs used in IVW and the results of the MR analysis can be found in Tables 1 and 2. IVW results demonstrated in Figure 3 indicate that SE (27:1/16:1) (IVW, p = 0.025, OR = 1.314, 95% CI = 1.035–1.668), PC (18:2_18:2) (IVW, p = 0.033, OR = 1.249, 95% CI = 1.018–1.533), TAG (48:1) (IVW, p = 0.009, OR = 1.421, 95% CI = 1.092–1.850), TAG (48:2) (IVW, p = 0.013, OR = 1.446, 95% CI = 1.080–1.938), and TAG (51:3) (IVW, p = 0.046, OR = 1.257, 95% CI = 1.004–1.575) are risk factors for uIAs. Contrarily, SE (27:1/18:1) (IVW, p = 0.039, OR = 0.791, 95% CI = 0.634–0.989) and SM (d34:0) (IVW, p = 0.034, OR = 0.712, 95% CI = 0.520–0.975) exhibit a protective effect against uIAs. The leave‐one‐out sensitivity analysis results in Figure 4 confirm the sensitivity of these results.
Scatter plots for the causal association between lipids and uIA identified by IVW method.
Leave‐one‐out plots for the causal association between lipids and uIA identified by IVW method.
In the reverse MR analysis, we used uIA GWAS data as exposure and the aforementioned seven lipids as outcomes, and detailed reverse MR results indicate no bidirectional causal relationship between these lipids and uIAs (Table 3). SNPs used as IVs are provided in Table 4. The sensitivity test results of this step are shown in Figure 5.
Leave‐one‐out plots for the reverse MR analyses.
Discussion
4
IA is a common cerebrovascular disorder with diverse clinical manifestations, ranging from asymptomatic cases to those causing neurological dysfunction or compression of adjacent structures (W. Li et al. 2021). However, the most severe consequence is the rupture of IAs, leading to SAH, which poses a life‐threatening condition. Therefore, investigating the risk factors for the formation of IAs is of paramount importance.
Recent research has revealed the critical role of lipid metabolism in the onset of IAs. For instance, an MR study found that genetically determined levels of HDL‐C and LDL‐C were associated with a reduced risk of IAs and IA rupture, shedding light on the impact of lipid‐modifying drugs on IAs (Karhunen et al. 2021). However, these findings were not widely accepted, for another study did not identify a correlation between IA and TG or LDL‐C (Zhang et al. 2022).
Furthermore, certain proteins and genetic variations related to lipid metabolism have been confirmed to be associated with IAs. For instance, apolipoprotein E (APOE), a key regulatory factor in lipid metabolism, has been linked to genetic susceptibility to arterial aneurysms (Liu et al. 2016). Differences in gene expression related to lipid metabolism in IA patients also underscore the potential role of lipid metabolism in the pathogenesis of IAs, such as increased expression of the LDLR gene in IAs and specific genotypes (A/G) and alleles (A) of the APOA1 gene contributing to an increased risk of IAs (Synowiec et al. 2016).
In terms of mechanisms, pathological changes in IAs involve lipid deposition and alterations in the vascular wall structure and inflammatory responses within the damaged endothelial layer, induced by the interplay of lipid metabolism and blood flow. This ultimately leads to apoptosis of endothelial cells and smooth muscle cells, weakening the mechanical strength of the vascular wall, causing local outward bulging, and resulting in the formation of an arterial aneurysm (J. Jin et al. 2022).
However, former studies have focused solely on standard lipids such as HDL‐C, LDL‐C, TG, and TC. This makes our research strengths stand out. Firstly, we utilized data from a GWAS research that encompasses 179 lipid variants, enabling us to explore the impact of these diverse lipid isomers on the formation of uIAs and more accurately predict the risk of uIAs. (Ottensmann et al. 2023)
The obtained results highlight the significant impact of these lipid isomers on IAs, which has been scarcely explored in previous research, particularly in relation to vascular‐related disorders. The novelty of this study is underscored by the limited recognition of these isomers in prior investigations. Although the direct traces of these isomers were absent in previous studies, we have nonetheless summarized the roles of the major lipid classes they belong to.
For SEs, studies have indicated that their elevation may contribute to the process of “lipid raft aging,” leading to increased viscosity and reduced fluidity of lipid rafts (Diaz et al. 2023), and may be advantageous for the pro‐inflammatory state in cerebral tissue (Stables and Gilroy 2011). As IA is a cerebrovascular disease influenced by hemodynamics, we sought relevant research on the impact of SEs on hemodynamics and found only a mild effect (Hallikainen et al. 2006). Interestingly, our research identified two SE isomers with opposing effects on IAs, suggesting a potential mutual offsetting of the isomers leading to an overall diminished effect of SEs.
PCs are major components of mitochondrial membranes and are crucial for the synthesis of mature phospholipids in the heart, playing a vital role in maintaining mitochondrial function (X. Li et al. 2015). Limited information is available on the specific impact of PC (18:2_18:2) isomer on cerebrovascular diseases, as only one previous study associated this subtype with the severity of bronchiolitis (Kyo et al. 2023). On the contrary, other PC subtypes such as PC (22:6/18:2), PC (22:6/18:1), PC (20:4/16:1), and PC (16:1/18:3) have shown potential implications in diseases like myocardial infarction, and PC (16:0/16:0) has been associated with hypertension (Dong et al. 2017, Shoghli et al. 2023). Despite this, it is noteworthy that the PC (18:2_18:2) constitutes a significant proportion (34%) of soybean PC, suggesting a potential association between soybean intake and IA risk, although further research is needed (Le Grandois et al. 2009).
TAG, also known as TG, is acknowledged as a crucial risk factor in the formation of IAs, playing a key role in atherosclerosis‐related CVDs. Intracranial atherosclerosis leads to the deposition of lipid plaques, endothelial cell damage, and rupture of elastic fibers, resulting in weakened walls of intracranial arteries. Elevated intracranial pressure can cause localized dilation of these weakened arteries, ultimately leading to the formation of intracranial (Gutierrez et al. 2022; Holmstedt et al. 2013). However, recent MR studies investigating the relationship between lipids and IAs have not found any association between TGs and IAs (Karhunen et al. 2021; Zhang et al. 2022). Our study identified a specific association with only the following TAG subspecies: TAG (48:1), TAG (48:2), and TAG (51:3). This finding may offer new directions for understanding the role of TAGs in the context of IAs.
SM belongs to the class of sphingolipids and serves as a component of cell membranes, functioning as a bioactive signaling molecule (Ruangsiriluk et al. 2012). Clinically, plasma levels of SM have been associated with the progression of CADs and are considered an independent risk factor for CADs (Jiang et al. 2000). Unfortunately, there is a lack of research specifically addressing this particular isomer in the context of IAs.
In this study, we employed MR methodology, enhancing our ability to formulate causal hypotheses and increasing confidence in our findings. This approach mitigates various issues in observational studies, including confounding, selection bias, and memory bias, thereby aiding in clarifying relationships between variables and providing more reliable causal inferences (Smith and Ebrahim 2003). Additionally, the use of a two‐sample MR design allows for the combination of nonoverlapping exposure and outcome data to reduce bias.
There are still some limitations to our study: Firstly, due to the limited number of SNPs filtered by the conventional GWAs significance threshold (p < 5e−8), we lowered the standard to p < 1e−5, but rigorous pleiotropy and sensitivity tests helped remedy this deficiency. Secondly, MR analysis is influenced by demographic factors and genetic sequencing errors, and the current study population consists of individuals of European descent, limiting its generalizability. Furthermore, while MR analysis can provide evidence of causality, the interpretation of biological mechanisms may still be complex and require further experimental research. At last, we only focused on the formation of IAs and lacked a study on SAH. Further studies are needed to investigate whether these lipids have an effect on the rupture of IA.
Conclusion
5
Through MR analysis, we identified seven lipids that have a causal relationship with IAs, potentially offering new perspectives and directions for the risk assessment of IAs.
Author Contributions
Junqing Yan: conceptualization, methodology, software, data curation, supervision, formal analysis, validation, visualization, writing–review and editing, writing – original draft, investigation, resources, project administration.
Conflicts of Interest
The author declares no conflicts of interest.
Peer Review
The peer review history for this article is available at https://publons.com/publon/10.1002/brb3.70435
Declaration
The work has not been fully or partially published previously and is not under consideration for publication elsewhere.
Its publication is approved by all authors, and if accepted, it will not be published elsewhere in the same form, in English or in any other language, including electronically, without the written consent of the copyright holder.
The reference list from the paper itself. Each links out to its DOI / PubMed record.
- 1Bakker, M. K. , R. A. A. van der Spek , W. van Rheenen , et al. 2020. “Genome‐Wide Association Study of Intracranial Aneurysms Identifies 17 Risk Loci and Genetic Overlap With Clinical Risk Factors.” Nature Genetics 52, no. 12: 1303–1313.33199917 10.1038/s 41588-020-00725-7PMC 7116530 · doi ↗ · pubmed ↗
- 2Bor, A. S. , B. K. Velthuis , C. B. Majoie , and G. J. Rinkel . 2008. “Configuration of Intracranial Arteries and Development of Aneurysms: A Follow‐Up Study.” Neurology 70, no. 9: 700–705.18299521 10.1212/01.wnl.0000302176.03551.35 · doi ↗ · pubmed ↗
- 3Brown, R. D. Jr. , and J. P. Broderick . 2014. “Unruptured Intracranial Aneurysms: Epidemiology, Natural History, Management Options, and Familial Screening.” Lancet Neurology 13, no. 4: 393–404.24646873 10.1016/S 1474-4422(14)70015-8 · doi ↗ · pubmed ↗
- 4Burgess, S. , F. Dudbridge , and S. G. Thompson . 2016. “Combining Information on Multiple Instrumental Variables in Mendelian Randomization: Comparison of Allele Score and Summarized Data Methods.” Statistics in Medicine 35, no. 11: 1880–1906.26661904 10.1002/sim.6835 PMC 4832315 · doi ↗ · pubmed ↗
- 5Cebral, J. , E. Ollikainen , B. J. Chung , et al. 2017. “Flow Conditions in the Intracranial Aneurysm Lumen Are Associated With Inflammation and Degenerative Changes of the Aneurysm Wall.” AJNR American Journal of Neuroradiology 38, no. 1: 119–126.27686488 10.3174/ajnr.A 4951 PMC 5233582 · doi ↗ · pubmed ↗
- 6Cianfoni, A. , E. Pravatà , R. de Blasi , C. S. Tschuor , and G. Bonaldi . 2013. “Clinical Presentation of Cerebral Aneurysms.” European Journal of Radiology 82, no. 10: 1618–1622.23238357 10.1016/j.ejrad.2012.11.019 · doi ↗ · pubmed ↗
- 7Diaz, M. , D. Pereda de Pablo , C. Valdés‐Baizabal , G. Santos , and R. Marin . 2023. “Molecular and Biophysical Features of Hippocampal ‘Lipid Rafts Aging’ Are Modified by Dietary n‐3 Long‐Chain Polyunsaturated Fatty Acids.” Aging Cell 22, no. 8: e 13867.37254617 10.1111/acel.13867 PMC 10410061 · doi ↗ · pubmed ↗
- 8Dong, S. , R. Zhang , Y. Liang , et al. 2017. “Changes of Myocardial Lipidomics Profiling in a Rat Model of Diabetic Cardiomyopathy Using UPLC/Q‐TOF/MS Analysis.” Diabetology & Metabolic Syndrome 9: 56.28736579 10.1186/s 13098-017-0249-6PMC 5520292 · doi ↗ · pubmed ↗