Dataset for unrevealing the application of multi-trait genotype-ideotype distance index and multi-trait index based on factor analysis and ideotype-design models in the identification of high-yielding and stable barley genotypes
Alireza Pour-Aboughadareh, Omid Jadidi, Bita Jamshidi, Jan Bocianowski, Janetta Niemann

TL;DR
This paper introduces new models to identify stable and high-yielding barley varieties across different environments.
Contribution
The paper presents two novel selection models for genotype stability and yield analysis in barley breeding.
Findings
The MGIDI and FAI-BLUP models effectively identified stable barley genotypes (G3, G10, G14).
The first three factors explained 92.3% of the total variation in the dataset.
BLUP-based parameters correlated with stability and grain yield in multi-environment trials.
Abstract
Dissecting the genotype-by-environment interaction (GEI) effects in multi-environmental trials (METs) is a critical step in any breeding program before introducing new commercial varieties for cultivation in specific regions or across diverse environments. This dataset explores the application of two novel selection models: the multi-trait genotype-ideotype distance index (MGIDI) and the multi-trait index based on factor analysis and ideotype-design (FAI-BLUP). These models incorporate comprehensive stability parameters to identify high-yielding and stable barley genotypes across varying environmental conditions. In both models, the first three factors (FAs) with eigenvalues greater than 1 accounted for 92.3% of the total variation. The BLUP-based parameters, along with grain yield (GY) and the mean variance component (Ɵ), showed a positive selection deferential (SD) and correlated with…
Genes, proteins, chemicals, diseases, species, mutations and cell lines named across the full text — each resolved to its canonical identifier and authoritative record.
Click any figure to enlarge with its caption.
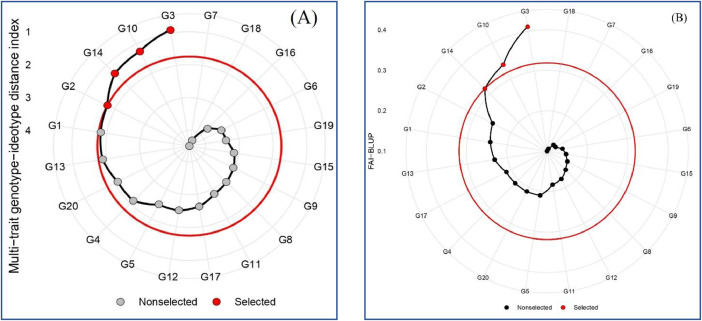 Figure 1
Peer Reviews
No public reviews on file for this paper yet. If you reviewed it on a platform where reviews are public (OpenReview, ICLR, NeurIPS, ICML), you can paste yours below so the community can read it here.
Videos
No videos yet. Explain this paper in a talk, walkthrough, or lecture? Add one.
Taxonomy
TopicsGenetics and Plant Breeding · Wheat and Barley Genetics and Pathology · Crop Yield and Soil Fertility
Specifications TableSubjectAgricultural and Biological ScienceSpecific subject areaAgronomy and Crop ScienceType of dataTable and Figure.Analyzed data.Data collectionGrain yield data for 20 barley genotypes were collected from five locations in Iran's warm climate zone – Darab, Ahvaz, Moghan, Zabol, and Gonbad – over two cropping seasons (2020-2022). Field trials at the test locations were conducted using a randomized complete block design with three replicates. Detailed descriptions of the growth conditions and experimental layouts are provided in [1]. Following data collection, 32 stability parameters, encompassing non-parametric, parametric, and models-based approaches, were computed and subsequently analysed.Data source locationThe Seed and Plant Improvement Institute (SPII), part of the Agricultural Research, Education and Extension Organization (AREEO), Karaj, Iran conducted the study. Experimental data were derived from multi-location trials performed as five locations within the warm regions of Iran: Ahvaz (31° 19′ 13″ N 48° 40′ 09″ E), Darab (28° 45′ 07″ N 54° 32′ 40″ E), Zabol (37° 15′ 00″ N 55° 10′ 02″ E), Moghan (39° 38′ 54″ N 47° 55′ 03″ E), and Gonbad (31° 01′ 43″ N 61° 30′ 04″ E).Data accessibilityRepository name: DatasetData identification number: https://doi.org/10.17632/sv5kv6tk94.2Direct URL to data: https://data.mendeley.com/datasets/sv5kv6tk94/2Related research article[1] S. Rahmati, R. Azizi-Nezhad, A. Pour-Aboughadareh, A. Etminan, L. Shooshtari. Analysis of genotype-by-environment interaction effect in barley genotypes using AMMI and GGE biplot methods, Heliyon, 10(2024) 38131. https://doi.org/10.1016/j.heliyon.2024.e38131
Value of the Data
1
- •The dataset analyzed in this report indicates the importance dissection of the GEI effect in MET.
- •This dataset reveals a breadth of type of stability parameters in selection of high-yielding and stable genotypes in MET.
- •This dataset highlights the efficiency of selection models such as MGIDI and FAI-BLUP in crop breeding programs.
- •As a remark outcome, integrating different stability parameters in a unique selection model can enhance the accuracy of selecting superior genotypes.
Background
2
Genotype-by-environment interaction (GEI) effects play a critical role in plant breeding programs, as they significantly influence the phenotypic expression of genotypes across various environments [2]. These interactions directly affect the selection and stability of desirable traits. Consequently, understanding GEI enables breeders to identify high-yielding genotypes with broad adaptability and stability, optimize breeding strategies, and enhance the efficiency of selection processes by accounting for environmental variability. In this context, METs are a fundamental component of plant breeding programs. METs involve evaluating a set of genotypes across various environments, including variations in location, year, or their combination, with the primary objective of analyzing and interpreting GEI effects [3]. Over recent decades, several statistical methods and models have been proposed to analyze the GEI effects and identify stable genotypes in METs. These methods and models can be broadly-categorized into two groups: (i) univariate approaches and (ii) multivariate approaches [3]. Among these, the GGE biplot analysis has emerged as a valuable graphical tool, enabling breeders to effectively select high-yielding and stable genotypes [4]. However, a comprehensive evaluation of genotypic responses is essential to fully assess the effect of GEI and identify superior genotypes. In a previous study [1], we employed the GGE biplot method to investigate GEI effect and identify high-yielding and stable barley genotypes, focusing on their adaptability in the warm climate of Iran. This dataset indicates the potential of integrating various stability parameters into a unified selection model, allowing breeders to select superior genotypes without relying solely on GGE biplot analysis. Additionally, evaluating the efficiency of these selection models represents another key objective of this report.
Data Description
3
The dataset presented in this article comprises four tables and one figure. Table 1 indicates the results of the combined analysis of variance (ANOVA), which reveals significant effects for environments (E), genotypes (G), and their interaction (GEI). These findings are further validated by the additive main effects and multiplicative interaction (AMMI) model. A detailed dissection of the GEI effect using the AMMI model demonstrates that the interaction can be partitioned into three significant interaction principal component axes (IPCAs). Specifically, IPCA1, IPCA2, and IPCA3 accounted for 31.83%, 24.80%, and 12.36% of the total GEI variation, respectively (Table 1). Table 2 presents the estimated grain yield (GY) values and 32 stability parameters for the genotypes evaluated across ten test environments.Table 1. The results of combined analysis of variance (ANOVA) and AMMI model for grain yield in the investigated genotypes of barley across different regions in the warm climate of Iran.Table 1SOVDfSSMSF-valueProbabilityTSS (%)Combined ANOVAEnvironment (E)91033.8114.86273.14Replication (R)/E2024.11.202.86Genotype (G)1925.21.333.16G × E Interaction171123.80.7241.72Residual380159.80.42AMMI modelTotal5991366.72.28Treatments1991182.95.9414.13G1925.21.333.16E91033.8114.8795.51Block2024.11.22.86G × E Interaction171123.80.721.7210.47 IPCA12739.41.463.4731.83 IPCA22530.71.232.92**24.80 IPCA32315.30.661.5812.36Residuals9638.50.40.95Error380159.80.42 and ** Significant at P < 0.01, respectively. SOV, df, SS, MS, and TTS indicate source of variation, the number of degree of freedom, sum of square, mean sum of square, and the total sum of square, respectively.Table 2. Estimated values of various stability parameters for the investigated barley genotypes.Table 2. CodeGYθHMGVRPGVHMRPGVWAASBS^(1)^S^(2)^S^(3)^S^(6)^NP(1)NP^(2)^NP^(3)^NP^(4)^ G14.660.244.071.021.020.184.7317.4314.142.993.200.430.400.431.810.210.26G24.520.253.960.990.990.094.1112.0611.423.052.700.320.360.430.640.070.09G34.950.254.241.061.060.204.5115.889.592.485.300.370.390.301.390.160.17G44.630.244.041.011.010.266.7341.3929.804.084.300.300.470.542.640.310.36G54.660.244.071.021.010.177.2740.9429.484.645.500.350.490.581.680.190.24G64.410.243.840.970.970.227.2739.1741.476.005.000.740.720.852.400.280.34G74.530.213.890.990.990.379.3864.1858.947.147.100.640.780.966.540.790.93G84.400.253.840.970.970.095.3822.7126.894.793.500.750.580.710.750.080.11G94.610.234.101.011.010.278.5352.0441.095.336.400.620.650.753.740.450.51G104.720.254.111.021.020.145.6722.6816.073.233.900.380.380.451.030.110.14G114.500.254.001.001.000.116.6933.1728.434.765.200.460.590.641.170.130.13G124.430.243.950.980.980.176.0029.1625.234.355.100.330.590.582.160.250.24G134.560.243.991.001.000.165.5324.2820.813.713.700.280.490.531.520.170.19G145.030.244.351.081.070.224.3313.887.861.964.800.520.370.271.690.200.22G154.480.243.910.980.980.207.1837.8340.065.765.300.600.720.842.460.290.33G164.560.223.931.000.990.358.1646.0138.705.336.500.570.670.765.350.650.76G174.750.254.091.031.030.106.5330.2721.623.815.300.360.460.521.390.160.19G184.140.253.690.930.930.184.6219.2933.385.854.401.510.970.891.470.170.16G194.220.253.770.950.950.082.937.3811.863.433.301.040.720.520.410.040.03G204.450.253.950.990.990.154.5616.0115.493.123.500.340.490.491.050.120.14CodeCV*θ'*KRASTABASIASVAVAMGEDADZEVFAMASIMASVSIPCZAWAASG130.550.2318.000.540.110.432.891.180.470.071.380.130.801.080.120.30G230.840.1614.000.080.060.251.140.490.170.010.240.060.500.430.050.14G331.810.2110.000.350.130.522.481.010.350.041.010.140.791.000.130.33G434.490.2824.000.520.180.723.121.280.420.061.630.191.071.240.170.43G532.260.2317.000.210.110.441.920.800.270.020.650.120.590.760.100.25G634.810.2732.000.340.160.642.801.060.320.031.130.161.050.890.130.34G735.300.5131.001.880.401.607.022.530.750.196.420.401.932.180.310.82G832.620.1721.000.010.030.130.500.190.050.000.040.030.140.130.020.06G930.110.3526.001.150.220.894.401.820.640.143.320.231.781.740.210.54G1031.960.198.000.130.110.431.750.660.190.010.440.110.550.500.080.21G1128.090.2019.000.040.030.140.850.320.120.000.100.040.220.300.040.09G1227.900.2530.000.450.160.663.111.190.380.051.420.161.330.780.100.26G1334.400.2219.000.280.170.682.841.010.280.031.020.170.690.660.100.28G1431.440.2313.000.460.180.713.371.210.390.051.460.180.841.070.140.37G1535.600.2730.000.630.190.783.901.410.450.071.990.201.541.090.150.37G1635.990.4429.001.670.301.225.962.250.760.195.070.321.942.240.290.75G1731.670.2110.000.010.020.090.420.160.060.000.030.020.120.160.020.05G1829.900.2129.000.120.090.381.460.620.190.010.380.090.480.560.080.20G1929.660.1520.000.020.030.120.710.260.100.000.070.030.170.220.030.07G2029.820.1920.000.190.130.532.090.820.230.020.670.130.610.650.100.26See Table 4 for abbreviations
The results indicated that certain stability parameters exhibited similar ranking patterns across the tested genotypes. For example, genotypes G14, G3, G17, and G10, which had the highest GY, were identified as the most stable genotypes based on the HMGV, RPGV, and HMRPGV parameters. Similarly, the top-ranked genotypes based on the S^(1)^, S^(2)^, and S^(3)^ stability parameters were G2, G3, G14, and G19. Stability parameters such as Wricke's ecovalence (W^2^), deviation from regression (S_d_^2^), Shukla's stability variance (σ^2^), and the mean variance component (Ɵ) showed similar results in identifying stable genotypes. Additionally, all AMMI-based stability parameters collectively identified G8, G11, G17, and G19 as the most stable genotypes. Given the different outcomes of various stability parameters in identifying stable genotypes, the MGIDI and FAI-BLUP models were utilized to integrate all stability parameters and select ideal genotypes. Table 3 presents the factor loadings and eigenvalues for the main effective factors in the MGIDI and FAI-BLUP models. In both models, the first three factors (FAs) with eigenvalues greater than 1 accounted for 92.3% of the total variation. Notably, BLUP-based parameters, along with GY and the mean variance component (Ɵ), demonstrated a positive selection deferential (SD) and were associated with the second factor (FA2). Fig. 1 illustrates the screening results for the barley genotypes based on the MGIDI (A) and FAI-BLUP (B) models. The central red circles represent the cutoff thresholds determined by the selection pressures (in the present study, SI was determined as 20%). Both models consistently identified G3, G10, G14, and G2 as the most stable genotypes. These findings align with a previous study by Rahmati et al. [1], which also identified G3, G10, and G14 as high-yielding genotypes with excellent adaptability to diverse environments within Iran's warm climate. This consistency further supports the reliability of the results presented in this dataset.Table 3. Factor loadings and sense patterns, and selection deferential (SD) for stability parameters in the MGIDI and FAI-BLUP models.Table 3. ParameterSenseMGIDI modelFAI-BLUP modelFactorXoXsSDFactorXoXsSDθIncreaseFA10.240.250.01FA10.240.250.01WAASBDecreaseFA10.190.16-0.02FA10.190.16-0.02 DecreaseFA12.061.19-0.88FA12.061.19-0.88 DecreaseFA10.240.14-0.11FA10.240.14-0.11 DecreaseFA10.280.16-0.12FA10.280.16-0.12CVDecreaseFA132.0031.50-0.45FA131.9631.51-0.45*θ'*DecreaseFA10.250.20-0.05FA10.250.20-0.05ASTABDecreaseFA10.450.26-0.20FA10.450.26-0.20ASIDecreaseFA10.140.12-0.02FA10.140.12-0.02ASVDecreaseFA10.570.48-0.09FA10.570.48-0.09AVAMGEDecreaseFA12.642.18-0.45FA12.642.19-0.45DADecreaseFA11.010.84-0.17FA11.010.84-0.17DZDecreaseFA10.330.28-0.05FA10.330.28-0.05EVDecreaseFA10.050.03-0.02FA10.050.03-0.02FADecreaseFA11.420.79-0.64FA11.420.79-0.64MASIDecreaseFA10.150.12-0.02FA10.150.12-0.02MASVDecreaseFA10.860.67-0.19FA10.860.67-0.19SIPCDecreaseFA10.880.75-0.13FA10.880.75-0.13ZADecreaseFA10.120.10-0.02FA10.120.10-0.02WAASDecreaseFA10.310.26-0.04FA10.310.26-0.04YSIncreaseFA24.564.800.24FA24.564.810.24HMGVIncreaseFA23.994.160.18FA23.994.170.18RPGVIncreaseFA21.001.040.04FA21.001.040.04HMRPGVIncreaseFA21.001.040.04FA21.001.040.04NP^(2)^DecreaseFA20.550.40-0.15FA20.550.40-0.15NP^(3)^DecreaseFA20.560.38-0.19FA20.560.38-0.19NP^(4)^DecreaseFA20.600.36-0.24FA20.600.36-0.24KRDecreaseFA221.0011.20-9.75FA221.0011.25-9.75S^(1)^DecreaseFA26.014.66-1.35FA26.014.66-1.35S^(2)^DecreaseFA329.3016.10-13.20FA229.2916.13-13.16S^(3)^DecreaseFA326.1011.20-14.90FA226.1211.24-14.88S^(6)^DecreaseFA34.292.68-1.61FA24.292.68-1.61NP^(1)^DecreaseFA34.704.18-0.53FA24.704.18-0.53See Table 4 for abbreviationsFig. 1Identified high-yielding and stable barley genotypes based on the ranking patterns obtained by the MGIDI (A) and FAI-BLUP (B) models. The selected genotypes (G2, G3, G10, and G14) have been highlighted in red. The central red circle is a cut of line based on the SI = 20%.Fig 1
Experimental Design, Materials and Methods
4
Descriptions of test genotypes and experimental sites
4.1
The plant materials used in this study consisted of eighteen promising barley genotypes, along with two local varieties [Oxin and Golchin] which served as reference genotypes. Detailed information on the pedigree of the tested genotypes is provided in Supplementary Table S1. The reference genotypes, recently released varieties, are characterized by high performance, stability, and broad adaptability across the warm regions of Iran. Field experiments were conducted at five locations within Iran's warm climate, which included Zabol, Ahvaza, Darab, Moghan, and Gonbad, over two cropping seasons (2022-2022 and 2022-2023). Geographical information for the test environments is presented in Table S1. A randomized complete block with three replications was employed as each location. The seed density was standardized at 350 seeds per square meter (150 kg ha^−1^) across all experiments. Each experimental plot consisted of six rows, each 5 meters in length, with 20 cm spacing between rows. The same seed source was used uniformly across all trials. Planting and harvesting processes were performed using a small-scale experimental planter and combine harvester (Wintersteiger, Ried, Austria). Finally, grain yield (GY) for each genotype was calculated in tons per hectare. More information regarding culturing practices and other information is available in Rahmati et al. [1].
Stability parameters
4.2
After collecting the experimental data, a combined analysis of variance (ANOVA) was conducted to assess the main effects of environments (E), genotypes (G), and their interaction (GEI) on the grain yield data. Additionally, an AMMI analysis of variance was performed to extract the significant principal component interactions (IPCAs). Subsequently, several parametric and non-parametric stability parameters were estimated, as presented in Table 4. Details descriptions of each stability parameter and its corresponding mathematical formula can be found in Pour-Aboughadareh et al. (2020). All stability parameters were calculated using the STABILITYSOFT software [2] and the ‘metan’ package [5] in R software [6]. Finally, the selection models MGIDI and FAI-BLUP were estimated as described by Olivoto et al. [7] and Rocha et al. [8] using the ‘metan’ packages in R.Table 4. List of parametric and non-parametric stability statistics to analyze GEI effect in this dataset.Table 4. Satbility parameterSymbolPattern of selectionReferenceMean variance componentΘMinimum value[9]GE variance componentθ'Maximum value[10]Wricke's ecovalence Minimum value[11]Deviation from regression Minimum value[12]Shukla's stability variance Minimum value[13]Coefficient of varianceCVMinimum value[14]Nassar and Huhn's and Huhn's statisticsS^(1, 2, 3, 6)^Minimum value[15,16]Kang's rank-sumKRMinimum value[17]Yield stability indexYSMaximum value[18]Averages of the squared eigenvector valuesEvMinimum value[19]Thennarasu's non-parametric statisticsNP^(1-4)^Minimum value[20]Sums of the absolute value of the IPC scoresSIPCMinimum value[21]Sum across environments of the GEI modelled by AMMIAMGEMinimum value[21]Distance of IPCAs point with origin in spaceDMinimum value[22,23]AMMI stability valueASVMinimum value[24]AMMI Based Stability ParameterASTABMinimum value[25]Harmonic mean of genotypic valuesHMGVMaximum value[26]Relative performance of genotypic valuesRPGVMaximum value[26]Harmonic mean of RPGVHMRPGVMaximum value[26]Genotype stability indexGSIMaximum value[27]Modified AMMI Stability ValueMASVMinimum value[28]Absolute value of relative contribution of IPCAsZAMinimum value[28]Sum across environments of absolute value of GEI modelled by AMMIAVAMGEMinimum value[28]AMMI stability indexASIMinimum value[29]Modified AMMI stability indexMASIMinimum value[30]Weighted average of absolute scoresWAASMinimum value[31]Weighted average absolute scores of BLUPWAASBMinimum value[31]
Limitations
Not applicable.
Ethics Statement
All authors have read and follow the ethical requirements for publication in Data in Brief and our work meets these requirements. Our work does not involve studies with animals and humans.
CRediT authorship contribution statement
Alireza Pour-Aboughadareh: Conceptualization, Methodology, Software, Investigation, Data curation, Writing – review & editing. Omid Jadidi: Methodology, Software. Bita Jamshidi: Software, Writing – original draft. Jan Bocianowski: Validation, Writing – review & editing. Janetta Niemann: Validation, Writing – review & editing.
The reference list from the paper itself. Each links out to its DOI / PubMed record.
- 1Rahmati S.Azizi-Nezhad R.Pour-Aboughadareh A.Etminan A.Shooshtari L.Analysis of genotype-by-environment interaction effect in barley genotypes using AMMI and GGE biplot methods Heliyon 1020243813110.1016/j.heliyon.2024.e 38131 PMC 1143783539347424 · doi ↗ · pubmed ↗
- 2Pour-Aboughadareh A.Yousefian M.Moradkhani H.Poczai P.Siddique K.H.M.STABILITYSOFT: a new online program to calculate parametric and non-parametric stability statistics for crop traits Appl. Plant Sci.72019 e 121110.1002/aps 3.1211 PMC 634223430693157 · doi ↗ · pubmed ↗
- 3Pour-Aboughadareh A.Khalili M.Poczai P.Olivoto T.Stability indices to deciphering the genotype-by-environment interaction (GEI) effect: an applicable review for use in plant breeding programs Plants 1120224143516139610.3390/plants 11030414 PMC 8839246 · doi ↗ · pubmed ↗
- 4Pour-Aboughadareh A.Marzooghian A.Gholipour A.Zali H.Koohkan S.Omrani A.Kheirgoo M.Askari-Kelestani A.Barati A.Genotype-by-environment interaction analysis for grain yield of barley genotypes in the warm climate of Iran Ecol. Genet. Genomics 322024100264
- 5Olivoto T.Lucio A.D.Metan: an R package for multi environment trial analysis Methods Ecol. Evol.11202078378910.1111/2041-210X.13384 · doi ↗
- 6R Core Team R: A Language and Environment for Statistical Computing 2018 R Foundation for Statistical Computing Vienna, Austria
- 7Olivoto T.Diel M.I.Schmidt D.MGIDI: a powerful tool to analyze plant multivariate data Plant Methods 1820221213637121010.1186/s 13007-022-00952-5PMC 9652799 · doi ↗ · pubmed ↗
- 8Rocha J.R.D.A.S.d.C.Machado J.C.Carneiro P.C.S.Multitrait index based on factor analysis and ideotype-design: proposal and application on elephant grass breeding for bioenergy GCB Bioenergy 1020185260