Use of multiple indicators multiple causes (MIMIC) method to investigate quantitative inference in socioeconomic determinants on motorcyclist stress
Iqra Mona Meilinda, Sugiarto Sugiarto, Sofyan M. Saleh, Ashfa Achmad

TL;DR
This study uses the MIMIC model to show how socioeconomic factors affect motorcyclist stress, as measured by heart rate variability.
Contribution
The novel application of the MIMIC model to analyze socioeconomic determinants of motorcyclist stress using HRV data.
Findings
Socioeconomic variables like age, income, and education significantly influence motorcyclist stress levels.
The MIMIC model showed strong statistical performance with fit indices such as CFI = 0.982 and RMSEA = 0.057.
Findings suggest targeted interventions could reduce stress and improve road safety for motorcyclists.
Abstract
Research has shown that driving-related stress plays a significant role in causing traffic accidents, either directly or indirectly. Motorcyclists often engage in risky driving behaviors due to elevated stress levels. This study investigates the influence of socioeconomic factors on driving stress among motorcyclists. Data were gathered from 50 participants, with heart rate (HR) recorded using the Polar Vantage V2 device. Heart rate variability (HRV) was analyzed in both time and frequency domains using Kubios HRV software. The study employed the Multiple Indicators Multiple Causes (MIMIC) model to explore the associations between socioeconomic factors and driving stress. The results indicate that variables such as age, gender, education level, occupation, income, driving experience, and travel purpose significantly affect stress levels across both HRV domains. These findings highlight…
Genes, proteins, chemicals, diseases, species, mutations and cell lines named across the full text — each resolved to its canonical identifier and authoritative record.
Click any figure to enlarge with its caption.
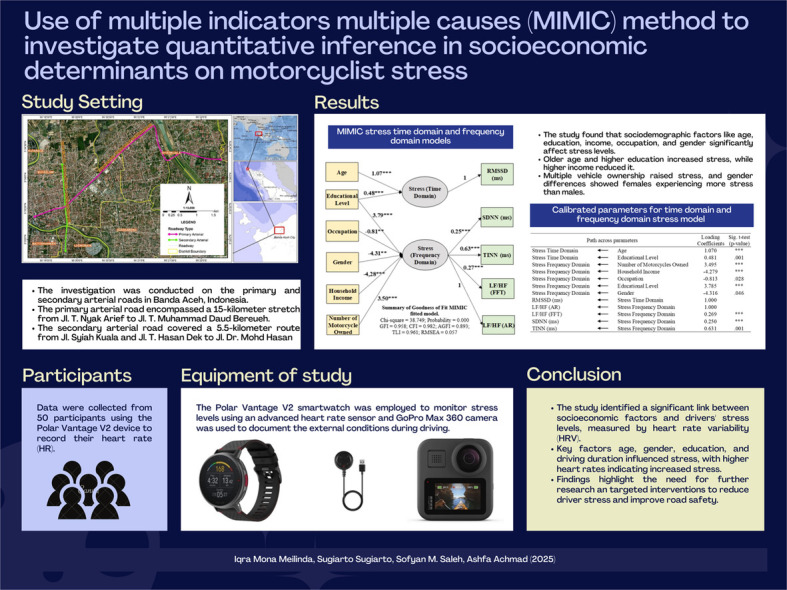 Figure 1
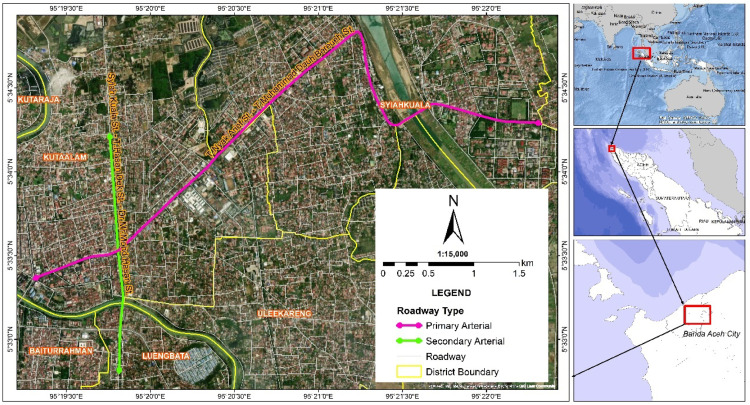 Figure 2
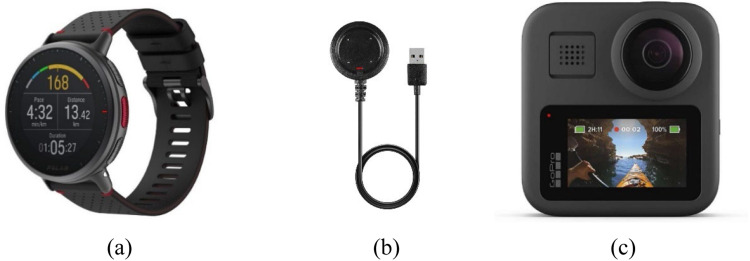 Figure 3
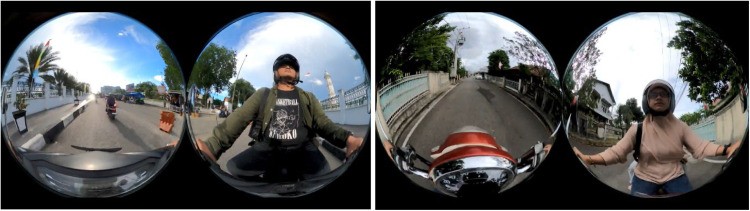 Figure 4
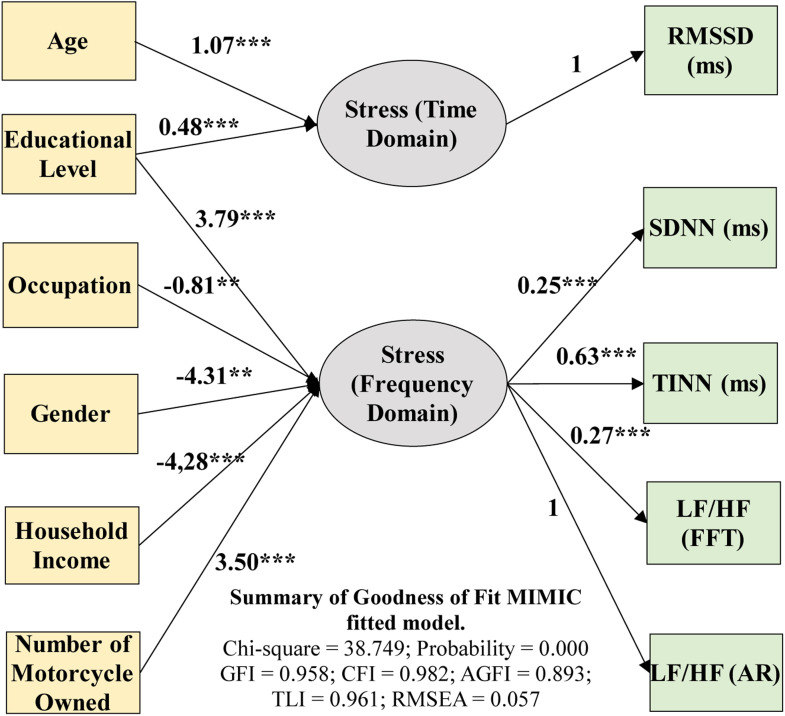 Figure 5
Peer Reviews
No public reviews on file for this paper yet. If you reviewed it on a platform where reviews are public (OpenReview, ICLR, NeurIPS, ICML), you can paste yours below so the community can read it here.
Videos
No videos yet. Explain this paper in a talk, walkthrough, or lecture? Add one.
Taxonomy
TopicsTraffic and Road Safety · Urban Transport and Accessibility · Agriculture and Farm Safety
Specifications tableSubject area:EngineeringMore specific subject area:Travel Behavior / Driving StressName of your method:Multiple Indicators Multiple Causes (MIMIC)Name and reference of original method:P. P. Thwe, T. Yamamoto, H. Sato, and T. Morikawa, Analysis of driving stress on various roadway conditions in Myanmar by using heart rate variability, Asian Transport Studies, 4 (4) (2017) 663–679Resource availability:Information on all resources needed to reproduce this procedure is included in the present article
Background
Previous research linked driving stress to traffic accidents [[1], [2], [3]]. showing a correlation between physiological responses and stress. Driving stress, associated with heart rate and respiration, was a key traffic safety indicator for motorcyclists [4]. Highest heart rates occurred in commercial zones and road curvatures, with land-use factors like offices and schools affecting stress levels [5]. Previous research has predominantly focused on evaluating driver stress through psychological, physical, and physiological responses [[6], [7]]. Psychological evaluations have been the most frequently utilized methodology for assessing stress, predominantly employing self-report measures or questionnaires administered subsequent to driving sessions [8]. Nevertheless, post-experiment questionnaires may inadequately capture a driver's real-time emotional states, potentially resulting in biased results. Additionally, certain studies have endeavored to assess driver stress using physiological indicators, including facial expressions and vehicle dynamic data [9]. A substantial body of research has used physiological methods, such as cardiac activity, electrodermal activity, and respiratory patterns, to evaluate stress. Heart rate variability (HRV) has emerged as a reliable, noninvasive technique for assessing driver stress, offering insights into autonomic nervous system fluctuations regulating cardiac function [[10], [11], [12], [13]].
Study by [14], regulates involuntary physiological processes such as heart rate to maintain homeostasis and adapt to environmental stimuli [15]. Electrocardiography (ECG) records heart activity [16], enabling the extraction of heart rate variability (HRV) data to analyze cardiac autonomic modulation. Frequency-domain HRV metrics, such as high-frequency (HF) and low-frequency (LF) power, offer insights into parasympathetic and sympathetic activity, respectively. Furthermore, time-domain and nonlinear heart rate variability (HRV) metrics have been employed to characterize various driver states [[16], [17]]. Moreover, heart rate variability (HRV) is influenced by multiple factors, including age, gender, cardiorespiratory fitness, circadian rhythms, and psychological stress [[18], [19], [20], [21]]. Research showed that HRV characteristics, like the LF/HF ratio, changed under stress or fatigue [22]. Furthermore, age significantly affects traffic accidents, with younger drivers showing more antisocial behaviors and slower hazard perception due to inexperience. Machin and Sankey [23] or difficulty regulating emotions [24]. Conversely, elderly drivers showed unsafe behaviors in velocity regulation and lane transitions. Age was considered a socioeconomic factor impacting driving behavior and stress [25].
In a study conducted by [26], younger drivers displayed more hostile and anxious behaviors; males were aggressive and risky, and females were more cautious and nervous. Gender differences also appeared in cognitive tasks like mental rotation and spatial orientation [27]. A limited number of studies have focused on the cognitive demands of driving. Research indicates that males show a greater tendency for high-risk driving behaviors, while females struggle with vehicle control and navigation in complex traffic, contributing to gender-based differences in driving behavior [[27], [28]]. This study examines how socioeconomic factors, such as age, gender, education, income, driving experience, and daily travel habits, influence driving stress among motorcycle riders. By analyzing these variables, the research aims to deepen understanding of the link between socioeconomic characteristics and driving behavior, providing a foundation for strategies to reduce driving stress in urban environments.
Method details
Area of Study
The investigation was conducted on the primary and secondary arterial roads in Banda Aceh, Indonesia. The primary arterial road encompassed a 15-kilometer stretch from Jl. T. Nyak Arief to Jl. T. Muhammad Daud Bereueh, while the secondary arterial road covered a 5.5-kilometer route from Jl. Syiah Kuala and Jl. T. Hasan Dek to Jl. Dr. Mohd Hasan in Fig. 1. The sample comprised 50 participants. Data were collected during peak hours (morning, afternoon, and evening) in accordance with participants' availability and consent. Participants were randomly selected to ensure a balanced representation of students and workers, as well as an equal distribution of male and female riders. All participants were in good health and possessed valid motorcycle driving permits.Fig. 1. Location of experiments.Fig 1
Equipment of study
The driving experiment utilized two primary instruments: a heart rate sensor integrated into the Polar Vantage V2 Multisport Smartwatch and the GoPro Max 360 camera. The Polar Vantage V2 smartwatch was employed to monitor stress levels using an advanced heart rate sensor. The participants wore smartwatches on their wrists throughout the experiment. Baseline heart rate data were recorded 10 min prior to the driving session to represent the rest condition, and continuous heart rate data were collected while the participants navigated a predefined route. These signals were transmitted to the smartwatch and subsequently extracted for analysis using a Polar Flow application. Concurrently, a GoPro Max 360 camera was used to document the external conditions during driving. The camera captured detailed visuals of road classifications, adjacent land-use types, traffic settings, real-time traffic conditions, and roadway geometry. This dual-instrument approach facilitated a comprehensive analysis of physiological stress responses in relation to environmental factors affecting driving experience (Fig. 2).Fig. 2(a) Vantage V2 polar watch; (b) Polar USB cable; (c) GoPRO MAX 360 camera.Fig 2
Data collection method
The data collection process was initiated by instructing participants to navigate predetermined routes. Two categories of routes were incorporated into the study: a primary arterial road encompassing Jalan T. Nyak Arief to Jalan T. Muhammad Daud Bereueh, and a secondary arterial road comprising Jalan Syiah Kuala and Jalan T. Hasan Dek to Jalan Dr. Mr. Mohd Hasan. Fifty participants were involved in the study, with 25 individuals allocated to each route. Data collection was conducted with three to four participants per day, ensuring a systematic approach to testing and observation (Fig. 3).Fig. 3. Participants involved as research samples.Fig 3
Prior to the driving experiment, participants attended a briefing session in which they were informed about the study's objectives, procedures, and safety requirements. These included possessing a valid driving license (SIM C) and utilizing protective helmets. Participants also completed a questionnaire to provide sociodemographic data, including information on age, gender, education level, occupation, travel purpose, average daily trips, household income, driving experience, daily driving duration, number of motorcycles owned, and possession of a driving license. To ensure that the participants were in a relaxed state prior to the experiment, they wore a Polar Vantage V2 smartwatch for 10 min before driving to record baseline heart rate data. During the experiment, the participants operated their vehicles at an average speed of 60 km/h along designated routes. Upon completion of the drive, the heart rate data recorded by the Polar Vantage V2 smartwatch were extracted using the Polar Flow application. These data were subsequently organized and analyzed using the Multiple Indicators Multiple Causes (MIMIC) method.
MIMIC model framework
In this context, Exploratory Factor Analysis (EFA) investigated the relationship between stress variables in the time and frequency domains and variable X, which comprised the heart rate variability (HRV) parameters. These included the standard deviation of normal-to-normal RR intervals (SDNN), root mean square of successive differences in RR intervals (RMSSD), triangular interpolation of NN intervals (TINN), and measures of autonomic balance, such as the ratio of low-frequency (LF) to high-frequency (HF) power using fast Fourier transform (FFT) and LF/HF ratio using autoregressive (AR) modeling. Conversely, Confirmatory Factor Analysis (CFA) examined the relationship between the stress variables (time and frequency domains) and indicator Y, which encompassed the socioeconomic characteristics of the drivers. These characteristics included age, gender, education level, occupation, travel purpose, average daily trips, household income, driving experience, daily driving time, number of motorcycles owned, and possession of driving license. Throughout the modeling process, all independent and dependent variables were represented as dummy variables to encode categorical data for inclusion in the model. In the multiple linear regression analysis, dummy variables were constructed to represent distinct categories within the independent variables and indicators [[29], [30]].
Method validation
Socio-economic data distributions
Table 1 presents the distribution of the 50 participants included in the study, encompassing a range of demographic and driving-related characteristics. The gender distribution was balanced, with 60 % male and 40 % female participants. The age groups were as follows: 22 % were aged 17–19 years, 72 % were aged 20–29 years, and 6 % were aged 30–39 years. Education levels varied, with 38 % holding primary school or equivalent qualifications, 58 % having undergraduate degrees, and 4 % holding postgraduate degrees. Regarding employment status, 2 % were government employees, 12 % were private employees, 2 % were self-employed, 24 % were students, and 60 % fell into the “other” category. Furthermore, travel purposes included business/work (10 %), education (40 %), shopping (26 %), and vacations (16 %). The daily trip frequency ranged from 1 to more than 5 trips, distributed as follows: 2 %, 40 %, 32 %, 14 %, and 12 %, respectively. Monthly household income was categorized into five ranges: 1–2.9 million IDR (4 %), 3–4.9 million IDR (28 %), 5–6.9 million IDR (28 %), 7–9.9 million IDR (36 %), and more than 10 million IDR (4 %).Table 1. Variable percentage of driving stress of urban arterial roads.Table 1. Socio-Economic Characteristics of participantsNumber of participantsGenderMale30Female20AgesAges of 17–1911Ages of 20–2936Ages of 30–393Education LevelPrimary school graduates/equivalent19Undergraduate graduates29Postgraduate graduates2Types of OccupationsCivil Servants/Military Personnel/Police Officers/State-Owned Enterprises (SOEs) Employees1Private employees6Self-employed1Students12Others30Travelling PurposesBusiness/work9Education20Shopping13Vacation8Frequent Trips1122031647>56Monthly Income<1 million,01–2.9 million23–4.9 million145–6.9 million147–9.9 million18>10 million2Driving Time Per Day<1 hour101–3 hours373–5 hours25–8 hours0> 8 hours1Driving Experience1–5 years05–10 years1410–15 years3015–20 years4> 20 years2Vehicle Ownership1 unit142 units113 units204 units4> 4 units1
Regarding mobility attributes, the daily driving time was categorized into four groups: less than 1 h (20 %), 1–3 h (74 %), 3–5 h (4 %), and more than 8 h (2 %). Driving experience was distributed as follows: 5–10 years (28 %), 10–15 years (60 %), 15–20 years (8 %), and > 20 years (4 %). Vehicle ownership ranged from one to more than four units, with respective distributions of 28 %, 22 %, 40 %, 8 %, and 2 %. All participants possessed a valid two-wheeled driving license (SIM C) to ensure compliance with the licensing requirements.
Heart rate variability distributions
The parameters analyzed in this study were SDNN, RMSSD, TINN, LF/HF (FFT), and LF/HF (AR). These metrics were selected because of their well-established roles as indicators of autonomic nervous system function and heart rate variability (HRV), both of which reflect the physiological stress experienced by drivers. Data were processed using Kubios HRV Standard 3.5.0, a widely recognized tool for HRV analysis. Tables 2 and 3 present the heart rate (HR) data for drivers on primary and secondary arterial roads, revealing specific mean values. These findings elucidate the physiological responses of drivers to varying road conditions and demonstrate the relationship between the road type and stress level.Table 2HRV indicators on primary arterial roads.Table 2. Participants IDMEAN HRMEAN RRSDNN (ms)RMSSD (ms)PNN50 (%)TINN (ms)LF/HF (FFT)LF/HF (AR)194.379636.6837.8828.6900.00028.4735.52336.114291.215658.59910.5375.8770.78444.0458.43210.773380.802743.02514.4105.5470.17029.5915.4548.645484.370712.96313.0436.2000.29148.3649.07910.1645106.752563.85913.2554.5190.06435.0919.59536.2556105.408569.5029.7674.5700.05537.31814.12715.672795.000632.85510.1266.1250.60741.4099.57414.421889.832668.2118.9855.6630.16632.6827.20314.910994.133641.55014.1208.7180.84156.0915.42830.2521092.647649.24013.7457.2370.33452.7738.24227.0201190.645663.4399.5215.3630.18634.2739.70812.6061298.600608.7448.9144.4780.06534.13611.84453.2081395.142631.4849.8015.3960.39431.0918.76626.5461477.444775.50311.2167.0400.26043.2735.93312.9841599.366604.88111.8026.2820.34045.7277.46213.66616100.250599.1718.2134.1510.11332.2279.91612.8561797.523616.0038.8154.4400.14332.3528.01315.93918100.158599.88812.7966.3090.23346.68213.46528.5301999.507604.8879.6094.9550.28439.5457.65414.00820103.781579.4888.3454.3180.16431.7738.48116.9072192.665649.2219.2395.6040.06535.2279.51416.6912287.670687.24214.2297.6790.52853.6827.88216.2412395.605628.1208.2364.5140.03532.9557.3238.8902479.331799.94828.58219.7350.684127.2276.94334.9582583.917718.07117.19511.1370.84866.7735.8586.260Table 3Heart Rate Variability (HRV) Indicators on Secondary Arterial Roads.Table 3. Participants IDMEAN HRMEAN RRSDNN (ms)RMSSD (ms)PNN50 (%)TINN (ms)LF/HF (FFT)LF/HF (AR)185.825700.4616.4793.9590.00028.0673.97515.6712104.718533.9786.8993.6840.03224.6004.6648.952374.797804.62512.8777.9280.19946.8008.84611.640480.039751.4148.7805.3450.39230.8673.9007.847578.542765.5119.6265.0500.03231.9335.16139.737694.294640.58312.1397.1600.58839.9333.38814.6987109.4434044.8425.79710.1870.00019.4002.1099.927892.615649.5258.4554.6710.00029.8004.69922.565983.927717.3057.8845.2150.00027.6672.8609.03110108.453553.6277.5874.0970.37025.4002.50011.05911104.715574.1855.8303.0460.00019.8003.56112.7451279.074767.5419.0445.4040.00029.86712.54312.0321387.846685.81015.7207.1751.17636.9336.05712.5661496.297625.4887.42511.7780.47633.7333.05413.7901593.333644.4796.6824.0730.10021.6003.3358.0221680.137750.31410.1385.9100.03334.6702.0439.78217104.068578.5099.0454.7324.36439.8008.8448.5221885.338709.80510.0706.0890.47539.2008.50911.6351997.309617.4077.8944.4200.00025.5332.8108.7892094.904638.4818.9294.8640.00030.9332.63811.49421104.027579.7135.4133.4320.00020.4001.1346.2202290.020668.55910.5915.1470.02137.5336.98820.6982383.427722.10712.3485.8960.00050.2003.84137.8962496.850621.2547.24910.0320.00023.4673.19811.7482577.001733.3889.0445.4040.00029.86712.54312.539
The Mean HR (average heart rate) in Table 2 values among drivers on primary arterial roads exhibited variability, ranging from 77.444 bpm to 106.752 bpm. Most drivers demonstrated a Mean HR exceeding 90 bpm, indicating a relatively elevated level of cardiovascular activity, potentially attributable to the physical or cognitive demands associated with driving. Drivers with higher Mean HR values, such as IDs 5, 6, 16, 18, and 20, likely experienced increased levels of physiological arousal or tension compared with those with lower Mean HR values, such as IDs 14 and 24. Although the Mean HR values for all drivers remained within the normal resting heart rate range (60–100 bpm) as defined by [[30], [31], [32]], several drivers exhibited HR values exceeding 100 bpm, potentially indicating elevated stress or anxiety levels. These elevated HR levels may be attributed to driving conditions or environmental factors, thus underscoring the potential influence of external stimuli on the physiological responses during driving.
The Mean HR (average heart rate) in Table 3 values for participants in this study ranged from 74.797 bpm to 109.443 bpm. Most participants exhibited Mean HR values exceeding 90 bpm, indicating relatively high cardiovascular activity, which was likely influenced by driving demands. Drivers with higher Mean HR values, such as IDs 2, 7, 10, 11, 17, and 21, surpassed 100 bpm, potentially indicating elevated stress or anxiety levels during the driving task. These elevated heart rates may be attributed to factors such as traffic conditions, environmental stressors, or individual physiological responses to driving. Conversely, participants with lower Mean HR values, such as IDs 3, 5, 12, and 25, displayed moderate cardiovascular responses. This suggests a less stressful driving experience and reduced exposure to stress-inducing factors.
MIMIC model result
The MIMIC model was employed to investigate the relationship between stress variables in the time and frequency domains and heart rate variability (HRV) parameters (X variables). These parameters encompassed the standard deviation of normal-to-normal RR intervals (SDNN), the root mean square of successive differences in RR intervals (RMSSD), triangular interpolation of the NN interval histogram (TINN), and the low-frequency (LF)/high-frequency (HF) ratio derived through fast Fourier transform (FFT), representing the balance between sympathetic and parasympathetic nervous system activity. Additionally, the model examined the association of these stress variables with socioeconomic indicators of the drivers (Y variables), including age, gender, education level, occupation, travel purpose, average daily trips, household income, driving experience, daily driving duration, number of motorcycles owned, and possession of a driving license.
Among the factors analyzed, significant effects were observed primarily in the drivers' socioeconomic characteristics, including age, gender, education level, occupation, household income, and the number of motorcycles owned. These variables were found to have a substantial impact on the stress levels experienced by drivers in both time and frequency domains. Fig. 4 presents the hypothetical model with generalized values, illustrating the influence of drivers' socioeconomic characteristics on vehicular stress across time and frequency domains.Fig. 4MIMIC stress time domain and frequency domain models.Fig 4
The model depicts the causal relationships between these variables, with significance levels represented by unidirectional arrows. Statistical significance was denoted as p < 0.10, p < 0.05, and p < 0.01, highlighting the critical role of socioeconomic factors in understanding driving stress. These findings emphasize that personal and economic factors are key determinants of stress, offering valuable insights into traffic management and the development of driver safety interventions. The chi-square correlation was employed to evaluate the overall model fit, yielding a value of 38.749. The MIMIC stress model demonstrated an acceptable fit in both time and frequency domains, with goodness-of-fit (GOF) statistics as follows: Comparative Fit Index (CFI) = 0.982, Adjusted Goodness-of-Fit Index (AGFI) = 0.893, Tucker Lewis Index (TLI) = 0.961, and Root Mean Square Error of Approximation (RMSEA) = 0.057. These results indicate robust model performance in capturing the relationships between socioeconomic factors and driving stress (Table 4).Table 4. Calibrated parameters for time domain and frequency domain stress model.Table 4. Path across parametersLoading CoefficientsSig. t-test (p-value)Stress Time Domain Age1.070Stress Time Domain Educational Level0.481.001Stress Frequency Domain Number of Motorcycles Owned3.495Stress Frequency Domain Household Income-4.279Stress Frequency Domain Occupation-0.813.028Stress Frequency Domain Educational Level3.785Stress Frequency Domain Gender-4.316.046RMSSD (ms) Stress Time Domain1.000LF/HF (AR) Stress Frequency Domain1.000LF/HF (FFT) Stress Frequency Domain0.269SDNN (ms) Stress Frequency Domain0.250TINN (ms) Stress Frequency Domain0.631.001
Discussion
The influence of sociodemographic parameters on stress in both time and frequency domains revealed several significant relationships. In the time-domain stress analysis, age had a substantial impact on stress levels (standardized coefficient = 1.070, p < 0.01, highly significant). This finding suggests that time-domain stress increases with advancing age. These results are consistent with previous studies, such as those by [[33], [34]], which reported a similar trend of stress levels increasing with age. Factors contributing to this pattern may include a decline in physical health, alterations in cognitive processes and responses to stress, and an increasing burden on daily responsibilities. Older individuals may experience elevated stress levels in traffic situations because of reduced physical resilience and heightened concerns regarding road safety. Additionally, education level significantly affected time-domain stress (standardized coefficient = 0.481, p < 0.01). While individuals with higher education levels tend to manage their time more efficiently, they remain susceptible to stress, particularly in scenarios that require complex decision making or the fulfillment of intricate responsibilities.
In the frequency domain, the number of motorcycles exhibited a highly significant positive correlation with stress levels (standardized coefficient = 3.495, p < 0.01). This association may be attributed to the increased responsibilities concomitant with multiple vehicle ownership. Additional motorcycles often necessitate higher maintenance expenditures, increased time allocation for upkeep, and logistical complexities, all of which contribute to elevated stress levels. Conversely, household income demonstrated a highly significant negative correlation with frequency-domain stress (standardized coefficient = −4.279, p < 0.01), these findings align with previous research by [35], indicating that elevated income levels correlate with decreased stress. This reduction in stress is likely attributable to the enhanced financial capacity of higher-income individuals to address stressors such as vehicle maintenance expenses or the challenges posed by suboptimal road conditions. Furthermore, increased income provides greater flexibility in managing unforeseen circumstances, thereby mitigating stress. These findings align with previous research by [36], which demonstrated a negative correlation between higher income levels and the risk of depression. This study indicates that increased financial resources contribute to the reduction of economic stressors and enhance access to resources that support mental well-being, thereby mitigating stress and other psychological burdens.
Occupations demonstrated a small but statistically significant negative impact on the frequency domain stress (standardized coefficient = −0.813, p < 0.05). This finding suggests that occupation may contribute to stress reduction, potentially because of the structure and routine it provides. However, the relatively minor effect size indicates that other factors, such as workload or work environment, may exert a more substantial influence on stress levels [37]. Conversely, educational level demonstrated a highly significant positive impact on frequency-domain stress (standardized coefficient = 3.785, p < 0.01). This finding suggests that individuals with higher educational attainment may experience increased cognitive demands or greater occupational responsibilities, which can increase their stress levels. Higher education frequently correlates with more complex tasks, increased responsibilities, and elevated expectations in both the professional and personal spheres, potentially contributing to heightened stress levels.
Gender also demonstrated a significant negative effect on frequency domain stress (standardized coefficient = −4.316, p < 0.05). In a sample comprising 60 % male and 40 % female respondents, the results indicated that male participants experienced lower levels of frequency domain stress compared to their female counterparts. This finding suggests that females may exhibit heightened sensitivity to stressors, such as road conditions or traffic situations, which is potentially attributable to variations in psychological resilience or societal expectations regarding safety. These findings align with prior research by [[25], [37]], which underscored the significant role of gender in influencing stress responses in comparable contexts.
Conclusions
This investigation identified a statistically significant correlation between drivers' socioeconomic factors and the stress levels experienced under varying road conditions. Stress was quantified using heart rate variability (HRV) indicators, including SDNN, RMSSD, TINN, and the LF/HF ratio, which reflect the balance between sympathetic and parasympathetic nervous system activities. The analysis revealed that variables such as age, gender, education level, occupation, trip purpose, and driving duration significantly influenced drivers' stress levels in both time and frequency domains. Variations in the average heart rate (HR) among drivers were correlated with stress levels, with elevated HR values generally indicating increased stress. The findings from the MIMIC model further corroborate the critical role of socioeconomic factors in influencing drivers' stress levels.
Future research could build upon these findings by conducting longitudinal studies to examine how drivers' stress levels evolve over time in response to changes in socioeconomic conditions, driving habits, and exposure to diverse road environments. Furthermore, external environmental factors, such as air quality, noise levels, and weather conditions, can complement heart rate variability (HRV)-based analyses. Expanding the study population to include a more diverse range of drivers, such as commercial, older, and novice drivers, would provide more comprehensive insights into the variations in stress responses across different demographic groups. Assessing the efficacy of targeted interventions, such as stress management training, driver assistance technologies, or road design modifications, could potentially contribute to the reduction of stress levels and the enhancement of safety. These findings emphasize the significance of incorporating socioeconomic considerations into traffic management policies and driver safety initiatives to formulate more effective strategies aimed at mitigating driver stress, improving safety, and optimizing road conditions.
Limitations
Not applicable.
Ethics statements
Attached. All participants provided written informed consent prior to participating in the study.
CRediT author statement
Iqra Mona Meilinda: Conceptualization, software, data curation, writing—original draft preparation, writing—review and editing, formal analysis. Sugiarto Sugiarto: Methodology, investigation, funding acquisition. Sofyan M. Saleh: Validation, funding acquisition, resources, supervision. Ashfa Achmad: Visualization, validation, project administration.
Declaration of competing interest
The authors declare that they have no known competing financial interests or personal relationships that could have appeared to influence the work reported in this paper.
The reference list from the paper itself. Each links out to its DOI / PubMed record.
- 1Magaña V.C.Pañeda X.G.Garcia R.Paiva S.Pozueco L.Beside and behind the wheel: factors that influence driving stress and driving behavior Sustainability 139202110.3390/su 13094775 · doi ↗
- 2Thwe P.P.Yamamoto T.Sato H.Morikawa T.Effect of roadway conditions and land-use on driving stress in Yangon, Myanmar Asian Transp. Stud.522018408422
- 3Thwe P.P.Yamamoto T.Sato H.Morikawa T.Analysis of driving stress on various roadway conditions in Myanmar by using heart rate variability Asian Transp. Stud.442017663679
- 4Meilinda I.M.Sugiarto S.Saleh S.M.Achmad A.Abubakar A.Preliminary analysis on heart rate (HR) and respiration rate (RR) of motorcyclists on urban arterial road AIP Conference Proceedings 2024 AIP Publishing
- 5Meilinda I.M.Sugiarto S.Saleh S.M.Achmad A.Abubakar A.Driving stress partial model considering time domain applying for two wheelers drivers: a case of primary arterial roads E 3S Web of Conferences 2024 EDP Sciences 01043
- 6Giannakakis G.Grigoriadis D.Giannakaki K.Simantiraki O.Roniotis A.Tsiknakis M.Review on psychological stress detection using biosignals IEEE Trans. Affect. Comput.1312019440460
- 7Lohani M.Payne B.R.Strayer D.L.A review of psychophysiological measures to assess cognitive states in real-world driving Front. Hum. Neurosci.132019573094102310.3389/fnhum.2019.00057 PMC 6434408 · doi ↗ · pubmed ↗
- 8Kaye S.-A.Lewis I.Freeman J.Comparison of self-report and objective measures of driving behavior and road safety: A systematic review J. Safety. Res.6520181411512977652310.1016/j.jsr.2018.02.012 · doi ↗ · pubmed ↗