A semidominant point mutation of Mediator tail subunit MED5b in Arabidopsis leads to altered enrichment of H3K27me3 and reduced expression of targets of MYC2
Jiaxin Long, Shelby Sliger, Zhi-Wei Luo, Pete E Pascuzzi, Clint Chapple, Joe Ogas

TL;DR
A single amino acid change in the Mediator complex of Arabidopsis affects chromatin modifications and gene expression, particularly of MYC2 targets.
Contribution
The study reveals a novel connection between Mediator subunit MED5b and H3K27me3 homeostasis in plants.
Findings
ref4-3 causes a modest global reduction of H3K27me3 at enriched loci.
MYC2 targets are enriched among genes with decreased expression in ref4-3.
Loss of MED25 suppresses the decreased expression of MYC2 targets in ref4-3.
Abstract
The Mediator complex coordinates regulatory input for transcription driven by RNA polymerase II in eukaryotes. reduced epidermal fluorescence4-3 (ref4-3) is a semidominant mutation that results in a single amino acid substitution in the Mediator tail subunit Med5b. Previous characterization of ref4-3 revealed altered expression of a variety of loci in Arabidopsis, including those contributing to phenylpropanoid biosynthesis. Examination of existing RNA-seq data indicated that loci enriched for the transcriptionally repressive chromatin modification H3K27me3 are overrepresented among genes that are misregulated in ref4-3. We used ChIP-seq and RNA-seq to examine the possibility that perturbation of H3K27me3 homeostasis in ref4-3 plants contributed to altered transcript levels. We observed that ref4-3 results in a modest global reduction of H3K27me3 at enriched loci and that this reduction…
Genes, proteins, chemicals, diseases, species, mutations and cell lines named across the full text — each resolved to its canonical identifier and authoritative record.
Click any figure to enlarge with its caption.
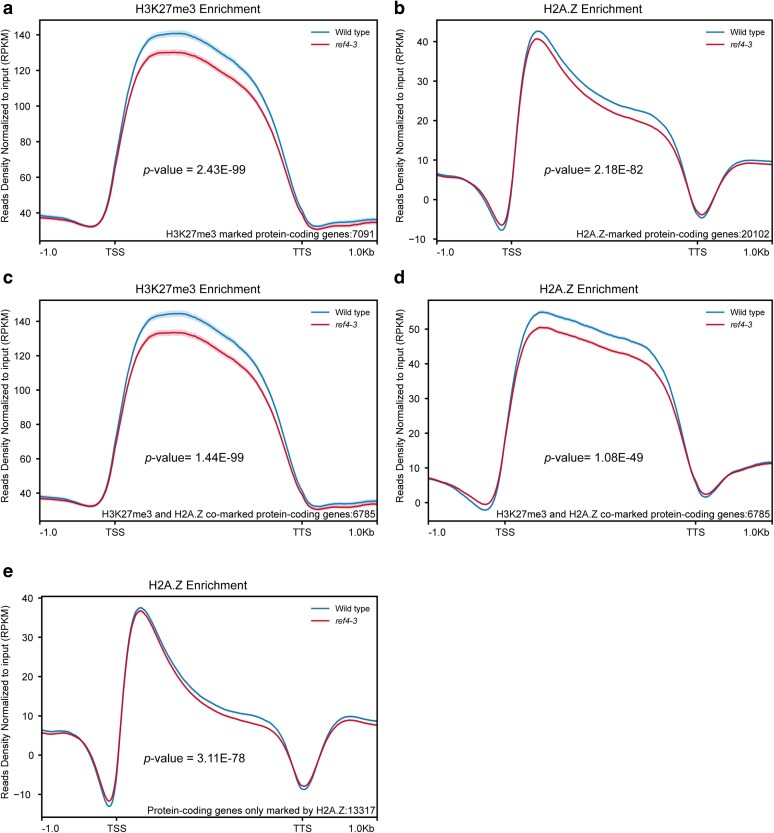 Fig. 1
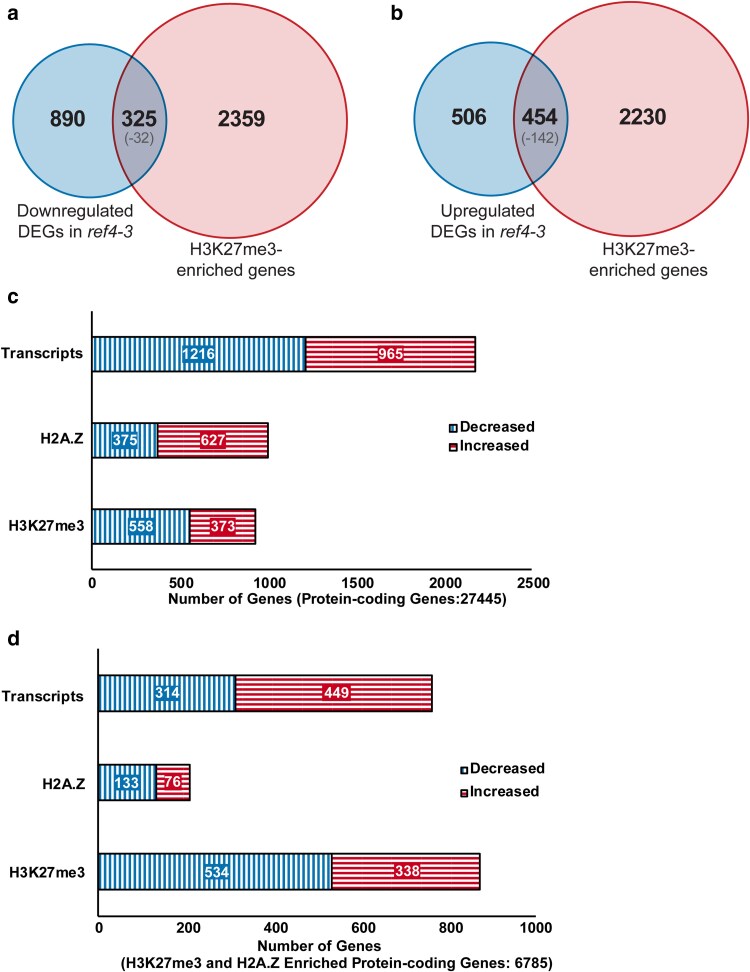 Fig. 2
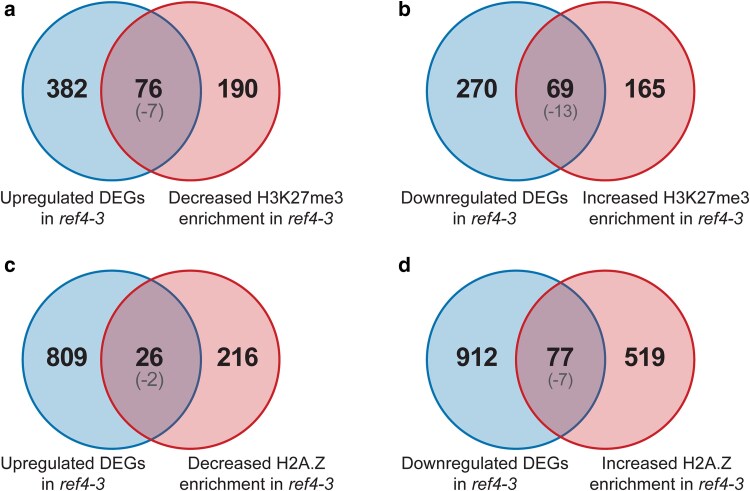 Fig. 3
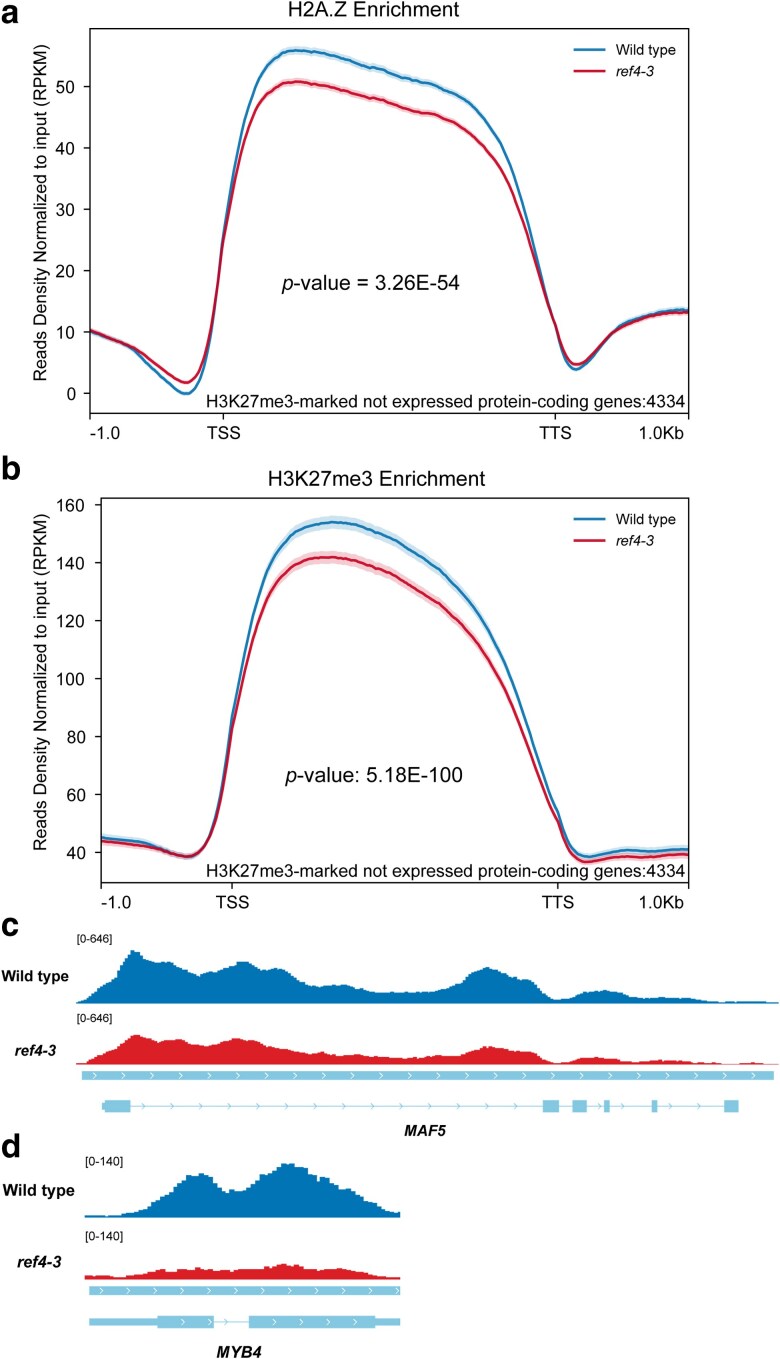 Fig. 4
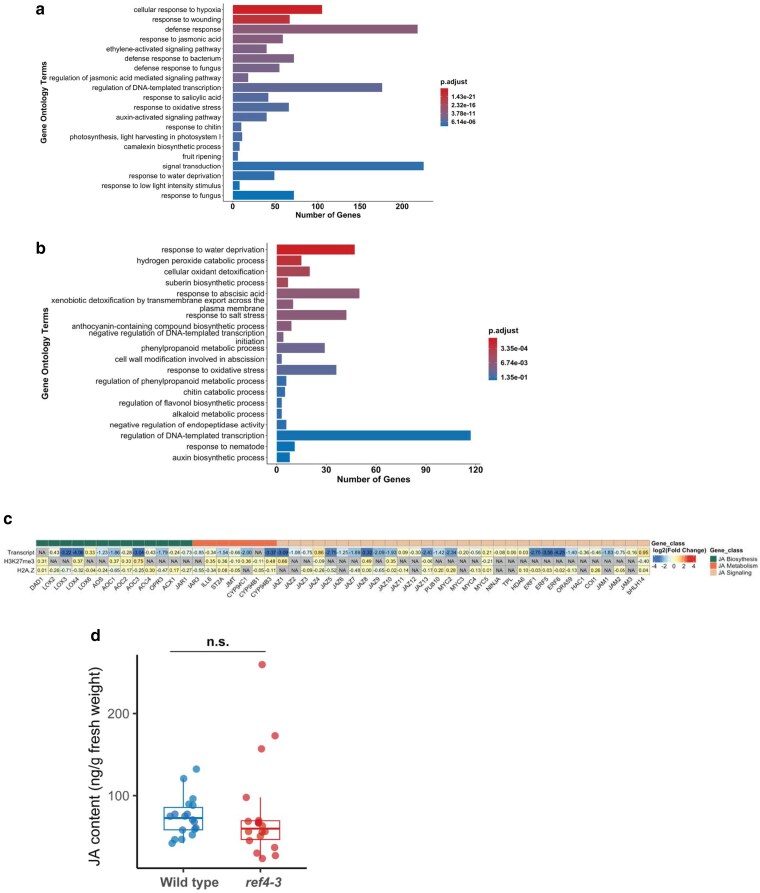 Fig. 5
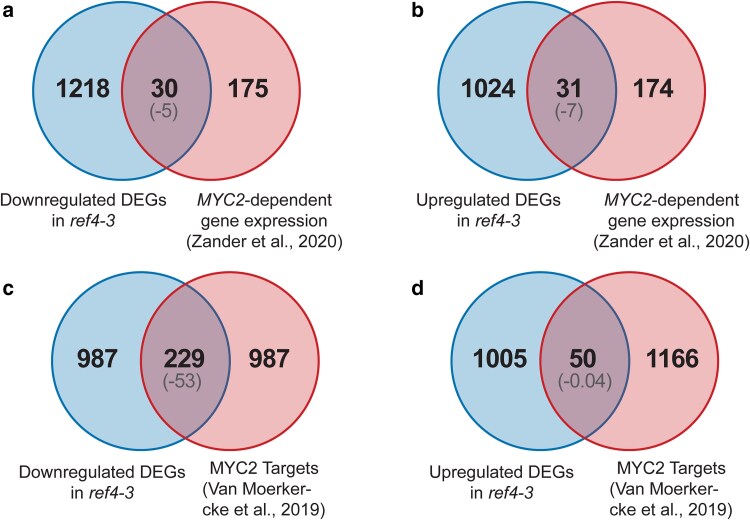 Fig. 6
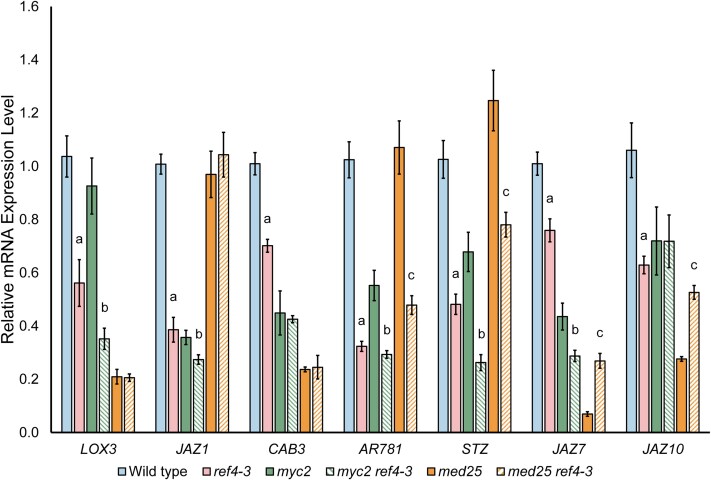 Fig. 7
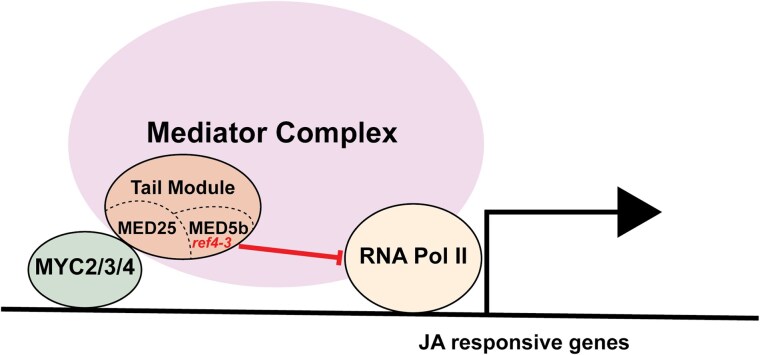 Fig. 8
| Gene set A | Number of set A | Gene set B | Number of set B | Predicted | Observed | Percentage of set A | Percentage of set B |
| Significance |
|---|---|---|---|---|---|---|---|---|---|
| Increased H2A.Z levels | 76 | Increased H3K27me3 levels | 338 | 3.79 | 28 | 37 | 8 | 6.34E−18 | *** |
| Increased H2A.Z levels | 76 | Decreased H3K27me3 levels | 534 | 5.98 | 6 | 8 | 1 | 0.56 | |
| Decreased H2A.Z levels | 133 | Increased H3K27me3 levels | 338 | 6.63 | 6 | 5 | 2 | 0.66 | |
| Decreased H2A.Z levels | 133 | Decreased H3K27me3 levels | 534 | 10.47 | 40 | 30 | 7 | 2.69E−14 | ** |
| Increased transcript levels | 458 | Increased H3K27me3 levels | 234 | 38.87 | 9 | 2 | 4 | 1.00 | |
| Increased transcript levels | 458 | Decreased H3K27me3 levels | 266 | 44.19 | 76 | 17 | 29 | 1.76E−07 | * |
| Decreased transcript levels | 339 | Increased H3K27me3 levels | 234 | 28.77 | 69 | 20 | 29 | 1.06E−13 | ** |
| Decreased transcript levels | 339 | Decreased H3K27me3 levels | 266 | 32.71 | 11 | 3 | 4 | 1.00 | |
| Increased transcript levels | 835 | Increased H2A.Z levels | 596 | 36.06 | 14 | 2 | 2 | 1.00 | |
| Increased transcript levels | 835 | Decreased H2A.Z levels | 242 | 14.64 | 26 | 3 | 11 | 3.18E−03 | * |
| Decreased transcript levels | 989 | Increased H2A.Z levels | 596 | 42.71 | 77 | 8 | 13 | 2.58E−07 | * |
| Decreased transcript levels | 989 | Decreased H2A.Z levels | 242 | 17.34 | 29 | 3 | 12 | 4.40E−03 | * |
| Gene set A | Number of set A | Gene set B | Number of set B | Predicted | Observed | Percentage of set A | Percentage of set B |
| Significance |
|---|---|---|---|---|---|---|---|---|---|
| Increased H2A.Z levels | 56 | Increased H3K27me3 levels | 222 | 4.65 | 22 | 39 | 10% | 1.02E−10 | * |
| Increased H2A.Z levels | 56 | Decreased H3K27me3 levels | 261 | 5.46 | 5 | 9% | 2% | 0.65 | |
| Decreased H2A.Z levels | 58 | Increased H3K27me3 levels | 222 | 4.81 | 6 | 10% | 3% | 0.35 | |
| Decreased H2A.Z levels | 58 | Decreased H3K27me3 levels | 261 | 5.66 | 20 | 34% | 8% | 1.82E−07 | * |
| Gene set A | Number of set A | Gene set B | Number of set B | Predicted | Observed | Percentage of set A | Percentage of set B |
| Significance |
|---|---|---|---|---|---|---|---|---|---|
| Increased H2A.Z levels | 20 | Increased H3K27me3 levels | 116 | 0.56 | 6 | 30 | 5 | 1.25E−05 | * |
| Increased H2A.Z levels | 20 | Decreased H3K27me3 levels | 273 | 1.33 | 1 | 5 | 0 | 0.75 | |
| Decreased H2A.Z levels | 75 | Increased H3K27me3 levels | 116 | 2.12 | 0 | 0 | 0 | 1.00 | |
| Decreased H2A.Z levels | 75 | Decreased H3K27me3 levels | 273 | 4.98 | 20 | 27 | 7 | 4.07E−08 | * |
- —National Science Foundation10.13039/501100008982
- —U.S. Department of Energy10.13039/100000015
Peer Reviews
No public reviews on file for this paper yet. If you reviewed it on a platform where reviews are public (OpenReview, ICLR, NeurIPS, ICML), you can paste yours below so the community can read it here.
Videos
No videos yet. Explain this paper in a talk, walkthrough, or lecture? Add one.
Taxonomy
TopicsPlant Molecular Biology Research · Plant Gene Expression Analysis · Photosynthetic Processes and Mechanisms
Introduction
Mediator is a conserved modular complex that coordinates regulatory information conveyed by transcription factors to RNA polymerase II (RNAPII) and is also a component of the preinitiation complex (PIC) that initiates RNAPII-driven transcription (Dolan and Chapple 2017; Malik et al. 2017; Chen et al. 2022; Richter et al. 2022). As such, it plays a critical role in integrating the diverse regulatory pathways that govern transcription at a multitude of loci in eukaryotes. Phylogenetic and structural analysis of Mediator in yeast and mammals reveals substantial evolution of this conserved complex. There are 21 Mediator subunits in the budding yeast Saccharomyces cerevisiae and 26 subunits in humans. Cryo-EM structural analysis in yeast (Robinson et al. 2015) and subsequently in humans (Abdella et al. 2021) and mice (Zhao et al. 2021) reveals 4 comparable modules: a head module, a middle module, a tail module, and a kinase module (Dotson et al. 2000; Richter et al. 2022). The structure of the yeast and vertebrate Mediator complexes are clearly distinguishable, however, consistent with the emergence of novel regulatory strategies for Mediator in these phyla. Further, although depletion or ablation of subunits in yeast indicates that the individual modules function independently in this organism, extensive interconnections between subunits of Mediator in human and mouse (Richter et al. 2022) suggest that the modules function in a more coordinated fashion in mammals.
In both yeast and animals, the 4 subunits of Mediator play distinct roles. The kinase module reversibly associates with the other 3 modules of Mediator to generate 2 distinct Mediator complexes, sometimes referred to as Mediator and CDK-Mediator, that have different regulatory properties (Luyties and Taatjes 2022). Association of the kinase module with Mediator blocks its interaction with RNAPII and thus assembly of PIC. Yet the kinase module also contributes to promoter escape of RNAPII and release of RNAPII from pausing during elongation (Luyties and Taatjes 2022), demonstrating the dynamic nature of Mediator during the various stages of transcription. The head and the middle module of mediator interact with RNAPII and general transcription factors directly, whereas the tail module recognizes gene-specific TFs and integrates signals from TFs for transcriptional regulation (Allen and Taatjes 2015; Yang et al. 2016; Chen et al. 2022; Richter et al. 2022).
Although the structure of a plant Mediator complex has yet to be reported, phylogenetic, genetic, and biochemical analyses to date are largely consistent with previous characterization of Mediator in yeast and animals (Buendia-Monreal and Gillmor 2016; Yang et al. 2016; Dolan and Chapple 2017; Malik et al. 2017; Agrawal et al. 2021; Leydon et al. 2021). Functional analysis of an extensive collection of mutations in Mediator subunits in Arabidopsis has linked Mediator to a wide range of transcriptional pathways in plants including those involved in abiotic and biotic stress, hormone signaling, development, and metabolism. Analysis of these mutants has also linked specific modules to transcriptional pathways in plants. Functional analysis of MED12 and MED13 of the kinase module, for example, links the kinase module to repression of seed maturation genes during early seedling growth (Chhun et al. 2016) as well as to activation of light-responsive genes and genes lacking chromatin features associated with robust expression (Liu et al. 2020).
Genetic characterization of the tail module of Mediator in Arabidopsis suggests a critical role in conferring regulatory information by transcription factors (Buendia-Monreal and Gillmor 2016; Yang et al. 2016; Mao et al. 2019b; Zhai et al. 2020; Chen et al. 2022). Mutations in tail subunits impact a wide variety of plant adaptive responses including plant defense, jasmonic acid (JA) signaling, phenylpropanoid biosynthesis, as well as cold and shade responses. Biochemical characterization of MED25 has identified over 20 transcription factors with which it interacts (Yang et al. 2016; Kazan 2017; Zhai et al. 2020) including MYC2 (Cevik et al. 2012; Chen et al. 2012; An et al. 2017; Zhai et al. 2020), strongly suggesting that this regulatory information is conveyed by direct interaction of transcription factors with tail subunits, contributing to either transcriptional activation or repression.
Previous characterization of MED5a and MED5b of the tail module of Mediator in Arabidopsis links both to homeostasis of transcriptional circuits associated with phenylpropanoid metabolism (Bonawitz et al. 2012). med5a med5b plants exhibit elevated transcript levels of genes associated with phenylpropanoid biosynthesis whereas a semidominant mutant allele of MED5b, ref4-3, exhibits constitutive repression of genes associated with phenylpropanoid biosynthesis. Intriguingly, mutation of genes encoding other subunits of the tail module, including MED2, MED16, and MED23, suppresses the transcript and metabolic phenotype of ref4-3, indicating that an intact tail module is required for ref4-3 to impair transcriptional regulation (Dolan et al. 2017).
We observed that genes enriched for the repressive epigenetic modification trimethylation of histone H3 lysine 27 (H3K27me3) are overrepresented in genes exhibiting altered expression in ref4-3 plants. To further examine the relationship between ref4-3 and H3K27me3, we undertook ChIP-seq and RNA-seq. Our data indicate that ref4-3 results in a reduction of H3K27me3 at many loci, including those with no detectable expression. This loss of H3K27me3 is likely to contribute to previously characterized ref4-3 phenotypes. Further, our data reveal a dramatic impact on a subset of transcriptional pathways directly mediated by MYC2. Our combined data raise the possibility that Mediator can contribute to chromatin features in a transcription-independent fashion and highlight the impact of changing a single amino acid of a Mediator tail subunit on a transcriptional circuit.
Materials and methods
Plant lines and growth conditions
Plants used in this study are all in the Columbia background. The previously characterized mutants used in this study are ref4-3, myc2 (SALK_017005), myc2 ref4-3, med25 (SALK_129555), and med25 ref4-3. The genotype of ref4-3 was confirmed by PCR followed by restriction digestion as described previously (Stout et al. 2008). The list of primers used for PCR verification for each allele is included in Supplementary Table 18. Plants used for RNA-seq, ChIP-seq, metabolite MS analysis, and qPCR were sown directly on soil in pots. Seeds were cold treated in dark at 4°C for 3 days before moving to a Percival AR75 growth chamber. Plants were grown under 16-h light/8-h dark photoperiod cycle at 150 μE light (Phillip F32T8/TL941) with far-red supplements (soft white 25 W incandescent light) at 22°C prior to sample collection. Samples for the following analyses were harvested 6 h after the light was turned on.
RNA extraction
Total RNA was extracted from 21-day-old shoot tissue of 5 plants that had not bolted and that were randomly selected from 5 individual pots using a RNeasy Plant Mini Kit (Qiagen; catalog no. 74904) following with the DNase I digestion and RNA cleanup included in an RNA Clean & Concentrator kit (Zymo Research; catalog no. 1014). Three biological replicates were collected for each indicated genotype.
Chromatin immunoprecipitation
Chromatin immunoprecipitation was performed as previously described (Carter et al. 2018) with minor modifications. Four grams of 21-day-old whole shoot tissue was collected for each replicate. Nuclear lysis buffer was replaced with 1.7 mL of ChIP Lysis Buffer [50 mM HEPES-NaOH (pH 7.4), 16.7 mM Tris-HCl (pH 8), 1 mM EDTA (pH 8), 150 mM NaCl, 0.1% SDS (w/v), 1% Triton X-100 (v/v), 0.1% sodium deoxycholate, 1 cOmplete mini tablet per 10 mL solution]. The total chromatin samples were sonicated using Bioruptor Pico. Sheared chromatin samples were stored at −80°C overnight prior to the immunoprecipitation. The following antibodies were used in the analysis: Anti-H3 (ab1791, Abcam) (1:200 dilution), Anti-H3K27me3 (07-449, Millipore) (1:100 dilution), and Anti-H2A.Z (1.5 µg for a 500 µL IP sample) (Deal et al. 2007). The QIAquick MinElute PCR purification kit was replaced with ChIP DNA Clean & Concentrator purification kit (D5205, Zymo Research) for elution of the ChIP DNA. The eluted ChIP DNA was quantified using a Qubit 2.0 Fluorometer and used immediately in library construction.
Library preparation and sequencing
cDNA library construction and ChIP DNA library construction were performed in house. One microgram of total RNA of each sample was used for cDNA library construction. cDNA library construction was performed using an NEBNext Ultra II Directional RNA Library Prep Kit (NEB; catalog no. E7760S) combined with an NEBNext Poly(A) mRNA Magnetic Isolation Module (NEB; catalog no. E7490S) according to the manufacturer's manual. 0.5 ng eluted ChIP DNA was used for each library construction. ChIP DNA libraries were constructed using a NEBNext Ultra II DNA Library Prep Kit (NEB; catalog no. E7645L) according to the manufacturer's manual. Illumina Multiplexing adapter was used for indexing. Paired-end 150-bp sequencing was performed using an Illumina NovaSeq S4 lane.
Differential expression analysis
About 70 million reads per sample were trimmed of adapter and polyG sequences using fastp (v 0.23.2) (Chen et al. 2018). The quality of the trimmed fastq files was examined using fastQC (v 0.12.1). The resulting fastq files mapped to the TAIR10 reference genome assembly (Pruitt et al. 2012) using hisat2 (v 2.2.1). The mapped SAM files were converted to BAM files using SAMtools (v 1.17) (Li et al. 2009). The mapped BAM files were sorted and indexed using SAMtools. The gene feature was counted in DESeq2 and limma packages in Bioconductor. Differentially expressed genes (DEGs) were identified using the Bioconductor edgeR package (v 3.42.4) (Robinson et al. 2010) with Fisher's exact test with a Benjamini–Hochberg false discovery rate (FDR) threshold of <0.05 and a fold change threshold > 2 (Robinson et al. 2010). Genes were annotated based on Araport 11 annotation (Cheng et al. 2017).
Enrichment and differential enrichment analyses
About 70 million reads per sample were trimmed of adapter and polyG sequences using fastp (v 0.23.2) (Chen et al. 2018). The quality of the trimmed fastq files was examined using fastQC (v 0.12.1). The trimmed fastq files mapped to the TAIR10 reference genome assembly (Berardini et al. 2015) using Bowtie2 (v 2.4.2) (Langmead and Salzberg 2012). The mapped SAM files were converted to BAM files using SAMtools (v 1.17) (Li et al. 2009). The resulting BAM files were filtered such that only proper pairs of the reads were kept for the following analysis. The filtered BAM files then sorted and indexed with SAMtools. For peak-finding, the BAM files were converted to paired-end BED files. Epic2 (v 0.0.52) (Stovner and Saetrom 2019) was used for peak-calling with the effective genome size equals to 0.85 and a bin size and gap size equals to 200 bp. There was high correlation between individual replicates (0.8 or greater for H2AZ and 0.9 or greater for H3K27me3), so the BAM files were merged to identify a final set of islands. The identified islands were converted to BED files for following analysis and visualization in IGV.
Identified epic2 islands of each modification in ref4-3 and wild-type plants were merged by union to determine the islands of interests. Genes marked by the chromatin-associated features were determined by the exhibiting a minimum 200 bp overlaps with the identified epic2 islands. The islands of interests were intersected with genes with a minimum 200 bp overlaps to decide the regions of interests. In general, genes intersected with a single H2AZ or H3K27me3 island, but 11% of identified genes intersected 2 or more H2AZ islands whereas 4% of identified genes intersected with 2 or more H3K27me3 islands. To determine ChIP-seq counts within these regions, the BAM files for each sample were used with the Bioconductor function summarizeOverlaps with the following arguments: mode = ”Union”, inter.feature = FALSE, ignore.strand = TRUE, singleEnd = FALSE, and fragments = FALSE. The resulting count matrix was used for differentially enrichment analysis. Genes that are differentially enriched for H3K27me3 and/or H2A.Z were identified using the Bioconductor edgeR package (v 3.42.4) with Fisher's exact test with a Benjamini–Hochberg FDR threshold of <0.05 and a fold change threshold > 1.2 (Robinson et al. 2010). Genes were annotated based on Araport11 annotation (Cheng et al. 2017).
Generation of metagene plots and heatmaps
The metagene plots and heatmaps were generated with deepTools2.0 (v 3.5.1). Indexed BAM files were converted to bigwig files using bamCompare. Reads per kilobase per million mapped reads (RPKM) was used as the normalization method, and the subtract operation was used to normalize the IP sample to its corresponding input DNA. The resulting bigwig files were converted to metagene plots and heatmaps using computeMatrix and plotProfile. Standard error for each metagene plot is indicated by shading of the trendline and was determined using –plotType se in the plotProfile function.
Jasmonic acid extraction
The extraction of JA was performed as previously described in Pan et al. (2010) with modifications. Whole shoot tissues of 3-week-old plants grown in different batches were pooled and immediately frozen in liquid nitrogen after harvesting. Leaf tissues were then ground into powder in liquid nitrogen and weighed. Extraction solvent, acidified isopropanol (isopropanol/H_2_O/concentrated HCl, 2:1:0.002, v/v/v), was added at a concentration of 100 mg fresh mass per milliliter along with 50 ng (±)-JA-d_5_ (Cayman Chemical) as the internal standard. Samples were extracted on a shaker at a speed of 15 r.p.m. for 30 min at 4°C. Then 0.55 mL extract was mixed with 1 mL dichloromethane and shaken for an additional 30 min at 4°C. Mixtures were then centrifuged at 13,000×g for 5 min at 4°C. About 900 μL solvent from the lower of 2 phases was transferred to a new tube and concentrated under nitrogen flow. Dried samples were stored at −20°C until analysis.
Jasmonic acid quantification by LC-MS/MS
Samples were redissolved in 100 μL methanol, and a 10 μL sample was injected into an Agilent 1290 Infinity II liquid chromatography (LC) system coupled to an Agilent 6470 series QQQ mass spectrometer (MS/MS, Agilent Technologies, Santa Clara, CA, USA) to quantify JA levels. For LC separation, an Agilent Eclipse Plus C18 2.1 mm × 50 mm, 1.8 µm column was used. The buffers were (A) water + 0.1% formic acid (v/v) and (B) acetonitrile + 0.1% formic acid. The linear LC gradient was as follows: time 0 min, 5% B; time 1 min, 5% B; time 10 min, 95% B; time 11 min, 95% B; time 11.1 min, 5% B; time 15 min, 5% B. The flow rate was 0.350 mL/min. Multiple reaction monitoring was used for MS analysis. (For JA, a precursor ion 209.2 to a product ion 59.3 transition was monitored at collision energy of 10 V and a transition from 209.2 to 41.3 was monitored at 40 V. For JA-d_5_, a transition from 214.3 to 62.3 was monitored at 10 V and a transition from 214.3 to 42.3 was monitored at 40 V.) Data were acquired in negative electrospray ionization (ESI) mode. The jet stream ESI interface had a gas temperature of 325°C, gas flow rate of 7 L/min, nebulizer pressure of 45 psi, sheath gas temperature of 250°C, sheath gas flow rate of 7 L/min, capillary voltage of 3,500 V in negative mode, and nozzle voltage of 1,000 V. The ΔEMV voltage was 400 V. Agilent Masshunter Quantitative analysis software was used for data analysis (v 10.1).
cDNA reverse transcription and quantitative real-time PCR analysis
Total RNA of 3 biological replicates of wild-type, ref4-3, myc2, myc2 ref4-3, med25, and med25 ref4-3 plants were collected for quantitative gene expression analysis. Two micrograms of total RNA was used for cDNA reverse transcription with an M-MLV Reverse Transcriptase kit according to the manufacturer's protocol. qPCR was performed using PowerUp SYBR Green Master Mix. The qPCR thermal cycle was performed according to the manufacture's manual. Oligonucleotide primers used for quantification of gene expression were included in Supplementary Table 18. CT values were recorded by Applied Biosystems software. 18S was used as the housekeeping gene for normalization. For each biological replicate, there are 4 ΔCT values computed by reciprocally subtracting the CT values of 18S from the CT values of the gene of interest with their corresponding technical replicates. The ΔΔCT values were calculated by subtracting the average ΔCT of WT for the gene of interest from the ΔCT value of the experimental condition and gene of interest. Fold changes were calculated using the formula 2^−ΔΔCT^. Standard error of the fold changes for each genotype was calculated.
Results
ref4-3 plants exhibit global reduction of H3K27me3
Previous RNA-seq analysis of ref4-3 plants revealed large numbers of genes with altered transcript levels (Dolan et al. 2017; Mao et al. 2019a). Given the extensive developmental phenotypes associated with the presence of ref4-3 (Stout et al. 2008; Wang et al. 2020), we examined whether genes enriched for the histone modification H3K27me3, which restricts expression of many genes associated with differentiation and development (Bouyer et al. 2011; Mozgova and Hennig 2015; Shen et al. 2021), are overrepresented in genes exhibiting altered transcript levels in ref4-3 plants and found this to be the case (Supplementary Fig. 1). This observation raised the possibility that ref4-3 perturbs H3K27me3 homeostasis and/or H3K27me3-mediated gene repression.
To characterize the effect of ref4-3 on H3K27me3-associated processes, we undertook ChIP-seq and RNA-seq analysis of wild-type and ref4-3 plants. In addition to H3K27me3, we also used ChIP-seq to examine enrichment of H2A.Z, a chromatin mark that is also typically found at H3K27me3-marked genes (Sequeira-Mendes et al. 2014; Carter et al. 2018; Gomez-Zambrano et al. 2019). The resulting ChIP-seq data are consistent with previous analyses. We identified 8,286 genes that are marked by H3K27me3 and 22,249 genes that are marked by H2A.Z in either wild-type or ref4-3 plants (Supplementary Tables 1–4). Eighty-seven percent of previously identified H3K27me3-enriched genes were also identified by our analysis (Zhou et al. 2017). Similarly, 80% of previously identified H2A.Z-marked genes were also observed as H2A.Z-marked genes in our analysis (Wollmann et al. 2017).
To investigate whether ref4-3 perturbs the global enrichment of H3K27me3 and/or H2A.Z, we generated metagene plots of H3K27me3 and H2A.Z ChIP-seq signals. The metagene plots of H3K27me3 (Fig. 1a) reveal a modest reduction of H3K27me3 levels for H3K27me3-enriched genes in ref4-3 plants. We also observed a similarly modest reduction of H2A.Z enrichment at H2A.Z-marked genes in ref4-3 plants (Fig. 1b). Use of ranked heatmaps to depict these analyses indicates that these trends represent similar effects on most genes rather than larger effects on relatively few genes (Supplementary Fig. 2a and b).
The pattern of H3K27me3 and H2A.Z enrichment is altered in ref4-3 plants. Metagene profiles derived from current ChIP-seq analysis were used to examine the impact of ref4-3 on a) average H3K27me3 enrichment level for H3K27me3-marked protein-coding genes; b) average H2A.Z enrichment level for H2A.Z-marked protein-coding genes; c) average H3K27me3 enrichment level from protein-coding genes that are marked by both H3K27me3 and H2A.Z; d) average H2A.Z enrichment level from protein-coding genes that are marked by both H3K27me3 and H2A.Z; and e) average H2A.Z enrichment level from protein-coding genes that are only marked by H2A.Z. In the metagene profiles, RPKM are generated as described in “Materials and methods” and are representative of merged 2 independent biological replicates of each genotype in which the IP sample of the mark of interest is normalized to its corresponding input DNA. RPKM values are plotted with respect to gene regions that are scaled to 2,500 bp on the x-axes. The total number of genes that are included in each plot is indicated in the lower right corner. Biological samples were obtained from the shoot tissue of 21-day-old plants grown under a 16-h light/8-h dark photoperiod cycle. The standard error associated with each analyzed genomic region depicted on the trend line is indicated by the shading surrounding each line. In addition, the significance of the difference in the average level of chromatin-associated features in wild-type and ref4-3 plants was determined by a paired sample t-test and is indicated on each plot. TSS, transcription start site; TTS, transcription termination site.
The observation that H3K27me3 is often colocalized with H2A.Z in plants (Sequeira-Mendes et al. 2014) in conjunction with other data (Carter et al. 2018) raises the prospect that H2A.Z contributes to H3K27me3 homeostasis in some fashion. Consistent with previous analyses, we observed that over 87% of H3K27me3-marked genes are also marked by H2A.Z in wild-type plants (Sequeira-Mendes et al. 2014; Carter et al. 2018). To characterize how ref4-3 contributes to enrichment of H3K27me3 and H2A.Z in a similar chromatin context, we examined enrichment of these marks specifically in genes in which both marks are present (Supplementary Table 5). Metagene profiles of the 6,785 protein-coding genes that are enriched for both H3K27me3 and H2A.Z reveal a comparable reduction for both of these features (Fig. 1c and d). In contrast, similar analysis of H2A.Z abundance at genes that are only marked by H2A.Z reveals a much more modest reduction of H2A.Z (but still significant based on standard error and statistical analysis) (Fig. 1e). Ranked heatmaps again indicate that these trends represent similar effects on most genes (Supplementary Fig. 2c–e). These data indicate that ref4-3 preferentially impacts H2A.Z enrichment in the context of H3K27me3, consistent with the hypothesis that the presence of ref4-3 perturbs H3K27me3 homeostasis and with the hypothesis that H2A.Z and H3K27me3 are functionally linked in some fashion at H3K27me3-enriched loci.
Reduction of H3K27me3 in ref4-3 plants is associated with altered transcript levels and is observed at loci that are not expressed
Our RNA-seq data enabled us to examine the possible contribution of perturbed H3K27me3 enrichment to altered transcript levels in ref4-3 plants and to address the possibility that ref4-3 affects H3K27me3 enrichment at some loci in a transcription-independent fashion. Given the association of Mediator with Pol II-transcribed genes, we used a gene-centric approach by applying the RNA-seq-based method edgeR (Robinson et al. 2010; Wu et al. 2015; Eder and Grebien 2022) to our ChIP-seq analysis. Our intent in using this approach was to examine the relationship between altered levels of the chromatin marks H3K27me3 and H2A.Z and altered transcript levels specifically at transcribed loci of interest.
Our integrated analysis revealed not only a sizable perturbation of the transcriptome, as has been previously described (Dolan et al. 2017; Mao et al. 2019a), but also that chromatin-based features likely contribute to that perturbation. We observed that genes enriched for H3K27me3 are overrepresented in genes exhibiting altered transcript levels in ref4-3 plants (Fig. 2a and b), which is consistent with the relationship we observed using previously published data (Supplementary Fig. 1). Our RNA-seq analysis of wild-type and ref4-3 plants revealed a total of 2,181 DEGs (Fig. 2c; Supplementary Tables 6 and 7). In addition, we identified a total of 1,002 genes that are differentially enriched for H2A.Z and 931 genes that are differentially enriched for H3K27me3 in ref4-3 plants relative to wild-type plants in the ChIP-seq analysis (Fig. 2c; Supplementary Tables 8–11) demonstrating that ref4-3 has a sizeable impact on these chromatin features as suggested by our metagene plots (Fig. 1). Consistent with these plots, more protein-coding genes exhibit decreased H3K27me3 levels than increased (Fig. 2c, 558 vs 373) (Supplementary Tables 8 and 9). In contrast, we identified more protein-coding genes with increased H2A.Z than decreased (Fig. 2c, 627 vs 375) (Supplementary Tables 10 and 11) when examining all protein-encoding genes with a cutoff of 1.2-fold change.
Analysis of genes that are differentially expressed or differentially enriched for H2A.Z or H3K27me3 in ref4-3 plants. Venn diagrams indicating the intersection between genes identified in our RNA-seq analysis as exhibiting decreased a) or increased b) transcript levels in ref4-3 relative to wild-type plants and genes identified by our ChIP-seq analysis as H3K27me3 enriched. The log10(P-value) for each intersection analysis is indicated in the parentheses. Fisher's exact test was used for the statistical analysis. Total number of differentially expressed or differentially enriched genes for H2A.Z or H3K27me3 in ref4-3 plants are indicated c) out of the set of TAIR10 annotated protein-coding genes and d) out of the set of TAIR10 annotated protein-coding genes that are marked by both H3K27me3 and H2A.Z in either wild-type or ref4-3 plants. Transcripts, genes that are differentially expressed in RNA-seq analysis in ref4-3 relative to wild-type plants. H2A.Z, genes that are differentially enriched for H2A.Z in ChIP-seq analysis. H3K27me3, genes that are differentially enriched for H3K27me3 in ChIP-seq analysis. The total number of genes queried in each analysis is indicated in the parentheses.
Metagene plots reflect average enrichment of a feature at a given set of loci. As averages, they do not reveal the absolute number of genes exhibiting an increase or a decrease or the magnitude of the change at a specific locus, nor do they uncover possible discrete populations of genes exhibiting distinct patterns of enrichment. We therefore constrained our analysis of differential enrichment of H3K27me3 and H2A.Z by examining only those protein-encoding genes enriched for both H3K27me3 and H2A.Z, thus using the same set of genes that we did for Fig. 1c and d. Using this set of genes, we observed a relationship that was consistent with that depicted in those metagene plots: a greater number of genes exhibit decreased H3K27me3 enrichment than increased and, similarly, a greater number of genes exhibit decreased H2A.Z enrichment than increased (Fig. 2d). Nonetheless, it is evident that ref4-3 results in a range of impacts on these chromatin features at protein-encoding genes.
We examined our RNA-seq data to determine the extent to which the observed perturbation of H3K27me3/H2A.Z (Fig. 1) predicted the transcript phenotype of ref4-3 plants. In total, 35% of DEGs are enriched for H3K27me3 and H2A.Z (763 of 2,181 genes) whereas only 25% of total protein-coding genes are marked by both H3K27me3 and H2A.Z (6,785 of 27,445 genes) (Fig. 2d). To further examine the relationship between H3K27me3 and H2A.Z enrichment and gene expression, we undertook intersection analyses of genes that are differentially expressed and genes that are differentially enriched for H3K27me3 and/or H2A.Z in ref4-3 plants relative to wild-type plants (Fig. 3). We observed a modest overrepresentation of genes that exhibit decreased H3K27me3 and/or H2A.Z with genes that exhibit increased transcript levels. Similarly, there was modest overrepresentation of genes that exhibit increased levels of these marks with genes that exhibit decreased transcript levels. Further, scatter plot analysis of log_2_ fold change in transcript levels vs log_2_ fold change of H3K27me3 (Supplementary Fig. 3a) or of H2A.Z (Supplementary Fig. 3b) in ref4-3 vs wild-type plants reveals a modest negative correlation between changes in H2A.Z or H3K27me3 and transcript levels. These analyses suggest that a limited portion of the transcript phenotype observed in ref4-3 plants is likely to be directly due to altered levels of H3K27me3 and/or H2A.Z.
Intersection analyses of genes that exhibit differential expression and/or differential enrichment of H3K27me3 or H2A.Z in ref4-3 plants. Venn diagrams indicating the intersection between protein-coding genes exhibiting a) increased transcript levels and decreased H3K27me3 enrichment, b) decreased transcript levels and increased H3K27me3 enrichment, c) increased transcript levels and decreased H2A.Z enrichment, and d) decreased transcript levels and increased H2A.Z enrichment in ref4-3 relative to wild-type plants. Only genes that were expressed and enriched for the mark of interest (H3K27me3 or H2A.Z) in wild-type or ref4-3 plants were included in this analysis. The log10(P-value) for each intersection analysis is indicated in the parentheses. Fisher's exact test was used for the statistical analysis.
It is well known that H3K27me3 enrichment at a given locus is anticorrelated with expression of that locus (Zhang et al. 2015b; Wiles and Selker 2017; Shen et al. 2021). The preceding analyses were thus consistent with an indirect effect of ref4-3 on H3K27me3 enrichment that aligns with the canonical role of Mediator in gene expression: a mutation of a Mediator tail subunit would be predicted to alter expression of affected loci, leading to altered H3K27me3 enrichment as an indirect effect of altered gene expression. We explicitly analyzed the impact of ref4-3 on enrichment of H3K27me3 and H2A.Z at H3K27me3-enriched loci that are not detectably expressed to test the hypothesis that altered H3K27me3 enrichment at a gene in ref4-3 plants is not dependent on altered expression of that gene (Fig. 4a and b). The resulting metagene plots clearly demonstrate an overall reduction of both H3K27me3 and H2A.Z at H3K27me3-marked loci that are not expressed at a detectable level. The corresponding heatmaps again indicate that these trends are associated with similar effects on most genes (Supplementary Fig. 4). Importantly, expression of genes coding for factors previously linked to H3K27me3 homeostasis such as PRC2 and histone H3K27 demethylases is not altered in ref4-3 plants (Supplementary Fig. 5). These findings indicate that ref4-3 (most likely in the context of the Mediator complex) can act in a transcription-independent fashion to alter H3K27me3 and H2A.Z at H3K27me3-enriched loci.
H3K27me3 and H2A.Z enrichment is reduced in ref4-3 plants at nonexpressed loci. Metagene profiles were used to examine the impact of ref4-3 on a) average H3K27me3 enrichment level and b) average H2A.Z enrichment level at nonexpressed protein-coding genes marked with H3K27me3. Representative ChIP-seq genome browser views of H3K27me3 enrichment depict c) MAF5, a gene identified as H3K27me3-enriched that exhibits decreased H3K27me3 and increased transcript levels in ref4-3, and d) MYB4, a gene that is not identified as H3K27me3-enriched but also exhibits decreased H3K27me3 levels and increased transcript levels in ref4-3. Enrichment for H3K27me3 is normalized to the input for c) and d). The range of RPKM values in c) and d) after autoscaling is indicated in the top left corner. In the metagene profiles, RPKM are generated as described in “Materials and methods” and are representative of merged 2 independent biological replicates of each genotype in which the IP sample of the mark of interest is normalized to its corresponding input DNA. RPKM values are plotted with respect to gene regions that are scaled to 2,500 bp on the x-axes. The total number of genes that are included in each plot is indicated at the lower right corner. Data are representative of merged 2 independent biological replicates for either 21-day-old wild-type or ref4-3 plants. The standard error associated with each analyzed genomic region depicted on the trend line is indicated by the shading surrounding each line. In addition, the significance of the difference in the average level of chromatin-associated features in wild-type and ref4-3 plants was determined by a paired sample t-test and is indicated on each plot. TSS, transcription start site; TTS, transcription termination site.
The altered distribution of H2A.Z and H3K27me3 in ref4-3 plants presents a novel context in which to examine the relationship between these modifications. Analysis of the intersection between genes exhibiting altered H3K27me3 and/or H2A.Z in ref4-3 plants (Tables 1–3) reveals a robust positive correlation between altered enrichment of these features regardless of the expression status of the locus (above or below the limit of detection as determined by RNA-seq). Based on the consistency of this correlation, we propose ref4-3 preferentially impacts a chromatin state that is defined in part by both H3K27me3 and H2A.Z. Chromatin states defined in part by the presence of these features have been previously identified (Sequeira-Mendes et al. 2014; Jamge et al. 2023). The positive correlation is also consistent with the proposed role for H2A.Z in deposition of H3K27me3 (Carter et al. 2018).
Previously characterized metabolic and development phenotypes of ref4-3 may result from a chromatin-based mechanism
Examination of expression of genes associated with the phenylpropanoid biosynthetic pathway and of genes characterized as regulators of phenylpropanoid and secondary cell wall biosynthesis revealed an impact of ref4-3 similar to that previously characterized (Supplementary Tables 12 and 13) (Dolan et al. 2017; Mao et al. 2019a). In particular, we observed genes associated with phenylpropanoid biosynthesis generally exhibited decreased transcript levels in ref4-3 plants, including genes associated with early steps in the phenylpropanoid pathway such as PAL (PHE ammonia lyase), C4H (cinnamate-4-hydroxylase), 4CL (4-coumarate:CoA ligase), HCT (hydroxycinnamoyl-CoA shikimate/quinate hydroxycinnamoyl transferase), and C3'H (coumarate 3-hydroxylase) and genes that contribute to transcriptional and posttranslational regulation, such as MYB4 (Supplementary Tables 12 and 13). Similarly, we observed that genes associated with flavonoid biosynthesis or transcriptional regulation are generally increased in ref4-3 plants as observed previously (Supplementary Table 14).
A gene ontology (GO) analysis of genes exhibiting altered enrichment of H3K27me3 did not reveal an enrichment in genes associated with the phenylpropanoid or flavonoid biosynthesis (Supplementary Table 15). This finding was not unanticipated in light of the substantial portion of the transcript phenotype that is not associated with altered H3K27me3 enrichment (Fig. 3). Nevertheless, we undertook a candidate gene approach to explore the possible contribution of altered H3K27me3 enrichment to previously characterized ref4-3 transcript and developmental phenotypes. The candidates included MYB4, a transcriptional regulator that plays a broad role in the regulation of genes associated with flavonoid biosynthesis (Jin et al. 2000; Wang et al. 2020) and that exhibits elevated expression in ref4-3 plants as previously observed (Supplementary Table 13).
Although MYB4 was not identified as an H3K27me3-enriched locus by our bioinformatic pipeline due to the stringent selection criteria (see “Materials and methods”), visual inspection of H3K27me3 enrichment at MYB4 in wild-type and ref4-3 plants clearly reveals a decrease of H3K27me3 that is comparable to that observed at MAF5, which was identified as a locus exhibiting differential enrichment of H3K27me3 by our analysis (Fig. 4c and d). High signal thresholds for calling a locus enriched for a chromatin feature result in robust reproducible signals but can result in false negatives (Nakato and Sakata 2021; Eder and Grebien 2022). Importantly, mutation of MYB4 in ref4-3 plants contributes to increased expression of genes associated with phenylpropanoid biosynthesis, increased levels of anthocyanin and proanthocyanidin, and an amelioration of developmental phenotypes observed in ref4-3 plants (Wang et al. 2020). Further, the transcript level of MYB4 is increased 2.8-fold in clf swn plants that lack H3K27 histone methyltransferases that act in the shoot to generate H3K27me3 (Shu et al. 2019). Combined, these observations are consistent with a model in which elevated expression of MYB4 in ref4-3 plants and the ensuing phenotypic consequences result from reduced H3K27me3 at MYB4, a mechanism of action that is consistent with the impact of ref4-3 on H3K27me3 enrichment at numerous other loci (Fig. 2).
ref4-3 impairs expression of MYC2-dependent genes
GO term enrichment analysis of DEGs in ref4-3 revealed overrepresentation of pathways in ref4-3 plants similar to those identified previously, including pathways associated with phenylpropanoid metabolic processes, response to salicylic acid, and flavonoid biosynthesis (Fig. 5a and b; Supplementary Table 16). It is worth highlighting that the enrichment in genes associated with flavonoid biosynthesis is consistent with our observed transcript (Supplementary Table 13) and H3K27me3 enrichment phenotype (Fig. 4d) for MYB4. We also observed a striking overrepresentation of downregulated genes associated with JA response and regulation by JA as well as JA-associated processes such as defense response and wounding (Wasternack and Song 2017; Hewedy et al. 2023).
Expression of genes associated with JA biosynthesis and response are misregulated in ref4-3 plants. a) GO enrichment analysis of genes that exhibit decreased transcript levels in ref4-3 plants. b) GO enrichment analysis of genes that exhibit increased transcript levels in ref4-3 plants. c) Relative expression and enrichment of H3K27me3 and H2A.Z of JA-associated genes in ref4-3 plants. d) JA abundance in 3-week-old shoot tissue (n = 18) in different genetic backgrounds. JA content was determined by calculating the relative peak area ratio to the known amount of internal standard (JA-d5) added before metabolite extraction and then normalized to the fresh weight of tissue. Quantification was repeated twice, and the representative data are shown here. The significance of the difference in JA levels between wild type and ref4-3 was determined by Welch's t-test (2-tail). n.s. denotes not significant.
In light of this distinctive transcriptome phenotype, we examined the overlap of the genes that we identified as differentially expressed in ref4-3 plants with another set of genes that were previously identified as differentially expressed in ref4-3 plants (Dolan et al. 2017) (Supplementary Fig. 6a and b). Although this analysis revealed significant overlap, 62% of genes (419 of 681) that we identified as exhibiting increased expression in ref4-3 plants were not identified previously (Supplementary Fig. 6a). Additionally, 82% of genes (852 of 1,037) that we identified as exhibiting decreased expression were also not identified previously (Supplementary Fig. 6b). To further investigate the basis of our transcript phenotype, we undertook multidimensional scaling (MDS) analysis to compare our data to 2 previous RNA-seq analyses of ref4-3 plants which did not exhibit such a dramatic perturbation of the JA-associated transcriptome (Dolan et al. 2017; Mao et al. 2019a). This comparison revealed that the 3 data sets clustered by experimental condition rather than by genotype (Supplementary Fig. 6c). MDS analysis of these 3 RNA-seq analyses thus indicates that the growth condition of a given experiment has a substantial impact on the wild-type transcriptome, which then represents a distinct “ground state” for examining the effect of ref4-3 on transcript levels (and possibly chromatin states as well). Although plants in all 3 analyses were grown under a typical long-day regimen of a 16-h light/8-h dark photoperiod, they were harvested at slightly different ages and were grown in different chambers using different light sources and under different light intensities (Supplementary Fig. 6c). Our MDS analysis strongly suggests that one or more of these experimental variables can have a substantial impact on the transcriptome of wild-type plants, which in turn likely alters the impact of a genetic perturbation on that transcriptome.
Our analysis of ref4-3 plants under our growth conditions revealed a wide-ranging alteration of JA-associated gene expression that is not strongly associated with a particular change in chromatin state in ref4-3 plants, including decreased transcript levels for genes that play critical roles in JA biosynthesis, regulation of JA signaling, and response to JA in ref4-3 plants (Fig. 5c; Supplementary Table 17). We analyzed JA content in whole shoot tissue of wild-type and ref4-3 plants by LS-MS to test the hypothesis that this transcript phenotype reflected altered JA homeostasis in ref4-3 plants. We observed that ref4-3 plants maintain JA levels that are indistinguishable from wild-type plants (Fig. 5d), suggesting that another process contributed to altered expression of these loci.
MYC2 plays a key role in transcriptional regulation of a variety of processes in plants, including those associated with JA homeostasis (Wang et al. 2017; Van Moerkercke et al. 2019; Zhang et al. 2020). Intriguingly, we observed that transcript levels of MYC2 are decreased 5-fold in ref4-3 plants, suggesting that reduced expression of MYC2 contributed to the transcript phenotype (Fig. 5c). We observed a relatively small overlap, however, between genes that are misregulated in ref4-3 plants and genes that were previously identified as exhibiting altered transcript levels in myc2 plants (Zander et al. 2020) (Fig. 6a and b). Loss of MYC2 has previously been shown to result in a modest transcript phenotype, which likely reflects functional overlap with MYC3 and MYC4, which code for related transcription factors that act in common transcriptional circuits with MYC2 (Fernandez-Calvo et al. 2011; Wang et al. 2017; Zander et al. 2020; Zhang et al. 2020). To test the hypothesis that ref4-3 specifically alters expression of genes that are direct targets of MYC2 independently of a requirement for MYC2-dependent expression, we examined the intersection between genes that are misregulated in ref4-3 and genes that were previously characterized by ChIP-seq as direct targets of MYC2 (Van Moerkercke et al. 2019). We observed that ref4-3 impaired expression of a substantial subset of these genes (229 of 1,216 downregulated genes, P-value < 10^−53^) (Fig. 6c and d), consistent with the hypothesis that the presence of a MYC2-binding site conferred ref4-3-associated transcriptional inhibition at a number of loci.
Direct targets of MYC2 are greatly overrepresented among downregulated genes in ref4-3 plants. Venn diagrams indicating the intersection between genes that are a) downregulated in ref4-3 and exhibit altered expression in myc2 plants (Zander et al. 2020); b) upregulated in ref4-3 and exhibit altered expression in myc2 plants (Zander et al. 2020); c) downregulated in ref4-3 and direct targets of MYC2 (Van Moerkercke et al. 2019); and d) upregulated in ref4-3 and direct targets of MYC2 (Van Moerkercke et al. 2019). The log10(P-value) for each intersection analysis is indicated in the parentheses. Fisher's exact test was used for the statistical analysis.
MED25 is necessary for ref4-3-dependent inhibition of expression of targets of MYC2
Our data suggested that ref4-3 preferentially acts to impair expression of some Myc2 protein (MYC2) targets in a MYC2-dependent fashion via MYC2-dependent recruitment of Mediator containing the altered MED5b subunit. To test this hypothesis, we investigated whether the loss of MYC2 in ref4-3 plants suppressed the transcript phenotype of MYC2 targets by using RT-qPCR to examine transcript levels in wild-type, ref4-3, myc2, and ref4-3 myc2 plants. For this analysis, we selected a panel of 7 genes that exhibited decreased expression in ref4-3 plants and were direct targets of MYC2 (Van Moerkercke et al. 2019). All 7 selected genes exhibited reduced transcript levels in ref4-3 relative to wild-type plants in the RT-qPCR analysis, in agreement with our RNA-seq analysis (Fig. 7). Loss of MYC2 had a modest impact on reduced transcript levels associated with ref4-3: only 2 genes (CAB3 and JAZ10) exhibited no detectable decrease in expression in myc2 ref4-3 vs myc2 plants, whereas ref4-3 still impaired expression of the other 5 genes in myc2 plants. These data thus indicate that MYC2 is not necessary for ref4-3 to impair expression of direct targets of MYC2.
Mutation of MED25 can alleviate inhibition of MYC2-targeted genes in ref4-3 plants. RT-qPCR analysis was used to examine the impact of ref4-3 on the relative expression of MYC2 target genes in the absence of MYC2 or MED25. Transcript levels are normalized to the expression in wild-type plants, and 18S was used as a reference gene. Data points are the average of 3 biological replicates. The statistically significant level of gene expression was determined with Student's t-test (2-tail). Letters indicate the specific comparison exhibits a P < 0.05 at the examined locus. a, ref4-3 plants relative to wild-type plants; b, myc2 ref4-3 plants relative to myc2 plants; c, med25 ref4-3 plants relative to med25 plants.
As noted above, MYC2 acts in common transcriptional circuits with MYC3 and MYC4 (Fernandez-Calvo et al. 2011; Gao et al. 2016). MYC2 can form heterodimers with MYC3 and MYC4, and MYC3 exhibits DNA binding specificity that is indistinguishable from MYC2 in vitro (Fernandez-Calvo et al. 2011). RNA-seq analysis of myc2 plants has previously revealed a relatively modest transcript phenotype relative to the number of MYC2 binding sites in the absence of JA treatment (Zander et al. 2020). Analysis of the transcript levels of our panel of selected genes similarly reveals a similarly modest impact on transcript levels associated with loss of MYC2 as 5 out of 7 selected genes exhibit less than a 2-fold reduction in transcript levels in myc2 plants (Fig. 7, myc2 vs wild type). Critically, MYC2, MYC3, and MYC4 all interact with MED25 (Cevik et al. 2012; Zhang et al. 2015a; Takaoka et al. 2022), and this interaction is considered to be a key mechanism by which Mediator is recruited to MYC2/3/4-dependent loci.
Given the functional redundancy of MYC2/3/4 and the common interaction of these transcription factors with MED25, we examined whether loss of MED25 could abrogate the MYC2-associated transcript phenotype of ref4-3. We examined the transcript level of the same panel of genes in med25 and ref4-3 med25 lines. We observed that in 5 out of the 7 genes, ref4-3 no longer impaired expression in the context of med25. Three of the genes (LOX3, JAZ1, and CAB3) exhibit indistinguishable transcript levels in med25 ref4-3 relative to med25 whereas 2 of the genes (JAZ7 and JAZ10) exhibit increased transcript levels in med25 ref4-3 relative to med25. These data are consistent with a mechanism of action in which ref4-3 preferentially impairs expression at some loci to which Mediator is recruited via the interaction between MYC transcription factors and MED25.
Discussion
Previous characterization of ref4-3, a semidominant point mutation of the tail module of Mediator (Bonawitz et al. 2012), revealed its impact on gene expression associated with metabolism and the contribution of other Mediator tail subunits to that perturbation (Stout et al. 2008; Bonawitz et al. 2012; Dolan et al. 2017; Wang et al. 2020). Here we show that ref4-3 can also impair expression of genes that are direct targets of MYC2, a key transcriptional regulator involved in JA homeostasis and other processes (Wang et al. 2017; Van Moerkercke et al. 2019; Zhang et al. 2020), and that genetic ablation of MED25, a tail subunit previously demonstrated to interact directly with MYC2 and related transcription factors (Cevik et al. 2012; Zhang et al. 2015a; Takaoka et al. 2022), can ameliorate this impairment. We also make the surprising observation that ref4-3 leads to a modest reduction in H3K27me3 at H3K27me3-enriched loci, which is accompanied by a reduction of H2A.Z at these loci. This reduction of H3K27me3 is observed at loci that are not transcribed at detectable levels, suggesting that Mediator carrying a point mutation in Med5b contributes to H3K27me3 homeostasis via a transcription-independent mechanism. Our studies highlight the diverse effects of a point mutation in a tail subunit of plant Mediator on transcriptional regulation and raise the possibility that Mediator plays a role in the distinct H3K27me3 landscape of plants.
RNA-seq of 21-day-old ref4-3 plants revealed a notable impact on expression of genes directly regulated by MYC2. 18.8% of genes identified as direct targets of MYC2 by ChIP-seq (Van Moerkercke et al. 2019) exhibited decreased transcript levels in ref4-3 plants (Fig. 6c). Previous biochemical characterization of MYC2 indicates that MYC2 and related transcription factors MYC3 and MYC4 can recruit Mediator by directly interacting with the MED25 tail subunit (Cevik et al. 2012; Zhang et al. 2015a; Takaoka et al. 2022). Our genetic data are consistent with this biochemical model of action. Analysis of candidate gene expression by RT-qPCR reveals that 5 of 7 genes that are direct targets of MYC2 no longer exhibit decreased expression in ref4-3 plants if MED25 is absent. Thus, our data suggest that Mediator containing a semidominant mutant version of Med5b can impair gene expression when recruited to these loci via a MYC2 binding site—MYC2/3/4–MED25 recruitment pathway (Fig. 8).
Model of recruitment of Mediator complex that contains mutant version of MED5b corresponding to ref4-3 to MYC2-dependent loci. Upon recruitment of Mediator via the interaction between MYC2 (or the related transcription factors MYC3 and MYC4), the semidominant point mutation of Med5b (ref4-3) is placed in a context in which it has the ability to inhibit gene expression (denoted by bar).
In addition to revealing an impact of ref4-3 on expression of direct targets of MYC2, our analyses emphasize the responsiveness of the transcriptome of wild-type plants to growth conditions. Previous characterization of ref4-3 by 2 independent RNA-seq analyses called attention to its impact on gene expression associated with metabolism (e.g. phenylpropanoid biosynthesis) (Dolan et al. 2017; Mao et al. 2019a). MDS analysis of all 3 RNA-seq data sets to gain insight into the distinct effects of ref4-3 on the transcriptome in the 3 experiments gave rise to the surprising observation that despite using what would typically be considered highly similar growth conditions and developmental stages for all 3 experiments and the use of a mutant with a distinct developmental phenotype, the experiment rather than the genotype primarily accounted for the observed differences in the transcriptomes (Stout et al. 2008; Wang et al. 2020) (Supplementary Fig. 6c).
Responsive adaptation to environmental conditions is a hallmark of plant growth and development (Sultan 2000; Schneider 2022). Our comparative analysis of independent replicates of RNA-seq data of identical plant lines from common seed stocks indicates that this high degree of responsiveness extends to the level of the transcriptome as well. Given the highly integrative manner by which Mediator contributes to transcriptional control (Allen and Taatjes 2015; Yang et al. 2016; Chen et al. 2022; Richter et al. 2022), it is perhaps not surprising that different transcriptional ground states (as dictated by a given environmental condition) will reveal different perturbations in response to a semidominant mutation in a Mediator tail subunit. Our findings underscore, however, that providing additional information such as the light sources and/or a sample light spectrum in the “Materials and methods” section may aid in reproducibility of transcript-associated phenotypes observed in different labs.
Despite the apparent impact of slightly altered growth conditions on the transcriptome of plants (Supplementary Fig. 6c), our new analyses reproduced the observation that H3K27me3-enriched genes are overrepresented in genes that exhibit altered expression in ref4-3 plants (Fig. 2a and b; Supplementary Fig. 1). In this study, we used ChIP-seq to explicitly test the hypothesis that H3K27me3 enrichment was altered in ref4-3 plants. Our data clearly demonstrate that ref4-3 results in a modest reduction of levels of H3K27me3 at H3K27me3-enriched loci (Fig. 1). Intriguingly, we also observed this reduction at loci that are not detectably expressed (Fig. 4), indicating that Mediator contributes to H3K27me3 enrichment via a mechanism that is not directly coupled to expression of the locus.
Mediator has previously been implicated in determination of chromatin architecture in animals (Richter et al. 2022), including protein–protein interactions linking the Mediator kinase module to H3K27me3 enrichment (Fukasawa et al. 2015; Postlmayr et al. 2020; Dimitrova et al. 2022). Plants exhibit a distinct pattern of enrichment of H3K27me3 relative to animals (Grossniklaus and Paro 2014): in plants, areas of H3K27me3 enrichment are typically observed in a locus-specific fashion, whereas in animals, H3K27me3 enrichment tends to occur in broad swaths of the genome. A number of cis-acting elements have been identified that are likely to contribute to locus-specific deposition of H3K27me3 in plants (Bieluszewski et al. 2021; Godwin and Farrona 2022). Our data raise the prospect that Mediator also contributes to deposition of H3K27me3 in plants, with the distinct caveat that the semidominant nature of ref4-3 imbues the resulting Mediator complex with neomorphic properties.
Another distinguishing feature of H3K27me3-enriched loci in plants in relation to animals is that they are also enriched for the histone variant H2A.Z (Sequeira-Mendes et al. 2014; Carter et al. 2018; Gomez-Zambrano et al. 2019), and it has been proposed that H2A.Z contributes to deposition of H3K27me3 (Carter et al. 2018). Our analysis of H2A.Z enrichment by ChIP-seq in ref4-3 plants revealed that changes in H3K27me3 are strongly correlated with changes in H2A.Z at H3K27me3-enriched loci (Figs. 1 and 4 and Tables 1–3). Our results are thus consistent with previous observations that the presence of H3K27me3 and H2A.Z define a particular chromatin state in Arabidopsis (Sequeira-Mendes et al. 2014) and indicate that the relative abundance of this state is perturbed by ref4-3. Our data do not indicate, however, whether ref4-3 contributes specifically to H2A.Z and/or H3K27me3 at these loci.
Although ref4-3 perturbs H3K27me3 homeostasis, this effect is unlikely to be the primary mechanism by which ref4-3 alters the transcriptome. In our analysis, ref4-3 has a substantially greater impact on expression of MYC2 direct targets (Fig. 6c) than on expression of genes that exhibit altered enrichment of H3K27me3 (Table 1). Nevertheless, our data also raise the possibility that altered H3K27me3 homeostasis as a result of ref4-3 contributes to a substantial aspect of the developmental phenotype of ref4-3 plants. MYB4 has previously been demonstrated to be required for expression of the developmental and flavonoid phenotype of ref4-3 plants (Wang et al. 2020). Although MYB4 was not identified by our statistical criteria as an H3K27me3-enriched locus, visual inspection of H3K27me3 levels at MYB4 in wild-type and ref4-3 plants clearly reveals a decrease in H3K27me3 enrichment in ref4-3 plants that could contribute to the observed increased transcript level of MYB4 (Fig. 4d). This possibility is worth highlighting as it illustrates how a mutant that leads to a general perturbation in some process may give rise to a distinct phenotype not because of the widespread effect generated by the perturbation but because of the effect of that perturbation on a specific locus, analogous to the identification of SDC as a genetic suppressor of the developmental phenotype of drm1 drm2 cmt3 plants (Henderson and Jacobsen 2008). Our data indicate that when examining the contribution of Mediator in plants to transcriptional regulation of a locus of interest (often due to an emergent developmental or biochemical trait), chromatin-based mechanisms should be considered.
Supplementary Material
jkae301_Supplementary_Data
The reference list from the paper itself. Each links out to its DOI / PubMed record.
- 1Abdella R, Talyzina A, Chen S, Inouye CJ, Tjian R, He Y. 2021. Structure of the human Mediator-bound transcription preinitiation complex. Science. 372(6537):52–56. doi:10.1126/science.abg 3074.33707221 PMC 8117670 · doi ↗ · pubmed ↗
- 2Agrawal R, Jiri F, Thakur JK. 2021. The kinase module of the Mediator complex: an important signalling processor for the development and survival of plants. J Exp Bot. 72(2):224–240. doi:10.1093/jxb/eraa 439.32945869 · doi ↗ · pubmed ↗
- 3Allen BL, Taatjes DJ. 2015. The Mediator complex: a central integrator of transcription. Nat Rev Mol Cell Biol. 16(3):155–166. doi:10.1038/nrm 3951.25693131 PMC 4963239 · doi ↗ · pubmed ↗
- 4An C, Li L, Zhai Q, You Y, Deng L, Wu F, Chen R, Jiang H, Wang H, Chen Q, et al 2017. Mediator subunit MED 25 links the jasmonate receptor to transcriptionally active chromatin. Proc Natl Acad Sci U S A. 114(42):E 8930–E 8939. doi:10.1073/pnas.1710885114.28973940 PMC 5651773 · doi ↗ · pubmed ↗
- 5Berardini TZ, Reiser L, Li D, Mezheritsky Y, Muller R, Strait E, Huala E. 2015. The Arabidopsis information resource: making and mining the “gold standard” annotated reference plant genome. Genesis. 53(8):474–485. doi:10.1002/dvg.22877.26201819 PMC 4545719 · doi ↗ · pubmed ↗
- 6Bieluszewski T, Xiao J, Yang Y, Wagner D. 2021. PRC 2 activity, recruitment, and silencing: a comparative perspective. Trends Plant Sci. 26(11):1186–1198. doi:10.1016/j.tplants.2021.06.006.34294542 · doi ↗ · pubmed ↗
- 7Bonawitz ND, Soltau WL, Blatchley MR, Powers BL, Hurlock AK, Seals LA, Weng JK, Stout J, Chapple C. 2012. REF 4 and RFR 1, subunits of the transcriptional coregulatory complex mediator, are required for phenylpropanoid homeostasis in Arabidopsis. J Biol Chem. 287(8):5434–5445. doi:10.1074/jbc.M 111.312298.22167189 PMC 3285322 · doi ↗ · pubmed ↗
- 8Bouyer D, Roudier F, Heese M, Andersen ED, Gey D, Nowack MK, Goodrich J, Renou JP, Grini PE, Colot V, et al 2011. Polycomb repressive complex 2 controls the embryo-to-seedling phase transition. P Lo S Genet. 7(3):e 1002014. doi:10.1371/journal.pgen.1002014.21423668 PMC 3053347 · doi ↗ · pubmed ↗