Chromatin Interaction and Histone Mark Signatures Associated With TBXT Expression in Metastatic Lung Cancer
Reuben M. Yaa, Brian M. Schilder, Rafael D. Acemel, Fiona C. Wardle

TL;DR
This study explores how chromatin interactions and histone marks influence TBXT gene expression in metastatic lung cancer cells.
Contribution
The study identifies specific chromatin interactions and histone marks associated with TBXT expression in metastatic lung cancer.
Findings
Distinct cis-regulatory elements are enriched in TBXT-expressing lung cancer cells.
Two unique cis-regulatory elements in H460 cells are marked by active H3K27ac histone modification.
These elements contain binding sites for transcription factors linked to cancer metastasis.
Abstract
TBXT, a member of the T‐box transcription factor family, drives epithelial‐to‐mesenchymal transition in the metastasis of some cancers. However, the relationship between the epigenetic regulatory landscape and its expression in lung cancers remains elusive. Circularized chromosome capture combined with sequencing (4C‐seq) was employed to analyze physical chromatin interactions at the TBXT loci in the lung cancer cell line H460, a high TBXT‐expressing cell line, compared to H358 and A549, which do not express TBXT. To define the regulatory landscape, the targeted TBXT chromatin interactions were integrated with histone modification profiles from respective cells, followed with motif analysis. Our analysis identified distinct patterns of potential cis‐regulatory elements (pCREs) associated with the TBXT promoter, with increased near‐cis pCRE enrichment in the TBXT‐expressing cells.…
Genes, proteins, chemicals, diseases, species, mutations and cell lines named across the full text — each resolved to its canonical identifier and authoritative record.
Click any figure to enlarge with its caption.
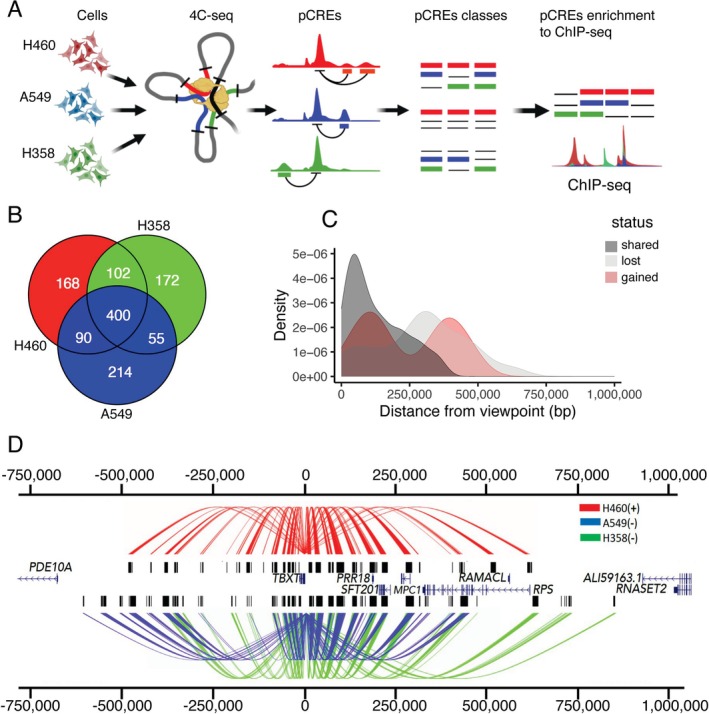 FIGURE 1
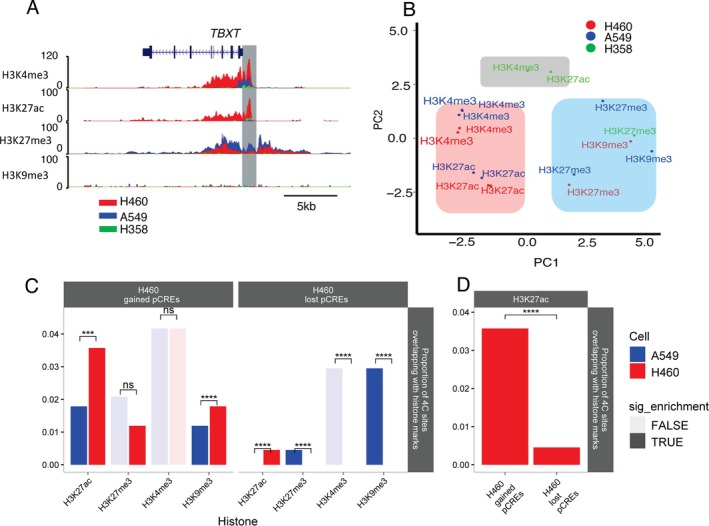 FIGURE 2
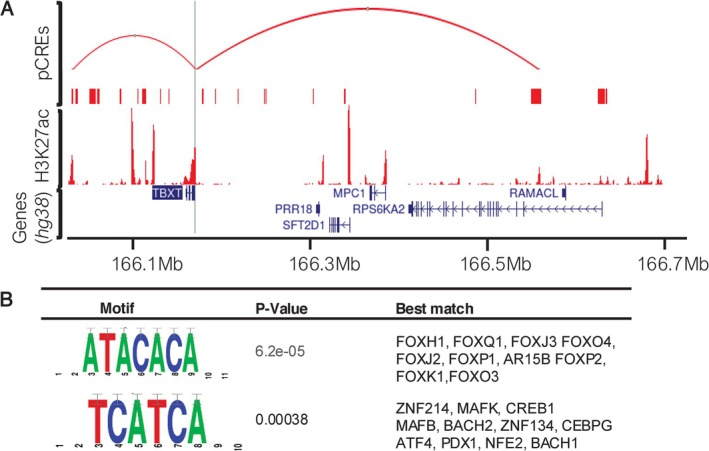 FIGURE 3
- —Darwin Trust of Edinburgh 10.13039/501100022719
- —EMBO 10.13039/100004410
Peer Reviews
No public reviews on file for this paper yet. If you reviewed it on a platform where reviews are public (OpenReview, ICLR, NeurIPS, ICML), you can paste yours below so the community can read it here.
Videos
No videos yet. Explain this paper in a talk, walkthrough, or lecture? Add one.
Taxonomy
TopicsEpigenetics and DNA Methylation · RNA modifications and cancer · Genomics and Chromatin Dynamics
Introduction
1
Lung cancer is the deadliest cancer in the world, with approximately 1.8 million deaths in 2020 [1]. If diagnosed and treated at early stages, 5‐year survival rates for lung cancer patients can be greater than 50%; however, if diagnosed at late stages, when the cancer has metastasized to other organs, 5‐year survival rates can be lower than 4% [2], 2016). Understanding the factors that trigger metastasis and how these events are controlled is important for understanding how to prevent and treat late‐stage lung cancer.
One factor of interest is the T‐box transcription factor, TBXT (also known as T or Brachyury). Although studied for decades in the context of embryonic development [3, 4], more recent evidence indicates TBXT also plays an active and central role in lung cancer progression and metastasis [5].
Studies have shown that a subset of non‐small cell lung carcinomas (NSCLC) express high levels of TBXT at the mRNA and protein levels, while normal adult tissues (with the exception of the testis and thyroid) do not express TBXT [6, 7, 8, 9]. High levels of TBXT in these tumors are correlated with late disease stages, distant metastases, and reduced survival [7, 10, 11, 12]. This finding is consistent with in vitro assays showing that high levels of TBXT cause upregulation of markers of epithelial‐to‐mesenchymal transition (EMT) and increase motility and invasiveness of cancer cells, while knocking down TBXT limits tumor metastasis in in vivo models [7, 13], suggesting that TBXT drives an invasive phenotype. Other studies have shown that high levels of TBXT mediate resistance to chemo‐, radio‐, and immunotherapy [11, 13, 14]. Taken together, these findings, and similar evidence indicating that high levels of TBXT mediate cancer progression in other tumor types including breast and prostate cancer, have made TBXT an attractive therapeutic target [15]. However, despite this role in cancer progression, our understanding of how TBXT expression is activated and maintained in lung cancer cells is incomplete, which limits advances in targeted therapies.
Although fibroblast growth factor receptor 1 (FGFR1) has been implicated in activating TBXT expression in lung cancer through MAPK signaling [16], the genomic cis‐regulatory regions that mediate this activation are unknown. On the other hand, TBXT expression in the rare cancer, chordoma, is regulated via a super‐enhancer (SE) downstream of the TBXT gene, which binds TBXT protein to maintain its own expression [17, 18]. However, whether such epigenetic regulation characterizes TBXT expression in lung cancer is unknown.
To begin to address this gap in knowledge about TBXT expression regulation, we have used circularized chromosome conformation capture coupled with next‐generation sequencing (4C‐seq) [19, 20] to capture, at high resolution, genomic regions that interact with the TBXT promoter, which may represent potential cis‐regulatory elements (pCREs) in lung cancer cell lines. For this, we compared interactions in a TBXT‐expressing lung cancer cell line, H460, which is derived from pleural fluid of a patient with large cell cancer of the lung [21] with two non‐small cell lung cancer (NSCLC) adenocarcinoma cell lines, A549 and H358, which have non‐metastatic properties and do not express TBXT [8, 16]. Previous evidence has shown higher resistance to EGF receptor (EGFR) inhibition, immune‐mediated lysis, as well as conventional chemotherapies and radiation in H460 cells compared to A549 and H358 cells [8, 16]. H460 lung cancer cells also express higher levels of MYC compared to A549 [22] and exhibit early and high invasiveness [23]. This suggests H460 is more tumorigenic and malignant than the other two. We identified common and unique interactions of genomic regions with the TBXT promoter in TBXT vs. non‐TBXT‐expressing environments, which we grouped into shared, gained, or lost in relation to H460 cells and assessed their enrichment in various histone marks. Typically, histone marks such as H3K27me3 and H3K9me3 are modifications associated with transcriptional silencing [24, 25], while H3K27ac and H3K4me3 are associated with active gene expression chromatin state and, in addition, have been shown to be elevated in cancer [25, 26] and at various cancer risk genes [17]. A proportion of gained interactions that were exclusively found in the TBXT‐expressing environment were enriched with the active H3K27ac epigenetic mark compared to lost interactions in H460 cells. These interacting regions were enriched with binding motifs for forkhead box (FOXH1, FOXQ, FOXJ3, FOXO4), zinc finger (ZNF214, ZNF134, ZNF549 and ZNF563) and musculoaponeurotic fibrosarcoma proteins (MAFK, MAFB, MAFG, MAFF and MAF), which have all been implicated in cancer metastasis [27, 28, 29, 30, 31]. Our analysis points to a regulatory program associated with TBXT expression in metastatic lung cancer.
Materials and Methods
2
Cell Culture
2.1
Human lung cancer cell lines were obtained from ATCC (H460) or were a kind gift of Prof. Maddy Parsons, King's College London (H358 and A549). All the lines were authenticated by short tandem repeat analysis (Eurofins) and regularly checked for Mycoplasma contamination by PCR. H460 and H358 cells were maintained in RPMI 1640 (Sigma‐Aldrich; R8758) and A549 cells were maintained in DMEM (Sigma‐Aldrich; D5796), all supplemented with 10% (v/v) fetal bovine serum (FBS; Sigma‐Aldrich; S0615) and 100 U/mL penicillin/0.1 mg/mL streptomycin (Sigma‐Aldrich; P4333) and maintained in a humidified 37°C incubator with 5% CO_2_. For immunofluorescence, cells were seeded on glass coverslips in 24‐well plates.
Reverse Transcriptase PCR
2.2
Total RNA was extracted using the Direct‐Zol RNA miniprep kit (Zymo Research; R2052) from 0.5 × 10^6^ cells resuspended in cold Trizol (ThermoFisher Scientific; 15 596 026). cDNA was synthesized using the High‐Capacity cDNA Reverse Transcription Kit (ThermoFisher Scientific; 4 368 814). TBXT and GAPDH were detected using GoTaq DNA polymerase (Promega) with the following primers: TBXT_E7‐F (5′‐GGGTGGCTTCTTCCTGGAAC), TBXT_E7‐R (5′‐TTGGAGAATTGTTCCGATGAG), GAPDH‐F (5′‐AGATCCCTCCAAAATCAAGTGG) and GAPDH‐R (5′‐GGCAGAGATGATGACCCTTTT). PCR products were amplified for 25 cycles of 30 s at 95°C, 30 s at 60°C, and 30 s at 72°C, followed by one cycle of 72°C for 5 min.
Western Blot
2.3
A total of 0.5 × 10^6^ cells were pelleted, lysed, and denatured by heating at 95°C for 10 min in 2X Laemmli sample buffer (Bio‐Rad; 1 610 737) containing 10% 2‐mercaptoethanol (Aldrich; M6250). The proteins were resolved on a 12% SDS polyacrylamide gels and blotted on PVDF membrane (ThermoFisher Scientific; 88 518) using the semi‐dry transfer method (Trans‐Blot TurboTM, BioRad; 1 704 150). The membranes were incubated for 1 h at room temperature in blocking buffer (1X phosphate buffered saline PBS; Thermo Fisher Scientific; BR0014G), 1% Tween 20 (VWR; 0777‐1 L), 5% nonfat milk (VWR; 22 012) and then incubated overnight at 4°C in a 1:500 dilution of anti‐TBXT (R&D Systems; AF2085, LOT NO: KQP0618021) or a 1:1500 dilution of anti‐histone H3 (Abcam; ab1791) in blocking buffer. The membranes were then washed 3 times for 5 min in PBST (1X PBS, 1% Tween 20) and incubated in a 1:5000 dilution of HRP‐conjugated anti‐rabbit IgG (Sigma‐Aldrich, AP182P; LOT NO: 3130473) or anti‐goat IgG (Sigma‐Aldrich, AP180P, LOT NO: 3157520) in blocking buffer at room temperature for 2 h. After washing three times for 5 min in PBST, the proteins were detected using SuperSignal West Pico PLUS Chemiluminescent substrate (ThermoFisher Scientific; 34 577) according to the manufacturer's protocol.
Immunofluorescence Microscopy
2.4
Cells on coverslips were fixed for 20 min in 4% paraformaldehyde (Sigma‐Aldrich, 158 127), then permeabilized and blocked in 10% bovine serum albumin (BSA; Sigma‐Aldrich, A9418) and 0.3% Triton X‐100 (Sigma‐Aldrich, ×100) in 1× PBS. The cells were then incubated overnight at 4°C in a 1:800 dilution of anti‐TBXT (R&D systems; AF2085, LOT No. KQP0618021) in dilution buffer (1× PBS, 1% BSA, 1% Rabbit Serum (Thermo Fisher Scientific, 16 120 099), 0.3% Triton X‐100). The cells were washed three times for 5 min in wash buffer (1× PBS, 0.1% BSA) then incubated at room temperature for 1 h with a 1:5000 dilution of anti‐goat IgG‐Alexa Fluor Plus 594 (ThermoFisher Scientific, A32758) in dilution buffer. After washing again, the cells were incubated for 10 min in a 1:1000 dilution of DAPI (Sigma‐Aldrich, MBD0015‐1ML) in 1× PBS, washed in 1× PBS then distilled water, and mounted on slides using Vectashield anti‐fade mounting medium (Vector Laboratories, H‐1000‐10). Images were taken using a Zeiss Axiovert 200 M fluorescence microscope with a 20×/0.85 ph 1 objective lens. Graph‐based optical intensities from the immunofluorescence (IF) images for TBXT and DAPI were obtained by ImageJ 1.49v. Intensities were expressed as mean ± SD of all the cells per cell line, and intensity differences between cell lines were assessed using the Wilcoxon rank‐sum test.
4C‐Seq Library Preparation and Sequencing
2.5
Two biological replicate libraries were prepared for each of the lung cancer cell lines according to a previous protocol [19, 20]. Briefly, a total of 10 million cells were crosslinked in 2% paraformaldehyde followed by quenching. The recovered pellet was lysed in cold lysis buffer (50 mM Tris–HCl pH 7.5, 150 mM NaCl, 5 mM EDTA, 0.5% Igepal CA‐630 Sigma‐Aldrich, I8896), 1% Triton X‐100, and 1× cOmplete protease inhibitors (Roche, 11 245 200). Chromatin was then digested overnight at 37°C using NlaIII endonuclease (New England Biolabs, R0125L). Digestion was stopped by heat inactivation, and fragmented nuclei were ligated with T4 DNA ligase (NEB, M0202) at 16°C overnight. Circularized chromatin was de‐crosslinked using proteinase K (20 mg/mL) (NEB, P8107S) at 65°C overnight, then treated with RNase A (20 mg/mL) (Thermo Fisher Scientific, 12 091 021) for 45 min at 37°C. Chromatin was purified using phenol‐chloroform precipitation and digested at 37°C overnight with DpnII (NEB, R0543S) followed by enzyme heat inactivation. The samples were ligated at 16°C using T4 DNA ligase (NEB, M0202) to form 4C chromatin circularized templates. These templates were purified by centrifugation using Merck Millipore Amicon ultra‐15 centrifugal filter units (Merck, 106 608 072). Using the chromatin circularized templates, TBXT circularized chromatin was captured by PCR using TBXT inverse primers overlapping the ligation junction as follows: PCR Reactions were prepared in eight x 25 μL volumes using Q5 polymerase (NEB, M0491L) and inverse sequencing primers (see Table S1) with the following cycling procedure: one cycle of 98°C for 30 s, then 30 cycles of 98°C for 10 s, 57°C for 30 s, and 72°C for 30 s. Indexed DNA amplicons products were pooled, purified using High Pure PCR product purification kit (Roche, 11 732 668 001) and 0.8:1 ratio with AMPure XP reagent (Agencourt, AMPure XP). The product concentrations were assessed using Qubit dsDNA BR assay Kit (Thermo Fisher Scientific, Q32850). The libraries were deep sequenced as 150 bp on a HiSeq X Ten at BGI, Hong Kong.
4C‐Seq Analysis
2.6
Reads were demultiplexed, trimmed to 30 bp, and aligned using Bowtie v1.2.2 aligner [32] to a NlaIII‐DpnII fragment map of the GRCh38 (hg38) NlaIII‐DpnII using ‐m 1 and default settings. Reads falling in fragments flanked by the same restriction enzyme site, in fragments smaller than 40 bp, or in fragments within ±5 kb from the viewpoint were removed. The aligned reads were then transformed to reads per NlaIII fragment ends and smoothened using a 30‐fragment mean running window. Total read counts in the fragments were quantified in 5 kb bins 1 Mb either side of the viewpoint. The counts were used to assess the reproducibility of biological replicates and sample clustering using correlation analysis. 4C profile information for the replicates was subsequently used to identify fragments interacting with the viewpoint using monotonic regression in the peakC peak caller [33] and assessment of the fragment local coverage score [34]. Fragments were considered to interact with the viewpoint if they satisfied all of the following criteria: (1) appeared in both replicates, (2) had a monotonic regression value above 2.5% of the value of the monotonic regression at the viewpoint, (3) had a monotonic regression value high enough to ensure an adequate signal‐to‐noise ratio, and (4) had a local coverage score in the upper quartile. This was fitted for every fragment 1 Mb either side of the viewpoint. TBXT promoter‐interacting fragments that were not more than 40 bp from each other were merged using bedtools v2.27 [35] to form interacting regions (pCREs) and plotted as an arachnogram to generate an intuitive cis‐interaction visualization landscape.
Linear Analysis of Differential Chromatin Interactions
2.7
The pCREs were processed for the assessment of changing chromatin interactions to the TBXT locus between the conditions as applied previously [24]. Since lung normal tissues do not express TBXT [6], interactions in the non‐TBXT‐expressing cells (A549 and H358) were used as a baseline control reference. Using this approach, interactions exclusively found in H460 and not in A549 or H358 cells were classified as gained in H460 cells, whereas those only present in A549 and/or H358 were classified as lost from H460 cells. Interactions present in both conditions were classified as shared. The pCREs were subsequently annotated using HOMER v4.11 [36]. The distribution of shared, gained, and lost pCREs across the genome was visualized as smoothed densities, based on their absolute distance from the viewpoint.
4C Integration With Epigenetic Data
2.8
ChIP‐Seq Analysis
2.8.1
The pCREs were integrated with publicly available ChIP‐seq datasets for different histone modifications in A549, H358, and H460 cells. These datasets were reprocessed from the raw files using a standardized pipeline to ensure comparability. Raw fastq files of H3K27me3, H3K9me3, H3K27ac, and H3K4me3 were retrieved from Sequence Archive Reads (SRA; Table S2). Single‐end reads were aligned using Bowtie2 [32] followed by post‐alignment indexing and filtering using SAMtools [37]. The mapped files were subsequently processed using HOMER v4.11 [36] and tracks visualized in the UCSC browser. Peaks were called using MACS3 [38] implemented via the R package MACSr [39] within PeakyFinders (https://github.com/neurogenomics/PeakyFinders). The default cut‐off parameter was used (cut‐off = 5), corresponding to only using bedGraph reads with p‐values ≤ 1 × 10^−5^.
Epigenetic Enrichment Analyzes
2.8.2
The TBXT pCREs were converted into a named list of GenomicRanges objects [40]. Permuted overlap enrichment tests (10 000 permutations per comparison) were conducted between all pairwise combinations of gained and lost pCRE types and reference ChIP‐seq peaks. This was performed for 2 pCRE types (gained or lost) compared against 4 histone marks across 3 cell lines with up to 2 histone replicates each, yielding 36 tests total. Enrichment tests were conducted using an extension of the regioneR package [41] implemented within echoannot [42]. The false discovery rate (FDR) was calculated according to the Benjamini‐Hochberg procedure to correct for multiple testing [43], and results at FDR < 0.05 were considered non‐significant. As H3K27me3 signals at the TBXT promoter in H358 cells were very low (Figure S2A) and there was a discrepancy in the clustering of H358 ChIP signals with the rest of the ChIP data (Figure S2B) epigenetic enrichment with TBXT interacting regions in the H358 cell data was omitted. However, the correlation of the whole dataset was performed (Figure S3A).
Epigenetic Correlation Analyzes
2.8.3
All the TBXT interacting regions and ChIP‐seq peaks falling within a +/−1 Mb window surrounding the TBXT promoter viewpoint were re‐binned into 1 708 060 bins of 100 bp across chromosome 6 using EpiCompare [44]. Bins were filled with standardized percentiles derived from loop/peak strength. Bins with a row sum of 0 (i.e., no sample overlapped with that bin) were then removed, leaving a 3307‐bin x 17‐sample sparse matrix (containing 89.3% 0 s). Pearson's correlation (r) was then computed between each pair of samples. The resulting correlation matrix was subsequently plotted as a heatmap (Figure S3B; for an interactive version of the heatmap, please see: https://bschilder.github.io/TBXT_loops/code/heatmap).
Motif Analysis
2.8.4
De novo motif discovery of two gained pCREs enriched with H3K27ac in H460 cells was performed using a component of Regulatory Sequence Analysis Tools (RSAT) v1.169 [45]. Motifs were predicted using oligomer lengths of 6 and 7. Enriched motif sequences were clustered to a reduced redundancy position‐specific scoring matrix that was used for searching curated transcription factor binding motifs in the HOmo sapiens COmprehensive MOdel COllection (HOCOMOCO Human v11 CORE) motif database (retrieved in 2024) [46] using the TomTom motif comparison tool in the MEME suite 5.3.3 [47].
Results
3
Chromatin Interaction Differences Between
TBXT Expression Conditions
3.1
We conducted high‐resolution 4C‐seq (Figure 1A) to detect chromatin interactions with the TBXT promoter (viewpoint) in lung cancer cells that expressed high levels of TBXT mRNA and protein (H460 cells) and those that did not express detectable levels of TBXT mRNA or protein (A459 and H358 cells) (Figure S1). We reasoned this approach might allow us to detect variations in chromatin interactions with the TBXT promoter that are associated with these TBXT expression disparities. The 4C‐seq profiles (Figure S2A) had reproducible consistency between cell line replicates, with high pairwise correlation between the cells. H358 and A549 cells, the TBXT non‐expressers, were slightly more similar to each other than to H460 cells (Figure S2B,C).
The TBXT promoter genome‐wide contacts in non‐ and TBXT‐expressing cells. (A) 4C‐seq library preparation from H358, A549, and H460 cells. The 4C‐seq data was analyzed, and 4C interacting regions identified as pCREs were classified as either shared, gained, or lost, and their enrichment with histone ChIP‐seq data was assessed. (B) Overlap of shared and unique pCREs between the cell lines. (C) Density plots of shared, gained, and lost pCREs in relation to the TBXT expressing line (H460). (D) Arachnograms highlighting significant interactions (pCREs) with the TBXT promoter. Lines originate from the viewpoint (TBXT promoter) and indicate regions interacting with the viewpoint (pCREs), shown as black bars. (+) indicates cell lines with high levels of TBXT expression, (−) indicates cell lines with no expression of TBXT. The gene symbols are shown next to the genes.
On quantifying the interactions, our analysis revealed 760, 759, and 729 genomic regions that interact with the TBXT promoter (referred to here as putative CREs; pCREs) in H460, H358, and A549 cells respectively, within 1 Mb either side of the TBXT promoter. Of these, one‐third (400 out of a total of 1201 pCREs) are shared between all cells, while an additional 192 are shared between H460 cells and one other cell line (giving a total of 592 pCREs referred to here as “shared” between H460 cells and at least one other in this study; Figure 1B), indicating there is considerable similarity in genomic interactions with the TBXT promoter in the different lung cancer cell lines. Notwithstanding this similarity, we also observed cell line‐specific TBXT interactions that were present only in H460 cells (168 pCREs, referred to as “gained” in H460 cells) or only present in one or both of the two TBXT‐negative cell lines, A549 and H358 (441 pCREs, referred to as “lost” relative to H460 cells; Figure 1B). All 168 gained pCREs are in non‐coding regions, with only two that are in the promoter region immediately upstream (within −600 bp) of the Transcription Start Site (TSS) of RPS6KA2, while the majority of lost pCREs (436/441) are also in non‐coding regions, with one also within −1 kb of the RPS6KA2 TSS (Table S3).
Mapping the distance and distributions of each class revealed that shared pCREs are concentrated in near‐cis within 0.2 Mb from the TBXT promoter, and gained pCREs are similarly observed in near‐cis as well as medium‐cis (between 0.2 and 0.5 Mb), while pCREs present only in TBXT negative cell lines are observed in medium‐ and far‐cis (beyond 0.5 Mb; Figure 1C). Consistent with this, linear genome representation of the TBXT promoter‐pCRE interactions by cell line type revealed a broader span from the TBXT promoter viewpoint in H358 and A549 cells compared to H460 cells, where pCREs are primarily concentrated within 0.5 Mb of the viewpoint (Figure 1D).
Associating Chromatin Interactions With Epigenetic Marks
3.2
We wanted to know if changes in pCREs between cell lines were associated with changes in histones at the genomic locus, so we assessed the proportional overlap of pCREs between TBXT‐expressing conditions and H3K27ac, H3K4me3, H3K27me3, and H3K9me3 marks using publicly available ChIP‐seq data for A549, H358, and H460 cells (Table S2). While we could not directly verify TBXT expression in the cells used in these ChIP‐seq datasets, we investigated the occupancy of H3K27ac and H3K4me3 (active gene expression) and of H3K27me3 and H3K9me3 (inactive transcription) at the TBXT locus in the datasets. In the H460 ChIP‐seq datasets, the TBXT locus was distributed with H3K27ac and H3K4me3 marks similar to the patterns observed in other TBXT‐expressing lines and tissues [17, 18, 48], suggesting active transcription of TBXT in the H460 cells used to generate the ChIP‐seq data. Conversely, in the A549 and H358 datasets, H3K27ac and H3K4me3 marks are absent or reduced, while A549 cells show an increase in H3K27me3 at the TBXT transcription start site, suggesting a lack of TBXT expression in these A549 and H358 cells (Figure 2A). However, the H3K27me3 signal in H358 cells at the TBXT promoter was too low to be used in this or further analysis. Hence, the TBXT expression profiles of the cells used to generate the ChIP‐seq datasets were comparable to the TBXT expression profiles of cells from which we generated 4C‐seq data (Figure S1). Interestingly, analysis of histone ChIP‐seq data 1 Mb either side of TBXT clustered primarily by histone mark followed by cell line (Figures 2B and S3A,B), indicating potential cell line variations in the regulation, particularly for genes around the TBXT locus. Interestingly, in contrast to chordoma cells, we also note that there is no evidence of a super‐enhancer in the TBXT‐expressing H460 cells. Having verified the datasets, we proceeded to evaluate the differential epigenetic enrichment at pCREs in the different TBXT‐expressing environments.
Overlap and enrichment of TBXT pCREs with histone marks at the TBXT locus. (A) Overlay of merged ChIP‐seq histone modifications at the TBXT locus (immediate upstream region highlighted in gray) for the H460 (red), A549 (blue) and H358 (green) lung cancer cells. (B) PCA clustering of the ChIP‐seq peaks at the TBXT locus. The active marks H3K27ac and H3K4me3 are highlighted in faint red, while the repressive marks H3K27me3 and H3K9me3 are highlighted in faint blue. Active marks from H358 cells highlighted in gray form a cluster separate from the rest of the active marks. (C, D) Proportional overlap of pCREs with the indicated histone marks by permuted overlap enrichment tests (10 000 permutations per test) between ChIP‐seq peaks (4 histone marks × 2 cell‐lines) and each TBXT pCRE type with multiple repressive (H3K27me3, H3K9me3) and active regulatory marks (H3K4me3, H3K27ac) In experiments where multiple replicates existed, mean FDR and mean z‐scores were computed after conducting proportional enrichment tests with each replicate. Where the proportional overlap is not statistically significant (FALSE), the corresponding bar in the graph is displayed in faint color. Conversely, significant overlap (TRUE) is represented by bold‐colored bars. Asterisks indicate significant difference between cell lines (***: FDR < 0.0001, **: FDR < 0.001). (C) Enrichment of histone marks at pCREs gained in the H460 cell line (gained pCREs) and lost in the H460 cell line (lost pCREs). (D) H3K27ac enrichment difference between H460 gained and lost pCREs.
This analysis revealed an enrichment of the active histone mark H3K27ac at H460 gained pCREs in TBXT‐expressing H460 cells compared to non‐expressing A549 cells. On the other hand, there was a similar overlap of gained pCREs with H3K4me3 in both cell lines, although this overlap did not reach a statistical significance, and there was no enrichment of H3K4me3 between the cell lines (Figure 2C). Further, in line with their correlation with TBXT expression, the H460 gained pCREs exhibited lower enrichment of repressive histone marks (H3K27me3 and H3K9me3) compared to the active mark H3K27ac in H460 cells (Figure 2C). Within the repressive marks, H3K9me3 enrichment was unexpectedly higher in H460 cells compared to A549 cells (Figure 2C) possibly due to cell line‐specific variations in H3K9me3 function and/or heterogeneity within the H460 gained pCREs population. The other repressive mark, H3K27me3, exhibited a non‐significant reduction in H460 cells compared to A549 cells. Furthermore, statistical comparisons reveal a significantly higher association of H3K27ac with gained pCREs than lost pCREs in H460 cells (Figure 2D). Overall, the strong enrichment of H3K27ac at gained pCREs, i.e., regions that interact with the TBXT promoter in H460 cells but not non‐TBXT‐expressing cells, may suggest a role of these in TBXT expression regulation in H460 cells.
On the other hand, the epigenetic landscape of H460 lost pCREs displayed variable enrichment patterns compared to the gained pCREs. The repressive histone marks H3K27me3 and H3K9me3 displayed enrichment in these pCREs in A549 cells compared to H460 cells (Figure 2C). There was also enrichment of these pCREs with H3K27ac in H460 compared to A549. However, the overall enrichment levels for H3K27ac were lower than the enrichment observed for the repressive marks within these pCREs. These patterns could indicate a role for these lost pCREs, which interact with the TBXT promoter in A459 cells, in repression of TBXT expression in A549 cells.
Given the enrichment analysis revealed H460 gained pCREs with stronger enrichment of the active histone mark H3K27ac in H460 cells compared to A549 cells and H460 lost pCREs (Figure 2C,D), we prioritized these pCREs to identify potential regulatory elements within them that drive TBXT expression. The selected pCREs (hg38, chr6:166029223–166030302 & chr6:166547780–166558507) are visualized in (Figure 3A), which also shows ChIP‐seq read densities for H3K27ac in TBXT‐expressing H460 cells. We conducted motif discovery in these selected pCREs to uncover potential transcription factors that might bind and regulate TBXT expression. Two motifs were identified (Figure 3B). Search on the reference motif database revealed enrichment of binding motifs for the transcription factors in the forkhead box family (FOXH1 p = 5.14 × 10^−4^, FOXQ1 p = 2.381 × 10^−3^, FOXJ3 p = 3.04 × 10^−3^, FOXO4 p = 4.05 × 10^−3^), zinc finger protein (ZNF214 p = 8.4 × 10^−4^, ZNF134 p = 9.37 × 10^−3^, ZNF549 p = 1.9 × 10^−2^ and ZNF563 p = 2.27 × 10^−2^) and musculoaponeurotic fibrosarcoma proteins (MAFK p = 8.20 × 10^−3^, MAFB p = 8.590 × 10^−3^, MAFG p = 1.29 × 10^−2^, MAFF p = 1.488 × 10^−2^ and MAF p = 1.68 × 10^−2^) (Figure 3B, Table S4). These findings point to the possibility that selected transcription factors in the forkhead box, zinc finger, and Maf family could potentially act as transcriptional regulators of TBXT expression through interaction with the TBXT enhancers that were identified in the current study.
Multi‐track plot of H460‐gained loops that overlap with H3K27ac active histone marks. (A) Multi‐track plot showing the overlay of putative TBXT cis‐regulatory elements (pCREs) and H3K27ac active mark in H460 cells. The viewpoint is shown as a vertical gray line. The top track (pCREs) shows the H460 gained pCREs that were experimentally quantified in the present study on top of all pCREs from H460 (red bars). The second track (H3K27ac) shows merged normalized read counts of H3K27ac ChIPseq data for H460 (n = 2). The third track shows TBXT and other genes in the region. (B) Motifs (p < 0.05) detected de novo by RSAT and the top 10 TF best hits from (HOCOMOCO Human (v11 CORE)) motif database.
Discussion
4
Previous research indicates the involvement of FGFR1 in activating TBXT expression in lung cancer via MAPK signaling [16], while a super‐enhancer downstream of TBXT is evident in chordoma [17, 18]. In this study, we present a TBXT epigenetic regulatory landscape from TBXT‐expressing and non‐expressing lung cancer cell lines. Our data indicate a substantial overlap of TBXT promoter –genome interactions among cell lines, implying a relatively stable chromatin conformation at the TBXT locus regardless of TBXT expression levels and cell lines. This is understandable as all the cell lines used herein were derived from lung tumors. The shared stable subset of chromatin interactions with the TBXT promoter in all cell lines is unlikely to influence the different expression of TBXT between the cell lines. However, we still found differential chromatin interactions to the TBXT locus between the cell lines, prompting an evaluation of their enrichment with active gene expression (H3K27ac and H3K4me3) and inactive transcription (H3K27me3 and H3K9me3) histone marks, which may infer their roles in TBXT expression.
Examining the proportional overlap enrichment between pCREs and histone marks provided insight into the features of different pCREs. Our analysis revealed a greater enrichment of H460 gained pCREs with the active gene expression mark (H3K27ac) and with diminished enrichment of the repressive mark H3K27me3 in the TBXT expressing environment. Thus, within the TBXT expressing environment, the TBXT promoter interacts with specific CREs enriched with active regulatory chromatin marks, which might suggest they act as enhancers to upregulate and/or maintain TBXT expression in H460 cells. Additionally, higher enrichment of repressive marks (H3K27me3) with H460 lost pCREs in non‐TBXT expressing lung cancer cells (A549) compared to H460 may indicate a role in the suppression of TBXT expression in the TBXT non‐expressing environment. However, the pCREs might also interact with other promoters to regulate the expression of other genes. Further experiments are needed to determine the precise role of these pCREs.
H3K27ac analysis in chordoma, a cancer of the spinal column that TBXT is also implicated in [49, 50], revealed a larger 1.5 Mb active region surrounding TBXT, harboring two SEs associated with TBXT [17]. While the identified lung cancer pCREs did not overlap the TBXT SEs of chordoma, the upstream pCRE fell within the 1.5 Mb active region identified in chordoma. This may suggest that there may be shared elements within this broader active region between TBXT in H460 lung cancer cells and chordoma.
Two pCREs with high H3K27ac enrichment were analyzed for transcription factor binding motif enrichment. Motifs for forkhead box, zinc finger, and Maf protein families, all implicated in cancer, were identified. For instance, FOXH1 and FOXQ1 in lung, colorectal, and breast cancer promote EMT by controlling proliferation, migration, and invasion through downregulation of E‐cadherin [27, 28, 29]. Maf proteins [30, 31], in complex with BACH1 and 2 [51] are also involved in activating EMT in breast and lung cancer. TBXT itself also drives EMT and cancer progression in lung cancer [7, 13]. While TBXT can autoregulate its expression [17, 18], we did not identify T‐box binding sites in these pCREs, suggesting autoregulation may not occur through these specific regions. Future studies should investigate whether FOX and MAF proteins regulate TBXT expression in H460 cells and how this impacts cell migration and invasion. Further insights into TBXT regulation may be gained by evaluating the TBXT regulatory map in resected tumors and patient‐matched samples.
As the epigenome is dynamic, biological functional validation will be crucial in elucidating the role of the identified pCREs in TBXT regulation, including their potential involvement in MAPK signaling pathways in lung cancer [16].
Conclusions
5
While our findings lack functional validation, our data still highlight putative genomic control regions that correlate with the expression of TBXT. In vivo testing and validation of these regions in primary lung tumor samples are necessary to fill the gaps. This approach will refine the understanding of the TBXT regulatory network and provide a platform to investigate epigenetic modifiers and chromatin regulators that are linked to lung cancer. Ultimately, this knowledge will contribute to uncovering mechanisms driving lung cancer disease progression.
Author Contributions
Reuben M. Yaa: funding acquisition, investigation, methodology, project administration, formal analysis, data curation, visualization, writing – original draft. Brian M. Schilder: formal Analysis, data curation, visualization, software, writing – original draft. Rafael D. Acemel: software, resources. Fiona C. Wardle: conceptualization, project administration, methodology, resources, supervision, writing – review and editing.
Ethics Statement
The study did not include patient or animal samples. No approval was required.
Conflicts of Interest
The authors declare no conflicts of interest.
Supporting information
Figure S1. TBXT expression is maintained in H460, while absent in A549 and H358 cells. (A) TBXT expression (172 bp), measured by RT‐PCR, is detected in H460 cells, but not in A549 and H358 cells. GAPDH expression (121 bp) a housekeeping gene was a control and was detected in all cell lines (n = 3). (B) TBXT protein is detected, by western blot, in H460 cells, but not in A549 and H358 cells. H3 protein as a control was detected in all the cell lines (n = 3). (C) Immunostaining also detects TBXT protein in the nucleus (stained with DAPI) of H460 cells, but not in A549 and H358 cells (n = 3). The scale bar is 50 μM. (D) TBXT nuclear fluorescent intensity is only measurable in H460 with no detectable levels in A549 and H358 cells. DAPI nuclear fluorescent intensities were insignificantly different between the cell lines.
Figure S2. 4C seq fragment count between the samples. (A) Merged normalized 4C‐seq profiles. (B) 4C replicates correlations between the replicates. Scale represents normalized counts of the interactions. (C) Heatmap and dendrogram of pairwise correlation matrix between the samples on merging. Scale is Pearson's correlation.
Figure S3. Clustering and correlation of ChIP‐seq data. Pairwise correlation heatmap of ChIP‐seq peaks at (A) chr6 and (B) +/− 1 Mb around TBXT locus after rebinning each set of genomic ranges using EpiCompare [44]. Peaks clustered as sample type and histone class (H3K27ac, H3K4me3 for active marks, and H3K27me3, H3K9me3 for repressive marks).
Table S1. 4C sequencing primers.
Table S2. ChIP‐seq metadata including SRA accession numbers.
Table S3. Annotation of the pCREs.
Table S4. Motif discovery.
The reference list from the paper itself. Each links out to its DOI / PubMed record.
- 1H. Sung , J. Ferlay , R. L. Siegel , et al., “Global Cancer Statistics 2020: GLOBOCAN Estimates of Incidence and Mortality Worldwide for 36 Cancers in 185 Countries,” CA: a Cancer Journal for Clinicians 71 (2021): 209–249, 10.3322/caac.21660.33538338 · doi ↗ · pubmed ↗
- 2B. Bannister , “Cancer Survival by Stage at Diagnosis for England (Experimental Statistics): Adults Diagnosed 2012, 2013 and 2014 and Followed Up to 2015 With Public Health England” (2016), https://backup.ons.gov.uk/wp‐content/uploads/sites/3/2016/06/Cancer‐survival‐by‐stage‐at‐diagnosis‐for‐England‐experimental‐statistics‐Adults‐diagnosed‐2012‐2013‐and‐2014‐.pdf.
- 3V. P. Korzh , “N. Dobrovolskaya‐Zavadskaya and the Discovery of the T gene 1,” Russian Journal of Developmental Biology 32 (2001): 192–195, 10.1023/A:1016663622874. · doi ↗
- 4F. C. Wardle and V. E. Papaioannou , “Teasing Out T‐Box Targets in Early Mesoderm,” Current Opinion in Genetics & Development 18 (2008): 418–425, 10.1016/j.gde.2008.07.017.18778771 PMC 2700021 · doi ↗ · pubmed ↗
- 5M. Chen , Y. Wu , H. Zhang , S. Li , J. Zhou , and J. Shen , “The Roles of Embryonic Transcription Factor BRACHYURY in Tumorigenesis and Progression,” Frontiers in Oncology 10 (2020): 961, 10.3389/fonc.2020.00961.32695672 PMC 7338565 · doi ↗ · pubmed ↗
- 6C. Palena , D. E. Polev , K. Y. Tsang , et al., “The Human T‐Box Mesodermal Transcription Factor Brachyury Is a Candidate Target for T‐Cell‐Mediated Cancer Immunotherapy,” Clinical Cancer Research 13 (2007): 2471–2478, 10.1158/1078-0432.CCR-06-2353.17438107 · doi ↗ · pubmed ↗
- 7R. I. Fernando , M. Litzinger , P. Trono , D. H. Hamilton , J. Schlom , and C. Palena , “The T‐Box Transcription Factor Brachyury Promotes Epithelial‐Mesenchymal Transition in Human Tumor Cells,” Journal of Clinical Investigation 120 (2010): 533–544, 10.1172/JCI 38379.20071775 PMC 2810072 · doi ↗ · pubmed ↗
- 8M. Roselli , R. I. Fernando , F. Guadagni , et al., “Brachyury, a Driver of the Epithelial‐Mesenchymal Transition, Is Overexpressed in Human Lung Tumors: An Opportunity for Novel Interventions Against Lung Cancer,” Clinical Cancer Research 18 (2012): 3868–3879, 10.1158/1078-0432.CCR-11-3211.22611028 PMC 3472640 · doi ↗ · pubmed ↗