Single-cell delineation of strain-specific HIV-1 Vif activities using dual reporter sensor cells and live cell imaging
Jorge F. Guerrero, Laraine L. Zimdars, James W. Bruce, Jordan T. Becker, Edward L. Evans, Soroosh Torabi, Rob Striker, Scott M. Berry, Nathan M. Sherer

TL;DR
Researchers developed a new imaging-based method to study HIV-1 infection and measure multiple aspects of viral activity in individual cells.
Contribution
The dual reporter sensor cell (DRSC) assay enables high-content, single-cell analysis of HIV-1 infection and viral variability.
Findings
The DRSC assay can detect HIV-1 infection and measure viral gene activation and immune evasion.
Different vif alleles from HIV-1 strains show varied abilities to degrade APOBEC3G and affect the cell cycle.
The system can distinguish virus co-receptor preferences and visualize virion assembly.
Abstract
Human immunodeficiency virus type 1 (HIV-1) genome diversification is a key determinant of viral evolution and the pathogenesis of HIV/AIDS. Antiretroviral therapy is non-curative, and in the context of monitoring the latent reservoir, precision tools are needed to detect and enumerate HIV-1 genomes as well as to assess their heterogeneity, replication potential, and predict responses to therapy. Current sequencing-based methodologies are often unable to confirm intact genomes and most cell-based reporters provide limited information pertaining to viral fitness. In this study, we describe dual reporter sensor cells (DRSCs), an imaging-based reporter system designed to detect HIV-1 infection and measure several independent attributes of the virus in a single-cell high-content assay. We show that the DRSC assay can be used to measure infection, viral gene activation kinetics, and quantify…
Genes, proteins, chemicals, diseases, species, mutations and cell lines named across the full text — each resolved to its canonical identifier and authoritative record.
Click any figure to enlarge with its caption.
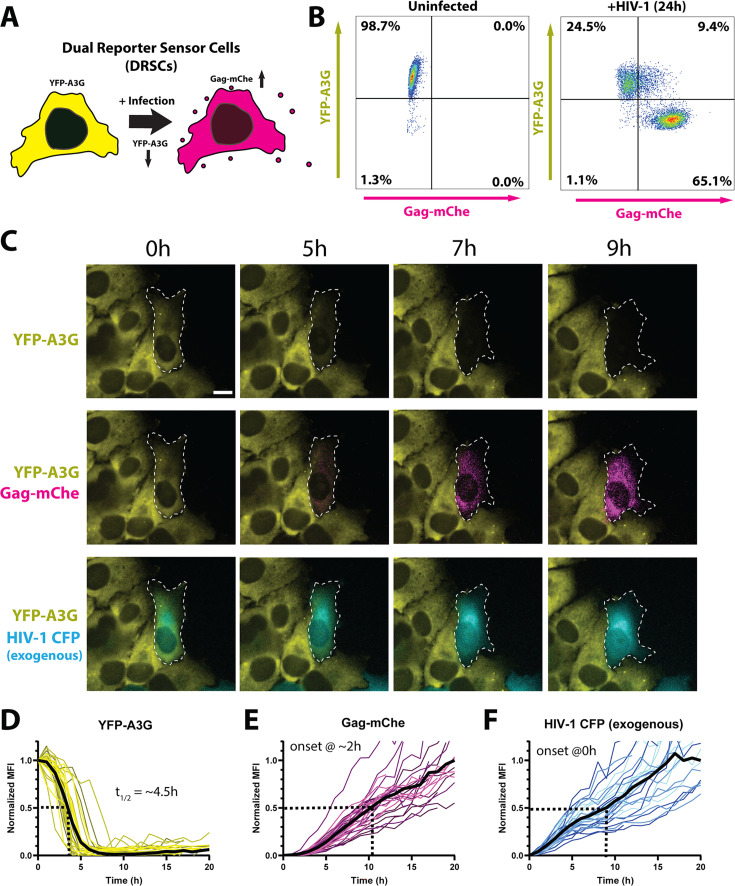 Fig 1
Fig 1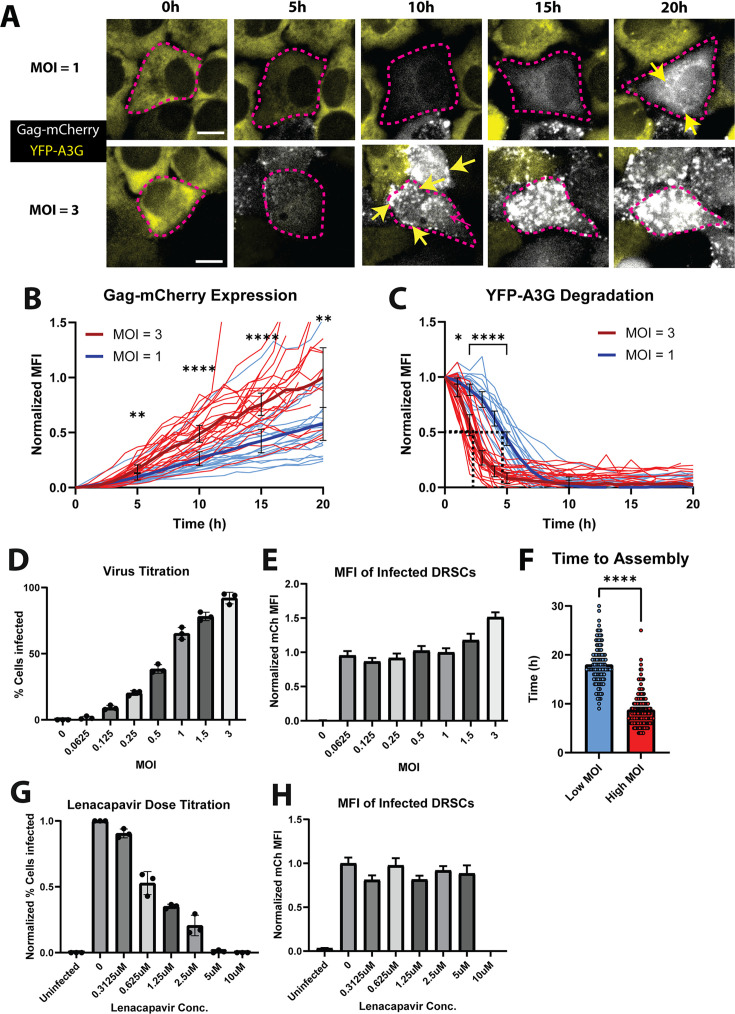 Fig 2
Fig 2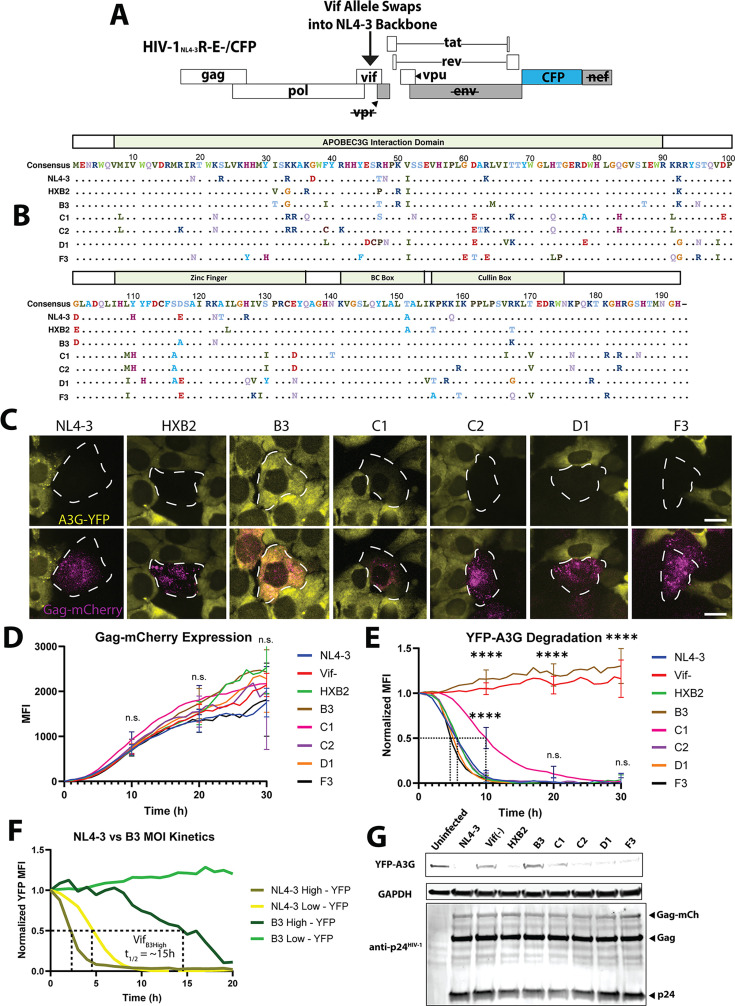 Fig 3
Fig 3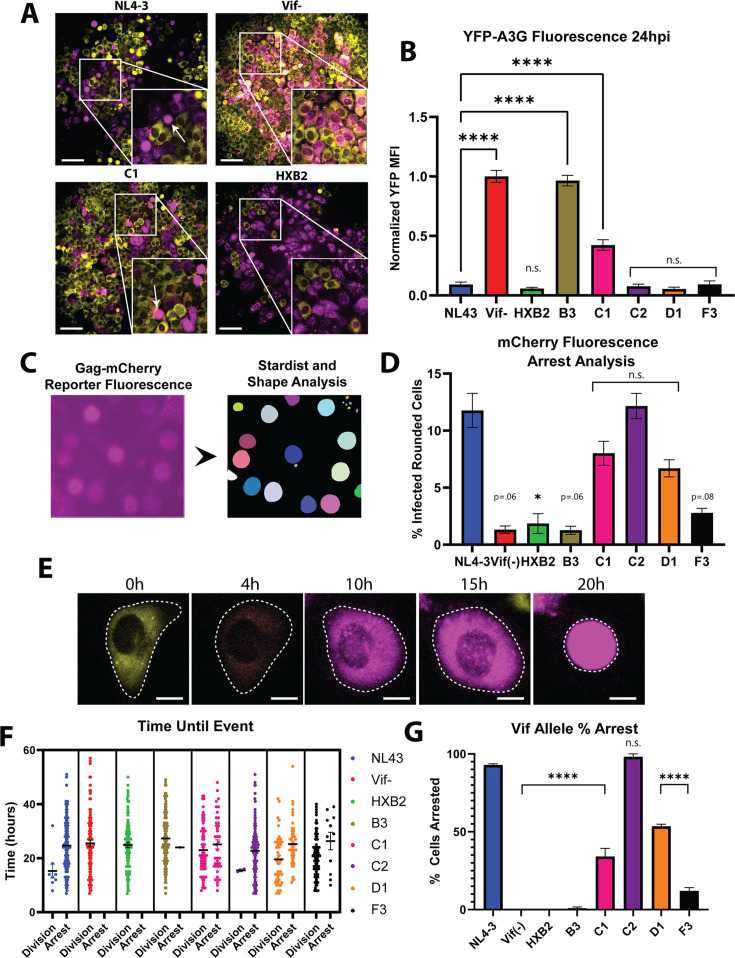 Fig 4
Fig 4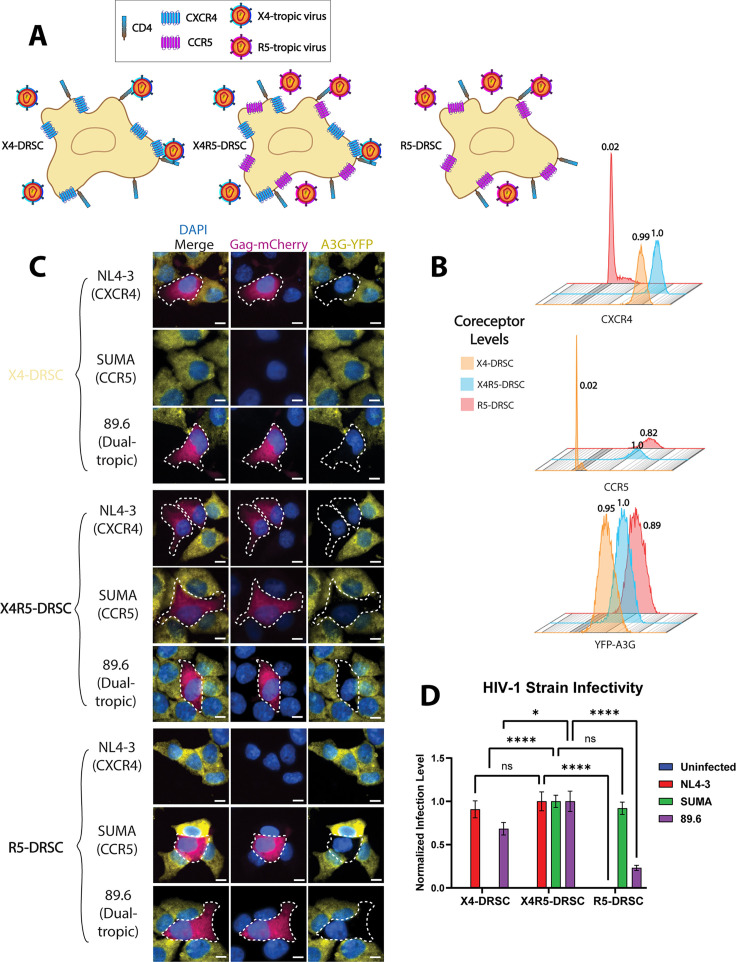 Fig 5
Fig 5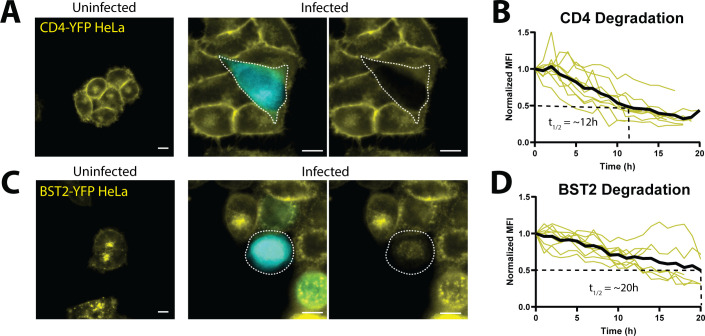 Fig 6
Fig 6- —HHS | NIH | National Institute of Allergy and Infectious Diseases (NIAID)
- —HHS | NIH | National Institute of Allergy and Infectious Diseases (NIAID)
- —HHS | NIH | National Institute of General Medical Sciences (NIGMS)
- —Wisconsin Alumni Research Foundation (WARF)
Peer Reviews
No public reviews on file for this paper yet. If you reviewed it on a platform where reviews are public (OpenReview, ICLR, NeurIPS, ICML), you can paste yours below so the community can read it here.
Videos
No videos yet. Explain this paper in a talk, walkthrough, or lecture? Add one.
Taxonomy
TopicsHIV Research and Treatment · Cytomegalovirus and herpesvirus research · Mosquito-borne diseases and control
INTRODUCTION
Genetic variability is a product of evolution common to all viruses. Retroviruses such as the human immunodeficiency virus type 1 (HIV-1) and other RNA and DNA viruses exhibit high genome heterogeneity due to mechanisms of gene variation including mutation, recombination, or for some viruses (e.g., influenza virus) genome segment reassortment (1–5). Viral evolution in the face of selective forces can yield HIV-1 founder strains with altered pathogenicity due to changes in transmission rate (6–9) or viral fitness (10, 11). Rapid genome diversification is also the basis for viral evasion of the host immune system and resistance to antiviral therapies (12–18).
HIV-1 genome diversification is driven by both error-prone reverse transcription and genome recombination. Over recent decades, the major circulating clade (group M) has diverged into subtypes including A1, A2, A3, A4, B, C, D, F1, F2, G, H, J, K (9). HIV-1 subtype B is the most prevalent in the West and has received the lion’s share of HIV-1 research. However**,** subtype C is endemic to Sub-Saharan Africa and represents 47% of total HIV-1 infections worldwide (19). Emerging recombinant strains such as AE and AG are also of increasing concern (20). Interestingly, HIV-1 utilizes two coreceptors, CXCR4 and CCR5, to initiate infection along with its main receptor CD4. The coreceptor is necessary for infection, but different strains of HIV-1 have a bias toward using one coreceptor over the other. Viruses that primarily use the CXCR4 coreceptor are termed X4-tropic, CCR5-biased viruses are X5-tropic, and dual-tropic viral strains also exist which can utilize either coreceptor for infection (21).
Even within single subtypes, HIV-1 can exhibit significant variability among hosts (up to 20% sequence divergence at the nucleotide level) (22, 23), with these differences of potential relevance to viral persistence and/or resistance to therapy. For example, HIV-1 Envelope (24–26), Capsid, Reverse Transcriptase, and Integrase each exhibit mutations that perturb the efficacy of pharmacological and antibody treatment options (27–29). Similarly, the regulatory and accessory proteins Rev, Tat, Vif, Vpr, Vpu, and Nef can exhibit functional variability based on gene heterogeneity thought to impact pathogenic outcomes (30–45).
To track viral evolution and study the latent reservoir, there is a dire need for precision tools to detect, enumerate, and characterize HIV-1 genomes and their diversification. Multiple techniques are currently available for these purposes, of which the most prevalent and cost-effective are polymerase chain reaction (PCR)-based genome amplification methods coupled to sequencing (46, 47). While sensitive, a limitation to these strategies is that sequencing is typically unable to discern intact from replication-defective integrated genomes and rarely able to predict response to therapy (48–50). A solution is the use of HIV-infectable reporter cell lines (e.g., MAGI, GHOST, or TZM-bl) that use luminometric or fluorometric methods (e.g., plate reader or flow cytometry) to confirm the presence of infectious virions and study replication. These methods can both enumerate viruses and be used to study strain-specific susceptibility to drugs or antibodies (51–55). However, current single-reporter systems provide limited information pertaining to genome variation and adaptations to the host.
Our aim in this study was to develop a cell-based strategy that exploits live cell imaging to not only detect HIV-1 infection but also mine single-cell data in a multivariate fashion, thus allowing us to access phenotypic information with enhanced data richness relative to prior approaches. To this end, we describe the creation and validation of the HIV-1 dual reporter sensor cell (DRSC) assay using cells designed to undergo multicolor visible transitions in response to infection, requiring the coordinated activities of three independent HIV-1 gene products (Tat, Rev, and Vif) to define an intact, fully-active genome. We validate our system by testing the DRSC assay’s capacity to survey the relative potency and functions of several subtypes and strain-specific vif alleles, and by modifying the assay to differentiate between X4-, R5-, and dual-tropic viruses. Taken together, the DRSC platform demonstrates the strength and potential of multi-color cell-imaging assays based on viral response sensors to detect and characterize HIV-1 viruses as well as to study strain-specific attributes of viral replication and host cell response.
RESULTS
Development of the dual reporter sensor cell assay
To generate a multicolor cell-based assay capable of measuring multiple important virus traits in a single experiment, we engineered HeLa.CD4 DRSCs constitutively expressing a YFP-APOBEC3G (YFP-A3G) “OFF” reporter (Fig. 1A, yellow) and encoding a latent HIV-1 Gag-mCherry “ON” reporter (Fig. 1A, magenta). YFP-A3G was chosen as an “OFF” sensor because A3G is a host restriction factor against HIV-1 that is counteracted by the viral Vif protein, with viral infection and subsequent Vif expression leading to rapid ubiquitination and degradation of A3G through the proteasomal degradation pathway (56–64). Our “ON” sensor was an integrated subgenomic proviral reporter that expressed a fluorescent Gag-mCherry fusion protein activated by incoming viral expression of the viral Tat and Rev regulatory proteins; with Tat and Rev essential for efficient viral RNA transcription and late-stage RNA nuclear export, respectively (65, 66). Our ON reporter was similar in principle to several prior HIV-1 reporter systems that express fluorescent proteins in response to Tat expression (55, 67), but novel in that the readout was both Tat- and Rev-dependent and produced Gag-mCherry so that we could both measure late-stage viral gene activation and track Gag-mCherry in the context of its role in driving virus capsid assembly. Although HeLa.CD4 cells are derived from epithelial cells that are not native targets of HIV-1 infection in vivo, they were chosen for DRSCs because of their long-standing use in HIV replication studies and useful imaging qualities including flatness and their stationary nature amenable to long-term (>24 h) video microscopy.
Dual reporter sensor cells (DRSCs). (A) Cartoon depiction of DRSCs and their color-switch transition from yellow (YFP-A3G(+)/Gag-mCherry(−)) to red (YFP-A3G(−)/Gag-mCherry(+)) after infection with HIV-1. (B) Flow cytometry analysis of YFP-A3G and Gag-mCherry fluorescence in uninfected DRSCs (left) and DRSCs infected with vesicular stomatitis virus G protein (VSV-G) pseudotyped HIV-1NL4-3-CFP reporter virus at a multiplicity of infection (MOI) of 1 (right) and fixed at 24 hours post-infection (hpi). (C) Individual images from live cell imaging of DRSC activation following infection with HIV-1NL4-3-CFP reporter virus (see also Movie S1). An infected cell undergoing a color switch is outlined in white. Scale bars represent 10 µm. (D–F) Single-cell analysis of DRSC YFP-A3G downregulation (Panel D), expression of the cell-intrinsic Gag-mCherry reporter (Panel E), and expression of the virally encoded CFP reporter (Panel F) following infection with VSV-G pseudotyped HIV-1NL4-3-CFP reporter virus at an MOI of 1. Mean fluorescence intensity (MFI) tracks from 30 cells from one of three representative experiments are shown. Average kinetics are indicated by the solid black line, with the dotted line indicating T1/2 for YFP-A3G decay and Max1/2 for Gag-mCherry and CFP expression normalized to average MFI at the 20 h time point. T = 0 represents the first detection of the exogenous viral CFP reporter.
Our prediction was that when HIV-1 infection occurred within a DRSC, viral Vif expression would eliminate the YFP-A3G reporter, while Tat and Rev expression would coordinately transactivate Gag-mCherry expression, resulting in an “ON/OFF” color-switch with loss of YFP-A3G and gain of Gag-mCherry [yielding a YFP(−)/mCherry(+) infected cell] (Fig. 1A). We tested this prediction by first analyzing DRSCs using flow cytometry after infecting the cells at a multiplicity of infection (MOI) of 1 with a subtype B-derived HIV-1_NL4-3_-CFP reporter virus (pseudotyped with the vesicular stomatitis virus G protein: VSV-G); observing that 65.1% of the cell population shifted from YFP(+)/mCherry(−) (uninfected) to YFP(−)/mCherry(+) at 24 hours post-infection (hpi), with an additional 9.36% of mCherry(+) DRSCs still YFP-A3G-positive, likely indicating that a subset of infected cells were still in the process of a color-switch (the infection was not synchronized) (Fig. 1B).
To define single-cell kinetics, DRSCs were infected using the same HIV-1_NL4-3_-CFP reporter virus prior to live cell imaging over a 20 h time course (Fig. 1C through F; Movie S1). Infected cells were tracked over time measuring changes to per cell YFP-A3G, Gag-mCherry, and viral CFP mean fluorescence intensities (MFIs). Consistent with the onset of Vif expression, YFP-A3G levels began to decline ~1.5 h after productive infection (defined as the onset of CFP expression) with a half-time (T_1/2_) of decay of 4.58 ± 1.27 h (n = 30), consistent with previous estimates of Vif-mediated A3G degradation kinetics (68–72) (Fig. 1C with quantification in Fig. 1D). Gag-mCherry expression was initiated ~2 h after the onset of CFP expression, consistent with the Gag-mCherry reporter representing a “late” (Rev-dependent) viral gene product encoded by unspliced viral RNA, in contrast to the “early” (Rev-independent) CFP reporter expressed from the nef locus, with both signals exhibiting linear rise kinetics (Fig. 1E and F) achieving half-maximum (1/2 max) times of ~9 h and ~10.5 h, respectively.
Taken together, DRSCs allowed for “color-switch” detection of HIV-1 infection and direct single-cell measurements of both viral Rev- and Tat-mediated activation of Gag-mCherry expression and Vif-mediated YFP-A3G degradation kinetics.
Use of DRSCs to measure viral infectivity
We predicted that a useful feature of DRSCs would be their potential to not only detect infection but also measure differential levels of gene activation and MOI. To test this hypothesis, we compared the response of DRSCs to low (1) vs high (3) MOI infection, measuring single-cell responses in our live cell imaging assay (Fig. 2A; Movie S2). Consistent with increased MOI, we observed greater than twofold increases in Gag-mCherry levels over time for high MOI relative to the low MOI conditions (Fig. 2B). YFP-A3G degradation was also accelerated under the high MOI condition (T_1/2_ of ~2.5 h for MOI of 3 relative to T_1/2_ of ~4.5 h for MOI of 1) and initiated ~1 h earlier (Fig. 2C). These data illustrated the utility of the single-cell kinetic assay that allowed us to detect relatively modest differences to infection and gene activation levels.
DRSCs for single-cell quantification of HIV-1 infection and virus particle assembly kinetics. (A) Individual images from live cell imaging of DRSC activation following infection with HIV-1NL4-3 virus (VSV-G pseudotyped) at an MOI of ~1 (low) or ~3 (high) (see also Movie S2). Scale bars represent 10 µm. YFP-A3G is shown in yellow and Gag-mCherry in white (for better visual clarity relative to magenta as in Fig. 1). (B and C) Quantification of DRSC Gag-mCherry reporter activation (B) and YFP-A3G reporter degradation kinetics (C) over time in a minimum of 20 individual cells from one of three representative live cell imaging time courses following infection at high (MOI = 3, red) or low (MOI = 1, blue) MOI. Averages for each condition are shown by thick lines. Error bars depict a 95% confidence interval. (D) Analysis of percent of DRSCs activated when infected with differing amounts of virus (HIV-1NL4-3 (E-R-/CFP)). Infected cells were counted in images taken for each condition in three independent infections. (E) Analysis of average Gag-mCh MFI of infected cells in each condition in (D) with the exception of the condition at MOI = 0, where the fluorescence in the mCh channel for uninfected cells is displayed. N = 45 cells. (F) Analysis of time to mCherry puncta formation by tracking Gag-mCherry fluorescence in DRSCs after initial infection through time-lapse live cell imaging. N > 100. (G) Analysis of percent of DRSCs activated when infected at an MOI of 1 (HIV-1NL4-3 (E-R-/CFP)) with differing amounts of Lenacapavir. Infected cells were counted in images taken for each condition in three independent infections. (H) Analysis of average Gag-mCh MFI of infected cells in each condition in (G). N = 45 except for infections treated with 10 µM (N = 0) or 5 µM (N = 4) Lenacapavir due to no or fewer cells infected under these conditions, respectively. Error bars depict ± SEM. P-values are depicted as follows: * <0.05, ** <0.01, **** <0.0001. Student’s t test was conducted to compare data for statistical significance.
To investigate the limits of viral detection, we conducted an additional experiment exploring the dynamic range of the assay through further fixed timepoint analysis (at 24 hpi) for a dose titration (Fig. 2D and E). Overall, we observed that dose titration yielded a linear decay in the number of infected cells, as expected. However, per cell MFI remained consistent at or below MOI = 1, consistent with our detecting a single integrated provirus in each infected cell at low MOI. In contrast, we detected higher per-cell MFI values at virus titers above MOI = 1, consistent with the detection of multiple integrated proviruses. Taken together, we concluded that we can interpret levels of Rev- and Tat-dependent activation of our Gag-mCherry reporter as a proxy measurement for the number of integrated proviruses.
We also predicted that the Gag-mCherry marker would allow us to monitor the extent of infection through a second method of tracking rates of virus particle assembly. Gag drives HIV-1 particle formation at the plasma membrane wherein ~1,500 Gag molecules multimerize to form the immature viral capsid that packages two copies of the viral RNA genome (73, 74). Particle assembly is driven through a cooperativity-based mechanism wherein Gag multimerization and subsequent membrane localization are triggered when the intracellular concentration of Gag reaches a threshold level (75–77). Because Gag multimerization is necessary for virion production, we hypothesized that higher MOI would lead to faster kinetics of virion assembly as defined by Gag-mCherry reporters forming bright puncta at the cell’s plasma membrane. As expected, we observed a more rapid appearance of Gag-mCherry puncta for high MOI infection (8.76 hpi ± 3.43 h) relative to low MOI infection (18.02 hpi ± 4.08 h) (Fig. 2A and F), illustrating that DRSCs can report on levels of viral gene activity based on virion production kinetics.
Reporter cells are used extensively in HIV-1 research to test antiviral inhibitors, so we tested the ability of DRSCs to measure HIV-1 inhibition by the capsid inhibitor Lenacapavir (78). To this end, DRSCs were infected with VSV-G pseudotyped HIV-1_NL4-3_ at an MOI of 1, with cells analyzed at 24 hpi for the percent of cells infected (Fig. 2G) as well as the per-cell Gag-mCherry MFI (Fig. 2H). As expected, we detected dose-dependent inhibition of infectivity, with Lenacapavir reducing the number of cells infected but not affecting per-cell Gag-mCherry expression levels, consistent with the drug acting to prevent proviral integration but not affecting viral gene expression.
DRSCs can be used to delineate strain-specific HIV-1 Vif activities
HIV-1 exhibits one of the highest known mutation rates of all viruses (79, 80). Large sources of genetic variability occur within the HIV-1 regulatory and accessory genes tat, rev, vif, and vpr, and several studies have implicated this variability as of important relevance to pathogenic outcomes in humans (30–45). To test if the DRSC platform could be used for detection of accessory protein heterogeneity in this context, we engineered HIV-1_NL4-3_ reporter viruses wherein we replaced the native vif allele with alleles derived from a diverse panel of clinical strains, previously demonstrated by Binka et al. to be associated with differences to A3G-degradation capabilities and overall viral replication fitness (39) (Fig. 3A). The amino acid similarity of the vif alleles tested is shown in Fig. 3B, with the vif alleles having an average difference of 9.1% (17.5 AA) when compared to NL4-3, and with C1 being the most divergent [with a 12.4% (24 AA) variance]. The Vif residues implicated in A3G binding and degradation by Vif are present in the N-terminus and C-terminus, respectively (81–83). Additional controls included a virus wherein we inactivated native vif_NL4_-3 using mutagenesis (Vif(−) = K26stop, H27stop) or replaced the vif_NL4_-3 allele with vif from an alternative lab strain (HXB2) known to degrade A3G with similar potency (39, 84–86).
YFP-A3G degradation kinetics for vif alleles derived from patient isolates. (A) Depiction of chimeric HIV-1NL4-3 (E-R-/CFP) virus genome backbone into which vif alleles were swapped. (B) Depiction of vif alleles used in this experiment and their amino acid differences. (C) Images of YFP-A3G and Gag-mCherry fluorescence in DRSCs infected with the panel of vif-swapped chimeric viruses at 10 hpi. Scale bars represent 10 µm. (D) Quantification of Gag-mCherry expression over time in DRSCs infected with the chimeric vif-swapped viruses at an MOI of 1. (E) Quantification of YFP-A3G downregulation over time in DRSCs infected with the chimeric vif-swapped viruses at an MOI of 1 from a live cell imaging time course with individual cell fluorescence tracked for 30 h for each vif allele (see also Movie S3). N ≥ 30 cells tracked for each vif allele infection from one representative experiment. Average kinetics for each vif allele are shown. (F) Quantification of B3 Vif infection YFP-A3G degradation kinetics under low (MOI = 1) and high (MOI = 3) MOI conditions and compared with NL4-3 Vif high and low MOI infection (see also Movie S3). (G) Western blot analysis of DRSCs infected with the panel of vif-swapped chimeric viruses at 36 hpi (MOI = 1). Blots were incubated with anti-A3G and anti-p24HIV-1. Error bars depict a 95% confidence interval. One-way analysis of variance (ANOVA) was used for statistical comparison of vif allele fluorescence kinetics to NL4-3 Vif infection data. P-values are depicted as follows: **** <0.0001. n.s., not significant.
We utilized single-cell tracking of DRSCs infected with each virus at an MOI of 1 to track rates of YFP-A3G degradation for each vif allele expressed in an otherwise identical virus genome backbone. Based on the Gag-mCherry response rates, none of the vif alleles notably affected Tat/Rev driven gene expression over a 30 h time course (Fig. 3C and D). Relative to Vif_NL4-3_, similar YFP-A3G degradation rates were observed for each vif allele tested with the exception of B3 and C1 (Fig. 3C and E; Movie S3), with the B3 and C1 results consistent with decreased potency measurements previously reported in Binka et al. (39). C1 Vif degraded YFP-A3G but at a significantly slower rate (T_1/2_ of ~10 h) relative to Vif_NL4-3_. By contrast, B3 Vif was only able to degrade YFP-A3G when cells were infected at an elevated MOI, and even then with relatively slow kinetics (T_1/2_ = ~15 h) (Fig. 3F). Interestingly, when infecting with B3 Vif virus at high MOI, live-cell imaging revealed YFP-A3G localized to Gag-mCherry puncta during infection, consistent with A3G being removed from the cytoplasm by B3 Vif too slowly to prevent A3G incorporation into virions (Movie S3). We confirmed the relative A3G degradation capabilities of our panel of vif alleles by conducting western blot analysis on lysates of DRSCs infected with the vif-swapped viruses (Fig. 3G). These results validated DRSCs as a sensitive tool capable of detecting variability within the Vif function and achieving the granularity needed to reveal differences in the net capacity of Vif to degrade and suppress YFP-A3G over the duration of the infectious cycle.
DRSCs for unbiased measurements of host cell cycle dysregulation
In Fig. 3 we established that single-cell tracking can reveal differential Vif-mediated A3G degradation capabilities and kinetics. Because live-cell imaging is not available in all settings, our next goal was to assess the capacity of the DRSC platform to detect viral heterogeneity in a fixed cell population at a single timepoint post-infection (Fig. 4). To this end, we used Cellpose, a deep learning-based segmentation software (87), to detect and segment individual infected cells expressing the Gag-mCherry “ON” signal prior to measuring single-cell YFP-A3G levels. Fig. 4A compares NL4-3 (WT), Vif(−), C1, and HXB2 chimeric Vif infection conditions at 24 hpi. Consistent with live cell imaging, our Cellpose single timepoint analysis in Fig. 4B demonstrated that WT-infected cells displayed low levels of YFP-A3G fluorescence relative to Vif(−) infected cells, similar to most other vif allele infections, with C1 Vif exhibiting an intermediate phenotype and B3 Vif showing similar intracellular levels of YFP-A3G as the Vif(−) infection. NL4-3, Vif(−), and C1 infected cells exhibited average normalized YFP-A3G levels of 0.15, 1.0, and 0.36, respectively, consistent with C1 Vif exhibiting a slower relative rate of A3G degradation.
Vif-mediated cell cycle arrest varies by vif allele. (A) Images of DRSCs infected with NL4-3, Vif(−), C1, and HXB2 Vif chimeric viruses 48 hpi, with examples of cells undergoing arrest and rounding up pointed to by arrows. Scale bars represent 100 µm. (B) Quantification of YFP-A3G levels within single DRSCs infected with chimeric vif allele viruses (24 hpi) through Cellpose segmentation. N = 3. (C) Example of DRSC mCherry reporter fluorescence being segmented into masks through Stardist analysis. (D) Quantification of % of rounded cells from all infected cells per image of DRSCs infected with our panel of chimeric vif-swapped viruses using a FIJI-Stardist workflow. A minimum of 100 infected cells in each of three images of infected cells 48 hpi from each of our vif allele movies were analyzed. (E) Images of a DRSC depicting fluorescence and morphology changes from initial infection (with HIV-1NL4-3 (E-R-/CFP) virus) of a DRSC to cell cycle arrest (rounding up). Scale bars represent 10 µm. (F) Manual quantification of time to arrest or division after onset of infection for DRSCs infected with our panel of vif-swapped viruses and tracked through live cell imaging. N ≥ 100 cells tracked for each vif allele infection. (G) Quantification of % of cells that underwent cell cycle arrest from data in F. Infections were conducted at an MOI of 1. Graphs depict ± SEM. One-way ANOVA was used for statistical comparison to NL4-3 Vif. Only significant differences are shown. P-values are depicted as follows: * <0.05, **** <0.0001.
A second useful attribute of machine learning-based image analysis tools is their capacity to measure cell morphological changes that might relate to HIV-1 pathogenicity. For example, in addition to degrading A3G, Vif was recently shown to induce cell cycle arrest through antagonism of host PP2A regulatory proteins (88–90). PP2A phosphatase regulator PPP2R5 subunits (A–E) have been shown to be degraded by some, but not all, patient-derived and laboratory Vif isolates. Importantly, the two lab strains included in our analysis (NL4-3 and HXB2) are known to exhibit different phenotypes, wherein Vif_NL4-3_ induces arrest, while Vif_HXB2_ does not (69, 86, 91). Accordingly, we next asked if DRSCs could be used to track cell morphology changes consistent with Vif’s effects on the cell cycle. To this end, we generated an image analysis workflow to measure cell morphology differences in an unbiased manner using the FIJI plug-in Stardist (https://imagej.net/plugins/stardist) (92) (Fig. 4C), with this analysis demonstrating marked variability in cell morphology for several of the vif alleles tested. NL4-3 and C2 Vifs caused the highest degree of change (cell rounding consistent with cell cycle arrest) as we have previously described (71, 93), while B3, F3, and HXB2 Vif had little to no effect on cell morphology, more closely matching the Vif(−) control (Fig. 4D). C1 and D1 Vifs caused intermediate levels of arrest when compared to C2 and NL4-3.
To validate the unbiased, automated “single-image” approach, we re-analyzed our vif allele infection time-lapse movies (see Fig. 3), tracking individual HIV(+) cells to determine whether they underwent cell cycle arrest or accomplished cell division (Fig. 4E). These measurements closely matched the results from our automated approach (Fig. 4F and G) but with the kinetic analysis providing more data granularity including the degree and timing of arrest. The C2 allele caused arrest levels similar to NL4-3 (98.1% and 92.9%, respectively), with B3 and F3 Vifs rarely causing arrest (0.8% and 11.9%, respectively), and C1 and D1 Vif infections causing an intermediate phenotype (arrest in 34% and 53.4% of infected cells, respectively). These results were consistent with a recent report from Salamango et al. that demonstrated NL4-3 Vif to be a strong degrader of PPP2R5 while several patient isolate Vifs were less active in this function (69, 94).
In summary, in addition to differences to Vif allele-specific effects on YFP-A3G degradation, DRSCs can also readily allow for detection of differential viral effects on cell morphology through single-timepoint analysis, in this case impacting the cell cycle.
Use of DRSCs to differentiate between R5- and X4-tropic viruses
HIV-1 has a main cell receptor, CD4, but uses either of two coreceptors, CXCR4 (X4) or CCR5 (R5) (95–101). Most transmissible strains of HIV are R5-tropic, with the virus sometimes developing X4-tropism during late-stage infection, and with some strains being dual-tropic (X4R5) (102–104). Some HIV-1 subtypes have been found to cause higher mortality rates than others, particularly subtype D, and are attributable, at least in part, to dual-tropism (8, 10, 13, 14, 83–86). Moreover, defining co-receptor usage is necessary for patients undergoing combination antiretroviral drug treatment with a co-receptor inhibitor (105). Predictions of receptor tropism can be made by sequencing the env region of the genome, but such predictions can be unreliable (106–108).
To differentiate between X4 and R5 viruses, we engineered DRSCs that expressed either CXCR4 or CCR5, or both (Fig. 5A) and confirmed co-receptor expression using flow cytometry (Fig. 5B). To test if this coreceptor panel of DRSCs would then allow for determination of coreceptor tropism of incoming virus by detecting the presence of infected YFP-A3G(−)/Gag-mCherry(+) cells, our panel of DRSCs was subsequently infected with HIV-1_NL4-3_ (X4-tropic), HIV-1_SUMA_ (R5-tropic transmitted founder isolate), or HIV-1_89.6_ (dual-tropic transmitted founder isolate). As expected, the X4-tropic NL4-3 virus infected both X4- and X4R5-DRSCs, the R5-tropic SUMA virus infected the R5- and X4R5-DRSCs, and the dual-tropic 89.6 infected all DRSC types (Fig. 5C and D). Interestingly, we found that the dual-tropic 89.6 virus caused higher levels of infection in the X4- and X4R5-DRSCs than in our R5-DRSCs, potentially indicating that the 89.6 virus infection was more efficient in utilizing the CXCR4 coreceptor relative to CCR5 (Fig. 5D). In conclusion, in addition to detecting virus and measuring virological and cell responses, a panel of coreceptor-specific DRSCs can also be used to define the relative receptor tropism of HIV-1 viruses.
DRSC panel for HIV-1 coreceptor tropism. (A) Cartoon depiction of DRSC coreceptor panel. (B) Flow cytometry histograms depicting CXCR4, CCR5, and YFP-A3G levels for X4-, X4R5-, and R5-DRSCs. Mean coreceptor and YFP levels relative to X4R5-DRSCs are displayed above each corresponding histogram. (C) Images of X4-, X4R5-, and R5-DRSCs infected with unattenuated X4-tropic NL4-3, R5-tropic SUMA, and dual-tropic 89.6 HIV-1 viruses at an MOI of 1. Cells were fixed at 24 hpi. Scale bars represent 10 µm. (D) Quantification of the number of DRSCs infected in three separate infections with each virus (NL4-3, SUMA, 89.6) per 20× image. Titer was performed on X4R5-DRSCs, and cells were infected with a virus that caused infection at an MOI = 1 in X4R5-DRSCs. Number of infected cells in each image was normalized to the average number of infected cells for each virus in X4R5-DRSCs. One-way ANOVA was used for statistical comparison. P-values are depicted as follows: * <0.05, **** <0.0001.
DISCUSSION
Here, we describe the creation of the DRSC assay as a proof-of-concept cell system for detecting, quantifying, and carrying out multivariate analysis of HIV-1 replication. In this system, HeLa-CD4 cells were engineered to express two independent HIV infection-linked reporters; a degradation-based “OFF” YFP-tagged biosensor and a virus-responsive “ON” mCherry-tagged biosensor. We demonstrated using these “ON-OFF” markers that we can both detect HIV-1 and elucidate single-cell attributes of virus-host interactions of potential relevance to disease progression. First, the YFP-A3G and Gag-mCherry reporters allowed us to measure the level of infection by directly monitoring the kinetics of YFP-A3G degradation coupled to Gag-mCherry activation and virus particle assembly ([Fig. 1 and 2](#F1 F2)). Second, comparisons of viruses encoding strain-specific vif alleles demonstrated heterogeneity in the relative capacities of differing Vif proteins to downregulate A3G and cause cell cycle effects ([Fig. 3 and 4](#F3 F4)). Third, generating distinct versions of DRSCs that express either the CCR5 or CXCR4 co-receptor provided even more granularity, allowing us to distinguish between R5-, X4-, and dual-tropic viruses and confirming that DRSCs can be activated by transmitted/founder strains of HIV-1.
Taken together, our DRSC platform provides an example of how cell-based systems and multicolor imaging can be applied for multivariate analyses and detection of intact HIV-1 viruses. These tools and approaches are intended to be useful for basic research studies of HIV-host interactions, screening for new therapies, and detecting and characterizing patient-derived viruses.
Cell-based reporters have traditionally played major roles in detecting and quantifying HIV-1 infection in diverse contexts including virus titering, assaying for antibody neutralization (109), studying inhibition by pharmaceutical drugs or antibodies (53), and tracking the latent patient reservoir (53, 110). However, to date most cell-based modalities for detecting replication-competent HIV-1 and studying viral dynamics are one-dimensional; attractive in their simplicity but leaving large amounts of untapped data. We recognize that a potential limitation of the assay is that DRSCs are not a T-cell-derived reporter cell line. However, HeLa cell-based reporters (e.g., TZM-bl) have been used extensively for HIV-1 studies including for the detection of patient isolate viruses (54, 111, 112) and, as previously noted, are far superior to T cells (or monocyte-derived cell lines) for tracking cellular and viral trafficking and measuring single-cell dynamics due to their stationary nature and spread morphology exhibiting a relatively large nucleus and abundance of cytoplasm.
The popular TZM-bl and GHOST reporter systems are Tat-responsive (LTR-driven) and thus only require a single HIV-1 gene to be functional within the integrated genome to produce a single positive signal. Sup-GGR, a recently described dual-reporter cell line for HIV-1, has improvements in that it expresses both Gaussia luciferase and hrGFP in a Tat- and Rev-dependent manner, thus requiring the presence of functional versions of both viral auxiliary proteins (113). Our DRSC strategy is novel in that it combines two functionally relevant visible reporters (Gag-mCherry and YFP-A3G) with the reporters used to partially “genotype” the infecting virus using open-source image analysis pipelines. Antiviral resistance prediction has historically relied largely on sequencing to determine whether a patient’s virus is susceptible to a given antiviral. Since newer antiviral therapies are being designed to have higher genetic barriers to resistance, more complex and strain-specific resistance patterns are bound to emerge that are more difficult to detect via sequencing. Therefore, phenotypic assays like the described DRSC assay could be particularly useful for patients who have failed multiple regimens (114). We do note, however, that our assay is by its nature limited to reporters detecting what they can detect so although DRSCs could have an advantage over sequencing in that they will only detect intact, replication-competent genomes, the cells would only report on defects to Tat, Rev, or Vif function and may miss mutations in other parts of the genome. However, coupling DRSC infection to genome sequencing could serve as a means to generate a more complete picture of any patient-derived viral quasispecies.
DRSCs could also, in principle, be used in the context of high-content drug screens as a multivariate approach reporting on several key targets simultaneously, e.g., gene activation (Tat/Rev activity), Vif function, and Gag multimerization for virion assembly inhibitors. In this context, we note that the use of additional loss-of-signal fluorescent reporters linked to alternative host response proteins will provide future avenues for DRSC development. For example, we have already engineered versions of DRSCs that express reporters linked to BST2 (also known as Tetherin), CD4, or SERINC5 that can be used to view the differential host protein degradation activities of vpu, env, or nef alleles from different subtypes of HIV-1 (Fig. 6) (115–121). Although the kinetics of degradation are slower for these reporters relative to A3G, they illustrate the potential power of including additional reporters attached to functional proteins in a DRSC format, allowing for even richer multivariate screens of viral activities in a high-throughput format.
HIV-1 mediated degradation of YFP-tagged host factors. (A) Example of uninfected YFP-tagged CD4 reporter cells and cells 20 h after infection with an NL4-3/CFP reporter virus at an MOI of 1. (B) Kinetic analysis of CD4-YFP degradation by HIV-1 in 10 infected CD4-YFP reporter cells subjected to live cell imaging after infection at an MOI of 1. (C) Example of uninfected YFP-tagged BST2 reporter cells and cells 20 h after infection with an NL4-3/CFP reporter virus. (D) Kinetic analysis of BST2-YFP degradation by HIV-1 in 10 infected BST2-YFP reporter cells subjected to live cell imaging after infection. Individual cell kinetics are depicted by yellow lines, the average of the 10 cells analyzed per reporter cell infection is represented by the solid black line, and T1/2 is depicted by the dotted black line. T = 0 was treated as the onset of CFP expression after infection. Scale bars represent 10 µm.
Our finding that vif alleles can exhibit different A3G degradation kinetics and cause markedly different effects on the cell cycle arrest further demonstrates the benefits of using single-cell dynamics-based assays to study virus–host interactions. Accessing these combined traits would not be feasible using traditional low-content biochemical read-outs. Variability in Vif function may be related to pathogenesis, as specifically in the case of A3G degradation, it has been reported that a suboptimal degradation of A3G may be beneficial to the virus in promoting progeny genome variation, developing antiretroviral inhibitor resistance, and possibly leading to faster progression of pathogenesis (37–40, 122–125). Thus, Vifs that may be “defective” but still functional in A3G degradation such as the C1 vif allele we tested may indeed play a large part in HIV-1’s evasion of treatment efforts. Why B3 Vif acted as a null mutant in regard to both A3G degradation and cell cycle arrest is unknown. Binka et al. previously reported B3 Vif as being expressed at equal levels compared to other Vifs tested (39), but exhibited loss-of-function, suggesting to us that the defect maps to the L64M and I87T mutations, of which only I87 has been implicated in Vif-mediated A3G degradation (126).
The detected heterogeneous abilities of the different vif alleles we tested to cause cell cycle arrest may also be relevant to the pathogenicity of HIV-1 strains. PP2A enzymes form complexes with PPP2R5 subunits which control substrate identification and are necessary for the function of the complex (127–129). PPP2R5 subunits are important for the replication of other viruses and their degradation is highly conserved among viral Vifs, including HIV-1 Vif (69, 130–132). Their degradation may be beneficial to HIV-1 as PPP2R5 may contribute to immune activation and control of protein translation (132, 133). Our arrest analysis results matched those previously reported for NL4-3 Vif having a high ability to induce cell cycle arrest, which consequently has been shown to be due to PPP2R5 subunit degradation.
In summary, the DRSC platform provides a novel framework for applying single-cell imaging to identify functional viral genomes and elucidate various viral attributes from both basic HIV-1 studies and in determining patient viral phenotype, potentially relevant to disease progression.
MATERIALS AND METHODS
Cell culture
Human HeLa cervical cancer cells and human embryonic kidney 293T (HEK293T) cells were purchased from the American Type Culture Collection. Cells were maintained at 37°C and 5% CO_2_ and cultured in Dulbecco’s Modified Eagle Medium (Gibco, cat. 11965092) supplemented with 10% heat-inactivated fetal bovine serum (FBS, Sigma, cat. F2442) and 1% penicillin-streptomycin-L-glutamine solution (PSG, Sigma, cat. G6784).
Plasmids and virus production
Our CFP-expressing HIV-1 proviral reporter viruses were originally derived from an established NL4-3 molecular clone (pNL4-3/E-R-/luc, a kind gift of Dr. Nathaniel Landau and obtained through the NIH HIV Reagent Program) (134) that expressed firefly luciferase from the nef locus and contained inactivating point mutations within the env and vpr reading frames for enhanced biosafety. In our versions (pNL4-3/E-R-/CFP), the luciferase reporter was replaced with CFP to allow for fluorescence-based detection of infected cells (135). The vif alleles used for the analyses presented in [Fig. 3 and 4](#F3 F4) were a generous gift of Dr. Viviana Simon (Mt. Sinai School of Medicine, New York, NY) (39). Vif allele swaps were conducted through the use of overlapping PCR to insert desired vif alleles into our pNL4-3/E-R-/CFP backbone using PacI and AgeI cut sites. To generate a reporter virus, HEK293T cells were transfected with the pNL4-3/E-R-/CFP plasmids along with VSV-G and polyethylenimine. Media was exchanged 6 h post-transfection. VSV-G pseudotyped virus-like particles (VLPs) were then collected 48 h post-transfection from HEK293T cell media by filtering spent media through a 0.45 µm syringe filter and were frozen at −80°C until use. Viral stocks were titered using DRSCs.
For co-receptor studies (Fig. 5), full-length NL4-3, SUMA, and 89.6 viruses were generated from proviral plasmids transfected into HEK293T cells as described above. Infectious molecular clones for these viruses were obtained through the NIH HIV Reagent Program as kind gifts of Drs. M. Martin, John Kappes, Christina Ochsenbauer, and Ronald G. Collman (136, 137).
Creation of DRSCs
DRSCs were engineered through retroviral transduction of YFP-A3G and HIV-1-responsive Gag-mCherry transgenes. The retroviral vector for YFP-hA3G (derived from pYFP-hA3G, a generous gift of Dr. Michael Malim, King’s College London) has been described previously (71). The HIV-responsive Gag-mCherry reporter was engineered as a derivative of plasmid pGPV-RRE (138) encoding the first half of the HIV-1 genome encoding gag-pol and vif upstream of a Rev Response Element (RRE) followed by the HIV-1 3’ long-terminal repeat region. To generate the Gag-mCherry fusion and abrogate Gag-Pol expression, the mCherry coding region was inserted into SacII and BsmB1 sites downstream of the Gag coding region (139, 140), yielding a C-terminal Gag-mCherry fusion protein. So that we could detect incoming Vif, the reporter’s vif allele was inactivated by inserting stop codons at the lysine-26 and histidine-27 codons. The vector also retained a small portion of the vpr coding region (encoding the first 17 amino acids) but lacked all other viral genes including Vpu, Env, Rev, Tat, or Nef. To generate a single-round vector, the Gag-mCherry plasmid (pNS341) was co-expressed with an HIV-1 packaging plasmid (psPax2) and VSV-G (141) to generate a “mini-virus” that was subsequently used to transduce YFP-A3G target cells. Single-cell DRSC clones were then isolated and screened for good response kinetics. CD4-YFP and YFP-BST2 DRSCs were generated similarly to YFP-A3G DRSCs, using either a previously described CD4-YFP retrovector (140, 142) or a new YFP-BST2 retrovector encoding the yfp reading frame fused to the BST2 reading frame to generate an N-terminal YFP-tag separated from BST2 by a glycine-rich linker.
CD4 and CCR5 receptors were then added to DRSCs through retroviral transduction, with single clones with positive receptor expression selected for expansion. To create CXCR4 knock-out DRSCs, we utilized lentiviral-mediated CRISPR Cas9. lentiCRISPR v2 was a gift from Dr. Feng Zhang (Addgene plasmid # 52961; https://www.addgene.org/52961/) (143). gRNAs for CRISPR targets of the human CXCR4 gene were designed using the IDT gRNA design tool and were inserted into the lentiCRISPRv2 plasmid according to the Zhang Lab Lentiviral CRISPR Toolbox protocol. All lentiviral transductions were conducted with VSV-G pseudotyped virus with spinoculation for 2 h at 2,000 × g. The resulting cells were then single-cell cloned after sorting through flow cytometry and screened for the presence of proper receptors/reporters.
Microscopy and image analysis
Cells for live cell imaging were plated at 40% confluency in 8-well glass-bottom plates (Ibidi, cat. 80827) and infected by adding VLP containing supernatant and incubating for 8 h before the start of live-cell imaging. For low MOI movies, 50 uL of virus-containing media supplemented was added to each Ibidi well, and 150 uL of VLPs were added to each well for high MOI conditions. All movies and images were acquired using 20× or 40× objective lenses on either a Nikon Ti-Eclipse inverted wide-field microscope using an Orca-Flash4.0 C11440 digital complementary metal oxide semiconductor camera or a Nikon A1R confocal microscope equipped with a Pathology Devices Live Cell stage-top incubation system which maintained cells at 37°C, 5% CO_2_, and 50% humidity. In most experiments, multichannel images were acquired every 60 min for 72 to 96 h, starting at 8 hpi.
For live cell analyses, randomly selected cells from three independent acquisition points were analyzed for each condition by manually measuring the MFI at each 60 min time point image of each corresponding fluorescent signal within the cell of interest from the start of infection (1 h before CFP expression onset) until the end of the movie or when the cell underwent cell cycle arrest or division. Cell fate analysis was conducted by tracking a minimum of 100 cells from each vif allele infection and measuring the time from onset of infection (1 h before CFP expression) until cell division or arrest. For fixed cell imaging, cells were fixed using 4% paraformaldehyde (PFA), permeabilized with 0.2% Triton-X, and stained with 1× DAPI (4′,6-diamidino-2-phenylindole) to visualize nuclear DNA. For the percent of cells infected vs uninfected, nuclei within YFP(−) and mCherry(+) (infected) DRSCs were counted and compared to the total number of nuclei counted in three images from each condition and averaged. For the Lenacapavir dose titrations, DRSCs were infected with NL4-3 HIV-1 virus at an MOI of 1 and fixed with 4%PFA 24 hpi for imaging and analysis. Lenacapavir (MedChemExpress, Cat. HY-111964) was added at the indicated doses during addition of the virus.
Western blots
DRSCs were lysed with cracking buffer (8 M urea, 5% SDS, 40 mM Tris 7.0, 0.1 mM EDTA, 25% glycerol, bromophenol blue). The amount of lysate loaded in each well was normalized based on GAPDH levels. Lysates were run using Mini PROTEAN TGX precast gels (Bio-Rad, Cat# 4569035) and transferred to a PVDF transfer membrane (Immobilon, Millipore, Cat# 1PFL00010) using a Power Blotter XL semi-dry transfer system (Invitrogen). Membranes were incubated overnight at RT in Intercept blocking buffer (LI-COR, Cat# 927-60001), 1 h at RT for primary antibodies, and 40 min at RT for secondary antibodies. Antibodies were diluted in a blocking buffer. Antibodies used were anti-APOBEC3G (Cell Signaling, Cat# D96CZ, 1:1,500), anti-GAPDH (Santa Cruz Biotechnology, Cat# sc-32233, 1:1,000), and anti-HIV-1 p24 (made in house, 1:150). The membrane was then imaged using a LI-COR Odyssey Fc with images analyzed using Image Studio Lite software.
Cellpose (https://www.cellpose.org/) was used to segment individual cells through the Gag-mCherry signal in the cytoplasm of infected DRSCs, utilizing the Cytoplasm 2.0 pre-trained model with a cell diameter of 30 microns while simplifying contours. The resulting spots were exported as ROIs to ImageJ’s ROI manager, where fluorescence measurements were made on the YFP channel for each cell ROI. To measure cell morphology, we used the FIJI plug-in Stardist (https://imagej.net/plugins/stardist) to segment the round cells from their fluorescent signals and proceeded to use that image processing tool to create regions of interest around cells and measure their circularity. The formula for circularity is circularity = 4pi(area/perimeter^2^), so as the value reaches closer to 1, the closer the object measured is to a perfect circle. We determined that Vif-arrested cells had a circularity of 0.96 and above by confirming arrest in analyzed cells within one of our NL4-3 Vif infection movies, so we set that circularity limit along with a minimal area size requirement as our threshold for detecting if a cell is arrested.
Flow cytometry
Infected and uninfected cells were washed with 1× PBS, trypsinized, and then fixed with 2% PFA (4% PFA for un-attenuated infection cells) in preparation for flow cytometry analysis. For co-receptor level analysis, our panel of co-receptor DRSCs was incubated with conjugated antibodies for CCR5 (PE anti-human CD195 (CCR5), cat. 313707 BioLegend) and CXCR4 (APC anti-human CD184 (CXCR4), cat. 306509 BioLegend) for 30 min at 4°C. Cells were sorted using a BD FACSAria Cell Sorter at the UW-Madison Flow Cytometry Laboratory and results were analyzed with FlowJo software.
Statistical analyses
The quantified results represent averages from three independent fields of view for live cell imaging analyses and three independent experiments for all other tests. Statistical significance was calculated using the Student’s t test or one-way analysis of variance (ANOVA) as required based on the number of conditions compared and was defined as P ≤ 0.05. GraphPad Prism was used for statistical analysis and graphing of results.
The reference list from the paper itself. Each links out to its DOI / PubMed record.
- 1Hu W-S, Rhodes T, Dang Q, Pathak V. 2003. Retroviral recombination review of genetic analyses. Front Biosci 8:d 143–155. doi:10.2741/94012456341 · doi ↗ · pubmed ↗
- 2Smyth RP, Davenport MP, Mak J. 2012. The origin of genetic diversity in HIV-1. Virus Res 169:415–429. doi:10.1016/j.virusres.2012.06.01522728444 · doi ↗ · pubmed ↗
- 3Coffin J, Swanstrom R. 2013. HIV pathogenesis: dynamics and genetics of viral populations and infected cells. Cold Spring Harb Perspect Med 3:a 012526. doi:10.1101/cshperspect.a 01252623284080 PMC 3530041 · doi ↗ · pubmed ↗
- 4Sanjuán R, Domingo-Calap P. 2021. Genetic diversity and evolution of viral populations. Encycl Virol 53–61. doi:10.1016/B 978-0-12-809633-8.20958-8 · doi ↗
- 5Domingo E. 2016. Molecular basis of genetic variation of viruses. Virus Popul:35–71. doi:10.1016/B 978-0-12-800837-9.00002-2 · doi ↗
- 6Renjifo B, Gilbert P, Chaplin B, Msamanga G, Mwakagile D, Fawzi W, Essex M. 2004. Preferential in-utero transmission of HIV-1 subtype C as compared to HIV-1 subtype A or D. AIDS 18:1629–1636. doi:10.1097/01.aids.0000131392.68597.3415280773 · doi ↗ · pubmed ↗
- 7John-Stewart GC, Nduati RW, Rousseau CM, Mbori-Ngacha DA, Richardson BA, Rainwater S, Panteleeff DD, Overbaugh J. 2005. Subtype C Is associated with increased vaginal shedding of HIV-1. J Infect Dis 192:492–496. doi:10.1086/43151415995964 PMC 3387274 · doi ↗ · pubmed ↗
- 8Hudgens MG, Longini IM Jr, Vanichseni S, Hu DJ, Kitayaporn D, Mock PA, Halloran ME, Satten GA, Choopanya K, Mastro TD. 2002. Subtype-specific transmission probabilities for human immunodeficiency virus type 1 among injecting drug users in Bangkok, Thailand. Am J Epidemiol 155:159–168. doi:10.1093/aje/155.2.15911790680 · doi ↗ · pubmed ↗