The Conditioned Environmental Center‐Periphery Hypothesis of Biogeography: Statistical Evidence From Tree Species
Pablo Antúnez, Martin Ricker

TL;DR
This paper challenges the traditional idea that species are most common at the center of their environmental range by showing that natural limits often cause asymmetry in species distributions.
Contribution
A new conditioned environmental center-periphery hypothesis is proposed, accounting for natural truncations in environmental gradients.
Findings
Only 12% of species-environment combinations showed highest probability intervals including the midpoint of the gradient.
Environmental truncations, like non-negative precipitation, often prevent symmetric expansion of species ranges.
The classical center-periphery hypothesis is invalid in 55% of cases due to these truncations.
Abstract
It has been discussed for decades whether species occur most frequently at their geographic center, and more recently at their environmental niches' center. The aim here is to analyze for each environmental gradient separately the ecological niche of 12 Mexican tree species and 16 abiotic environmental gradients, in the form of statistical probability density functions. Is a symmetrically positioned center always possible by searching for additional data? For each species‐variable combination, the occurrences along an environmental gradient were grouped in histograms. Logistic regression was used to fit a polynomial equation, whose degree depended on the number of significantly different bins. A highest‐probability interval on the gradient was determined, where 25% of the individuals were found with the highest probability. The relative distance from the center (midpoint) of the…
Genes, proteins, chemicals, diseases, species, mutations and cell lines named across the full text — each resolved to its canonical identifier and authoritative record.
Click any figure to enlarge with its caption.
 Figure 1
 Figure 2
 Figure 3
 Figure 4
 Figure 5
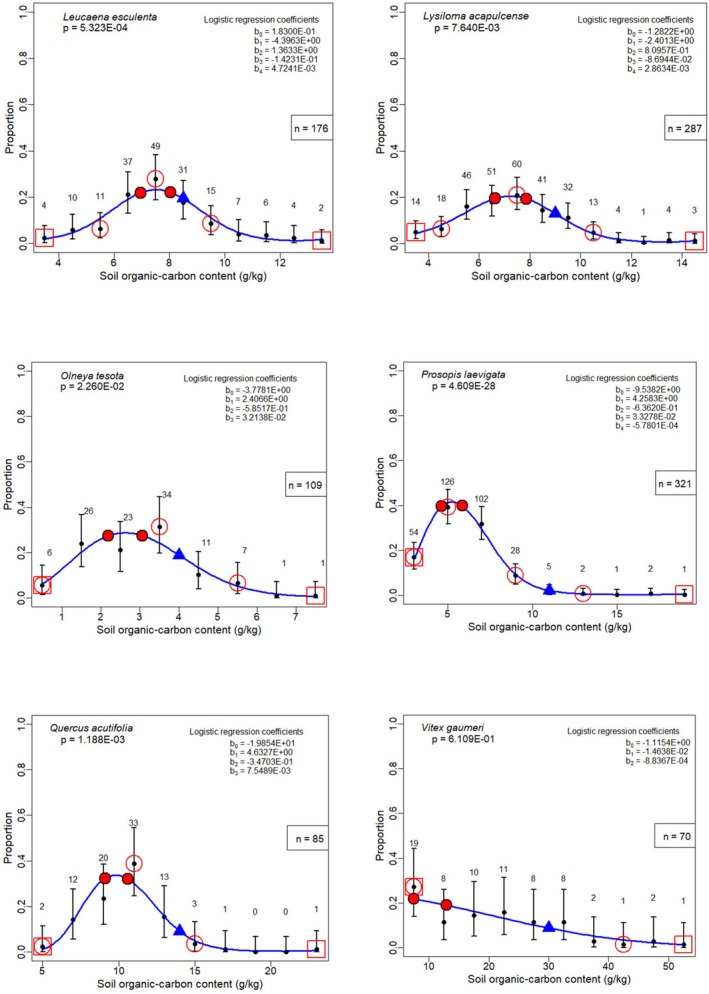 Figure 6
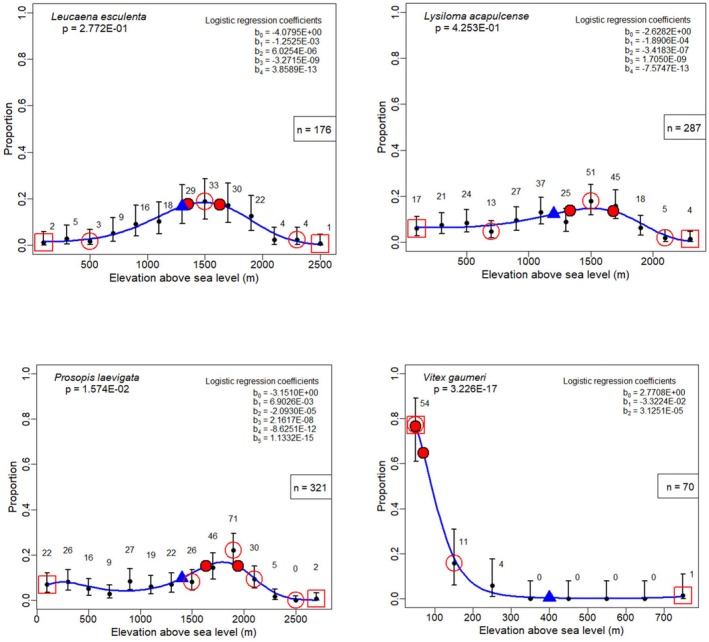 Figure 7
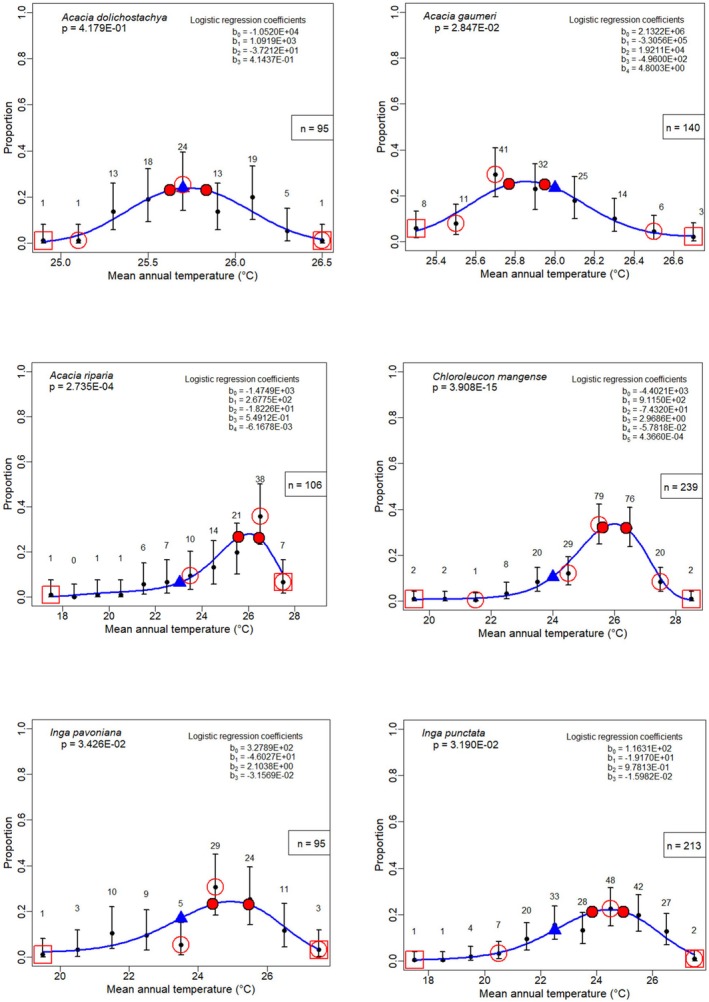 Figure 8
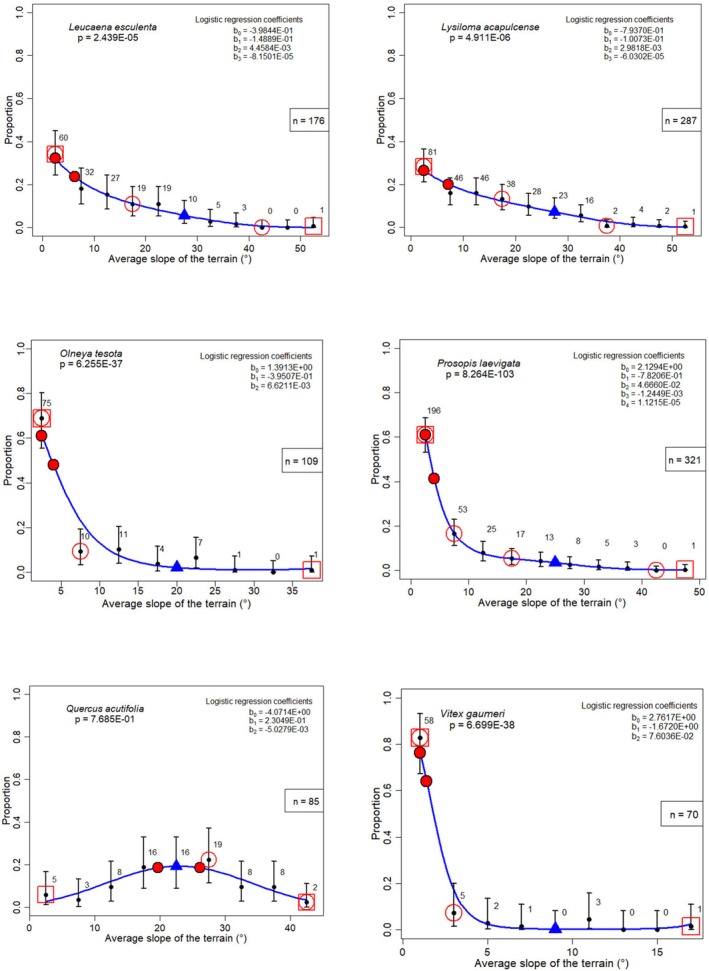 Figure 9
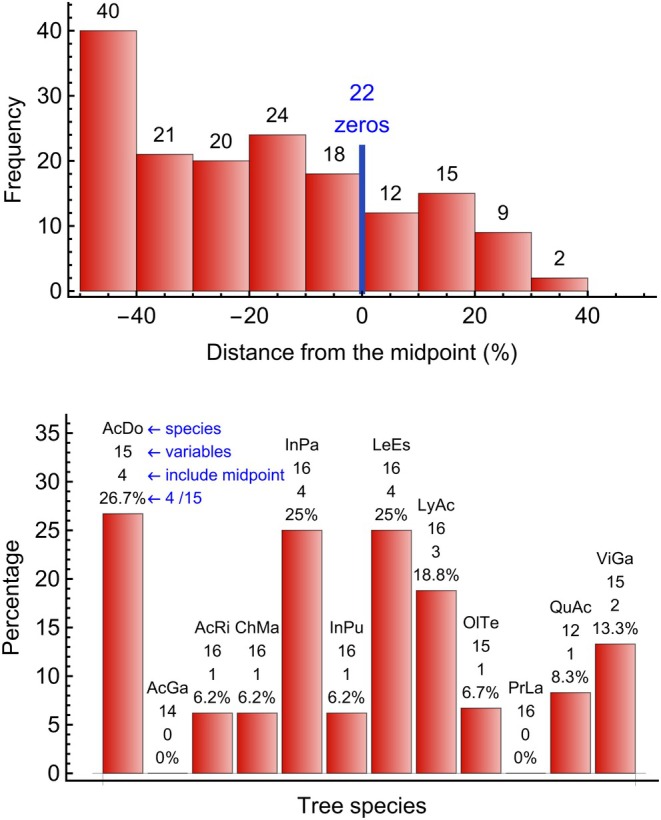 Figure 10
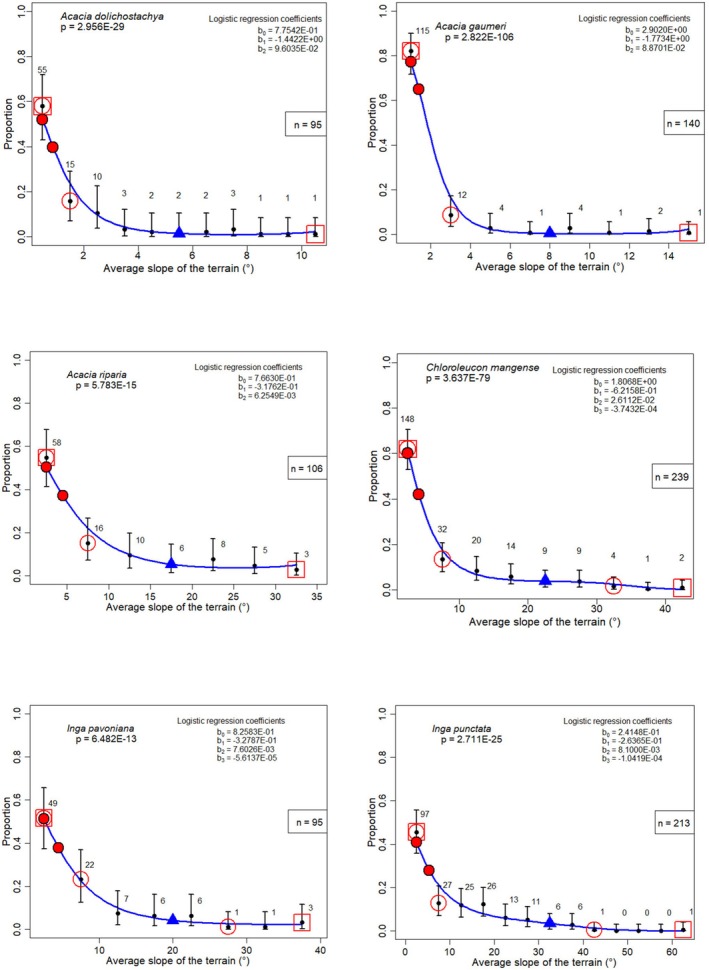 Figure 11
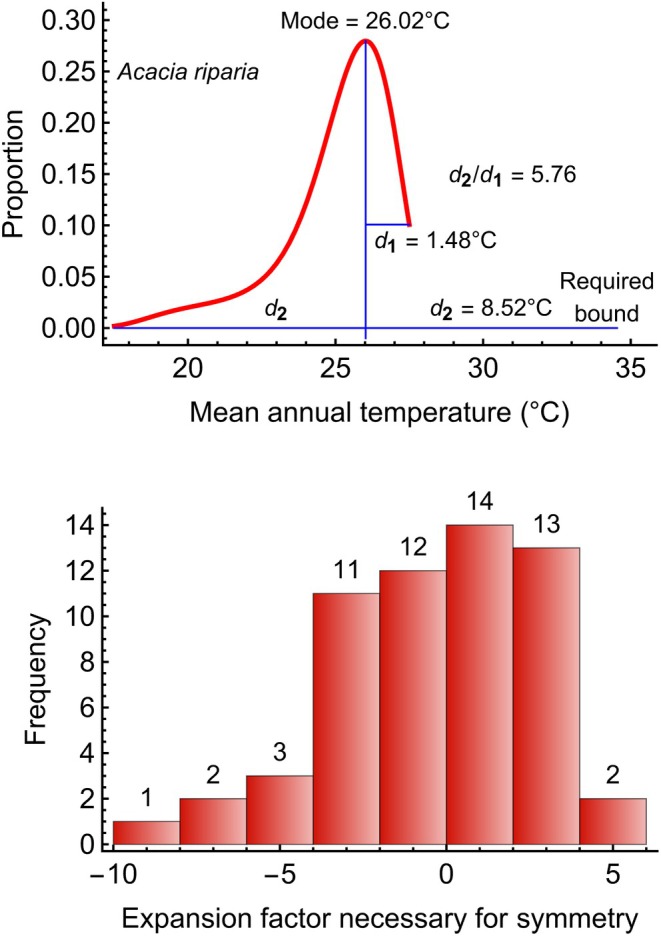 Figure 12
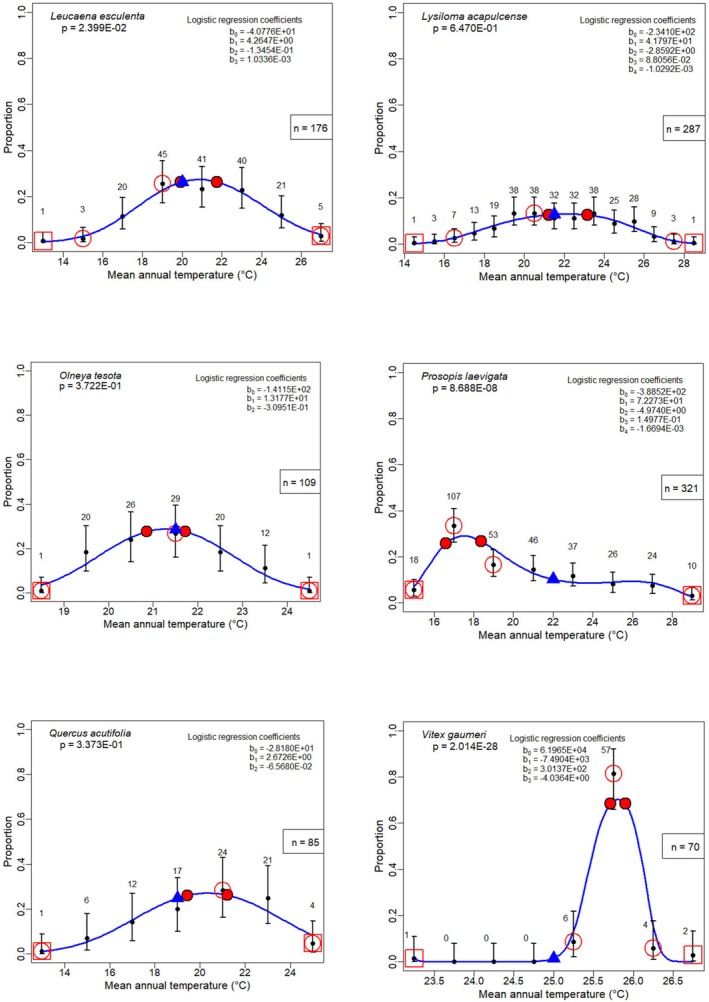 Figure 13
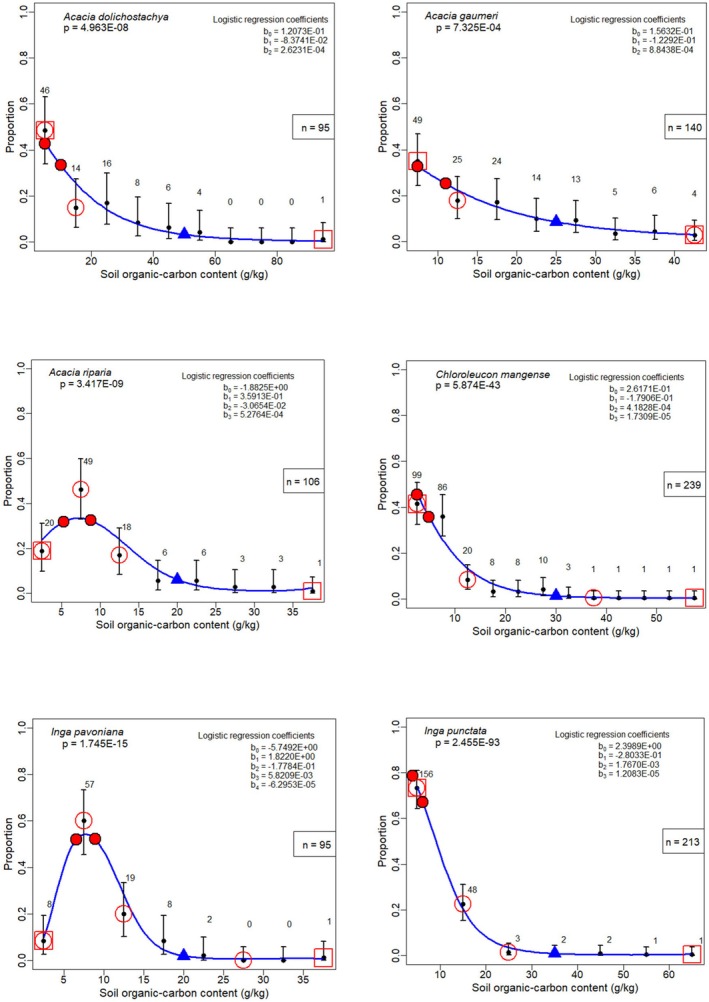 Figure 14
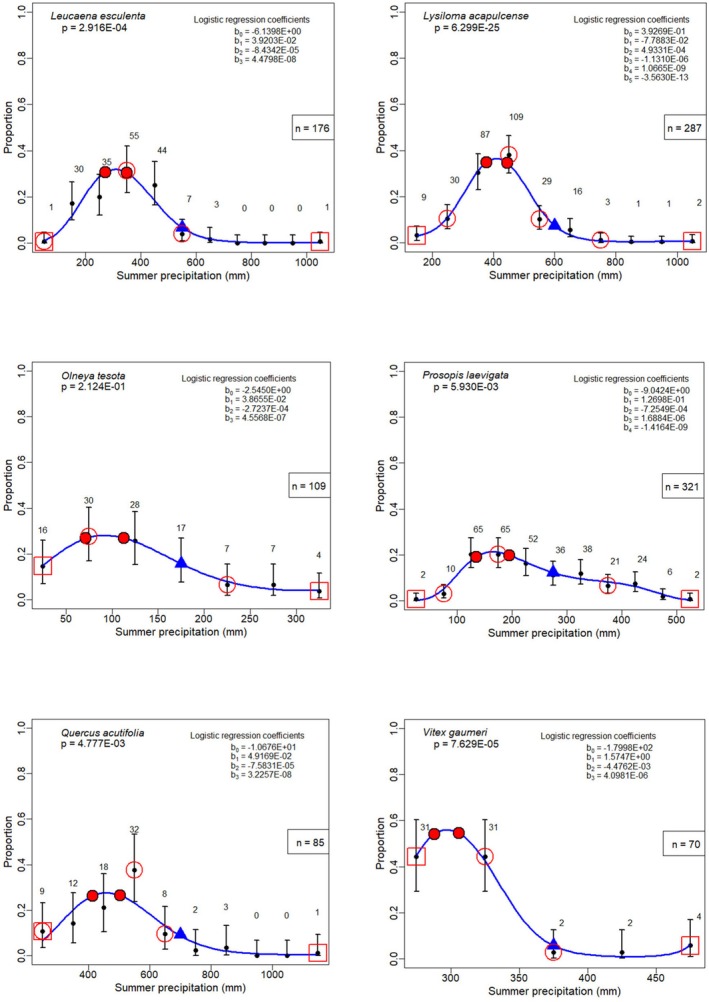 Figure 15
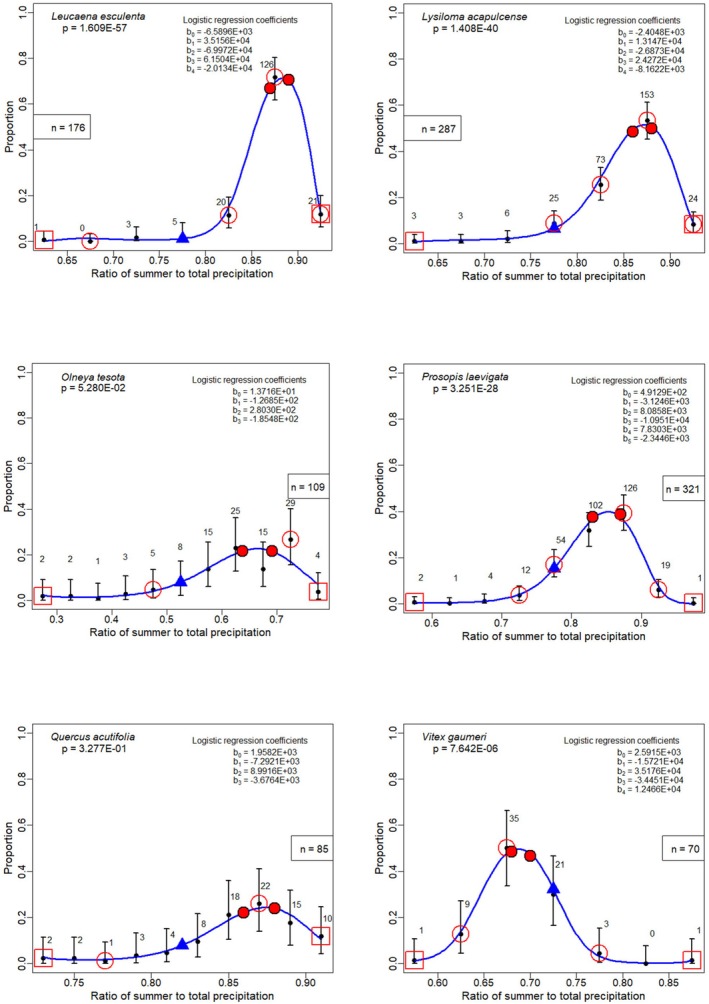 Figure 16
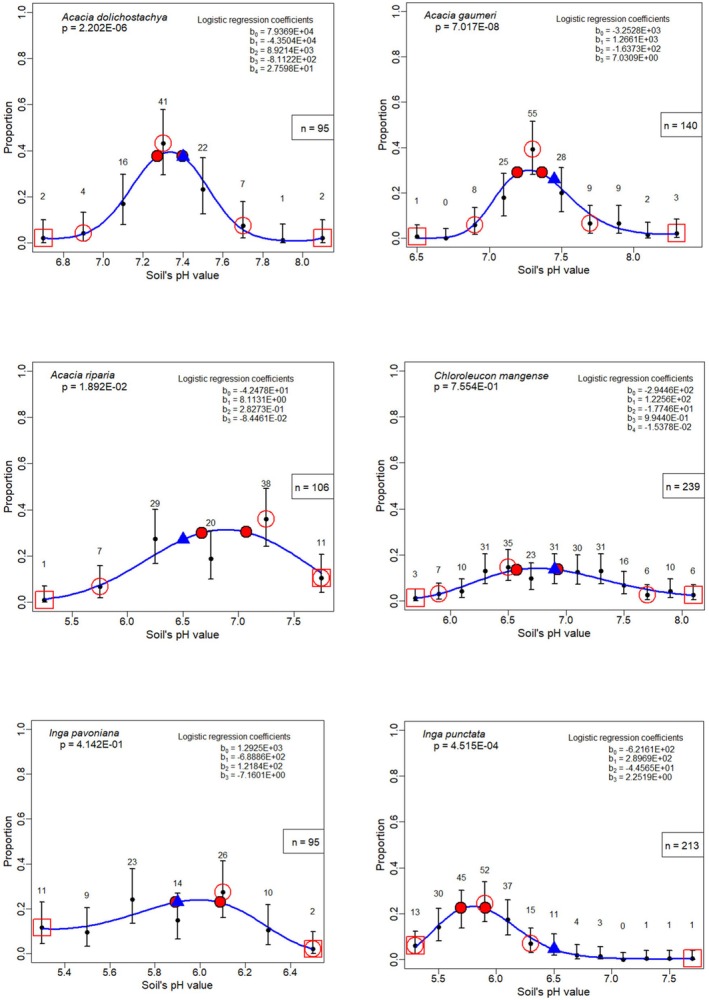 Figure 17
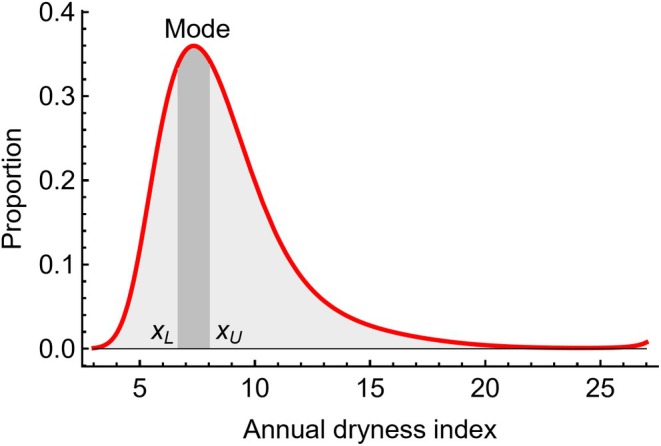 Figure 18
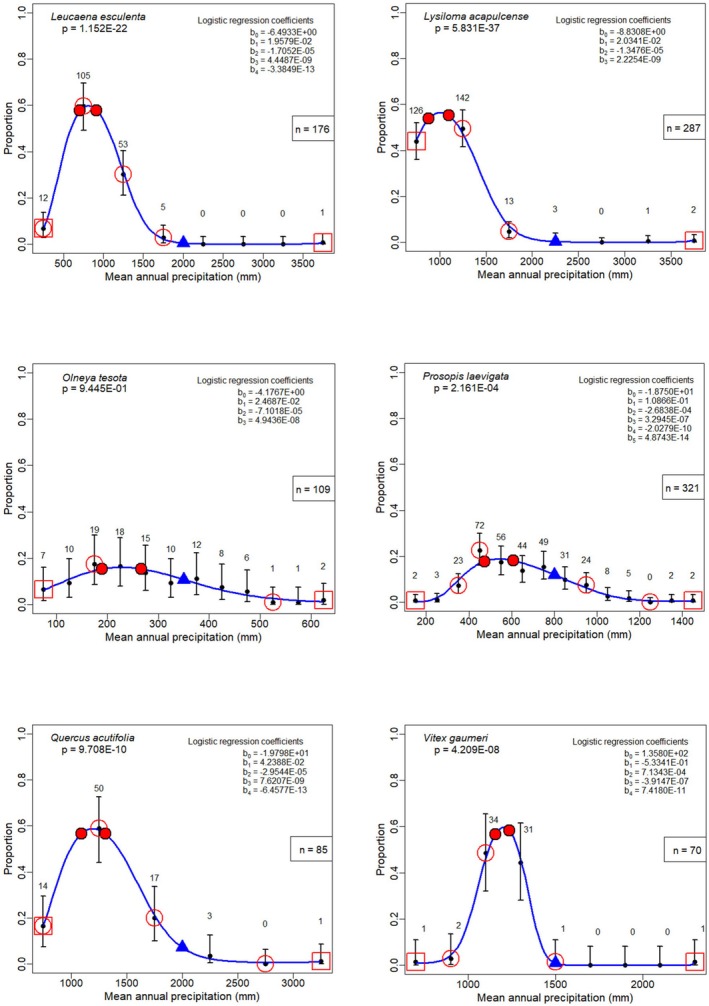 Figure 19
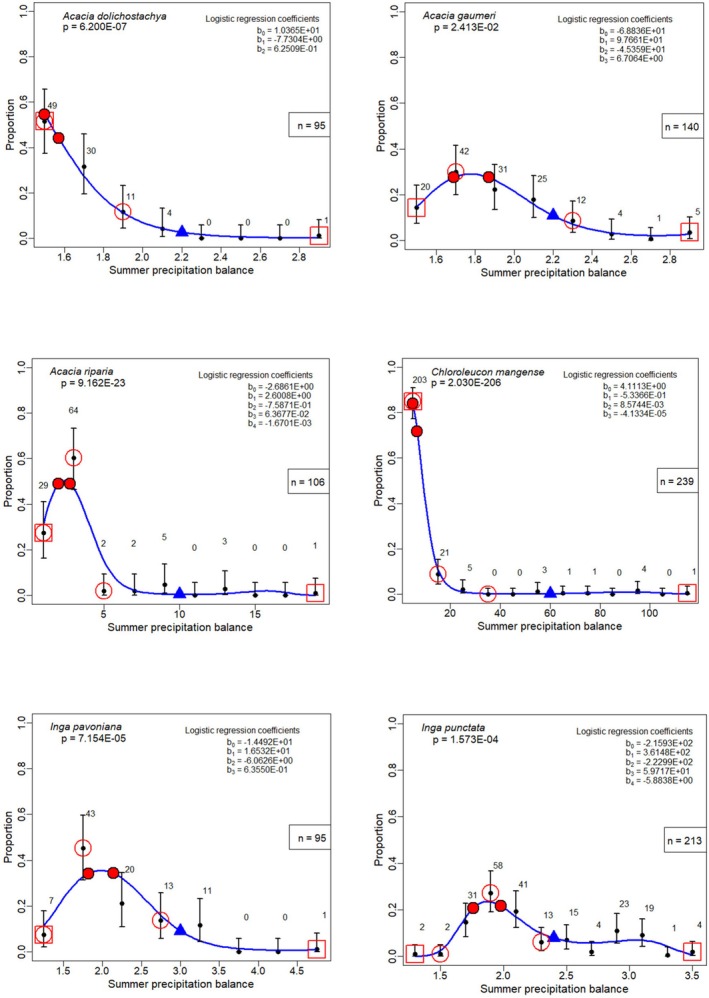 Figure 20
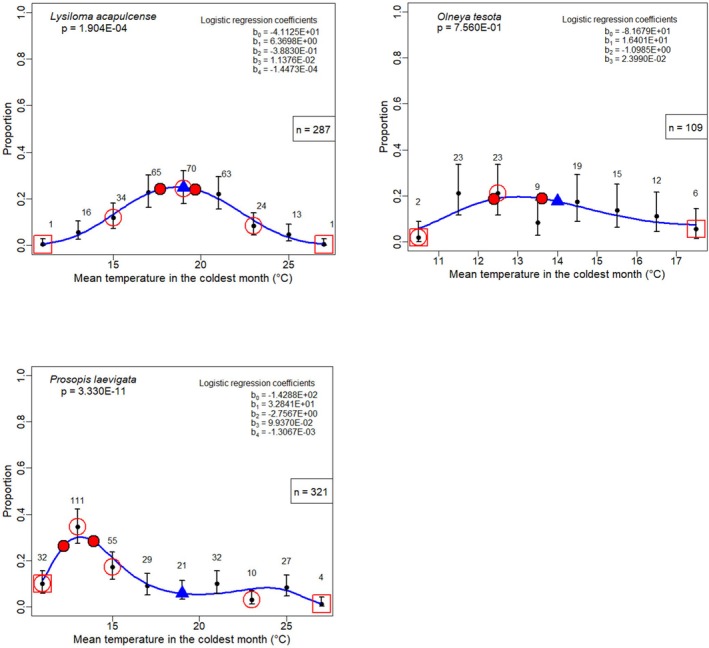 Figure 21
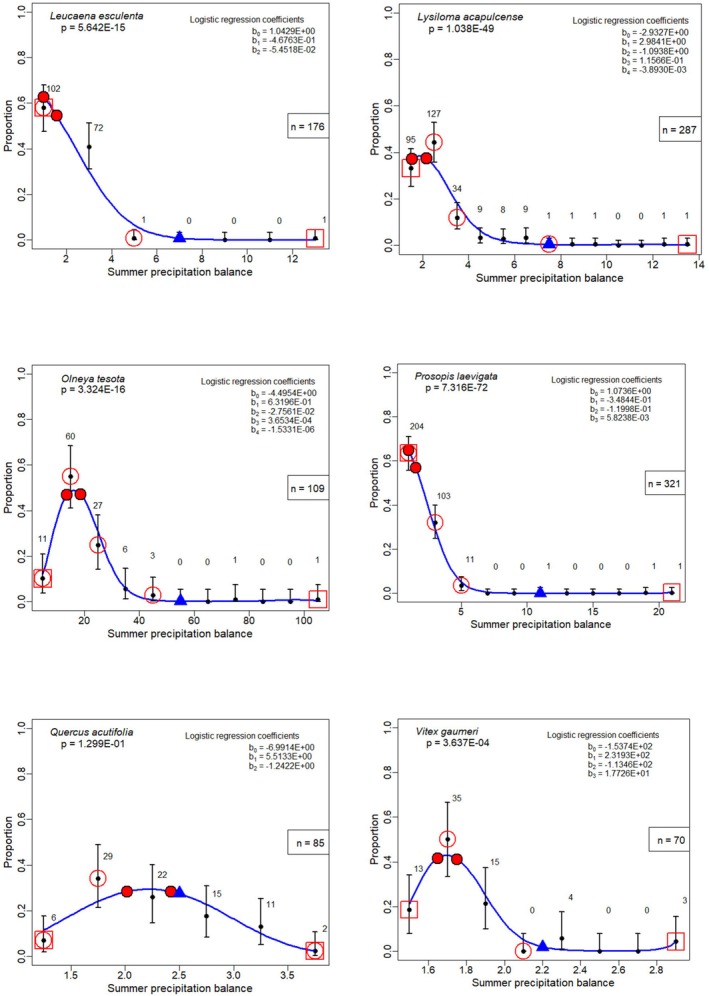 Figure 22
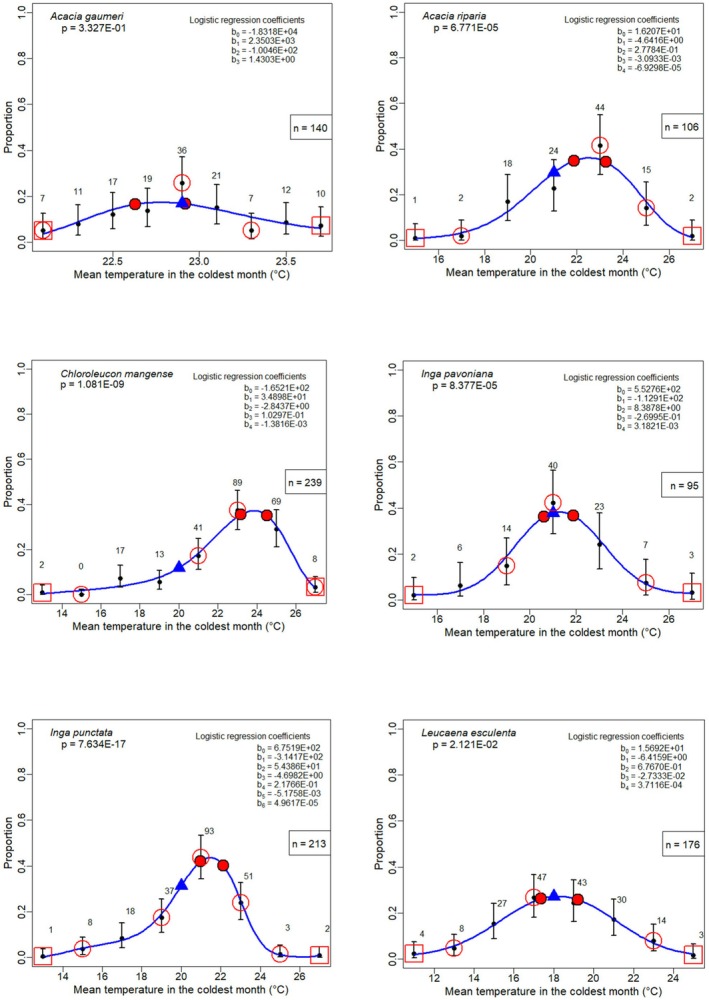 Figure 23
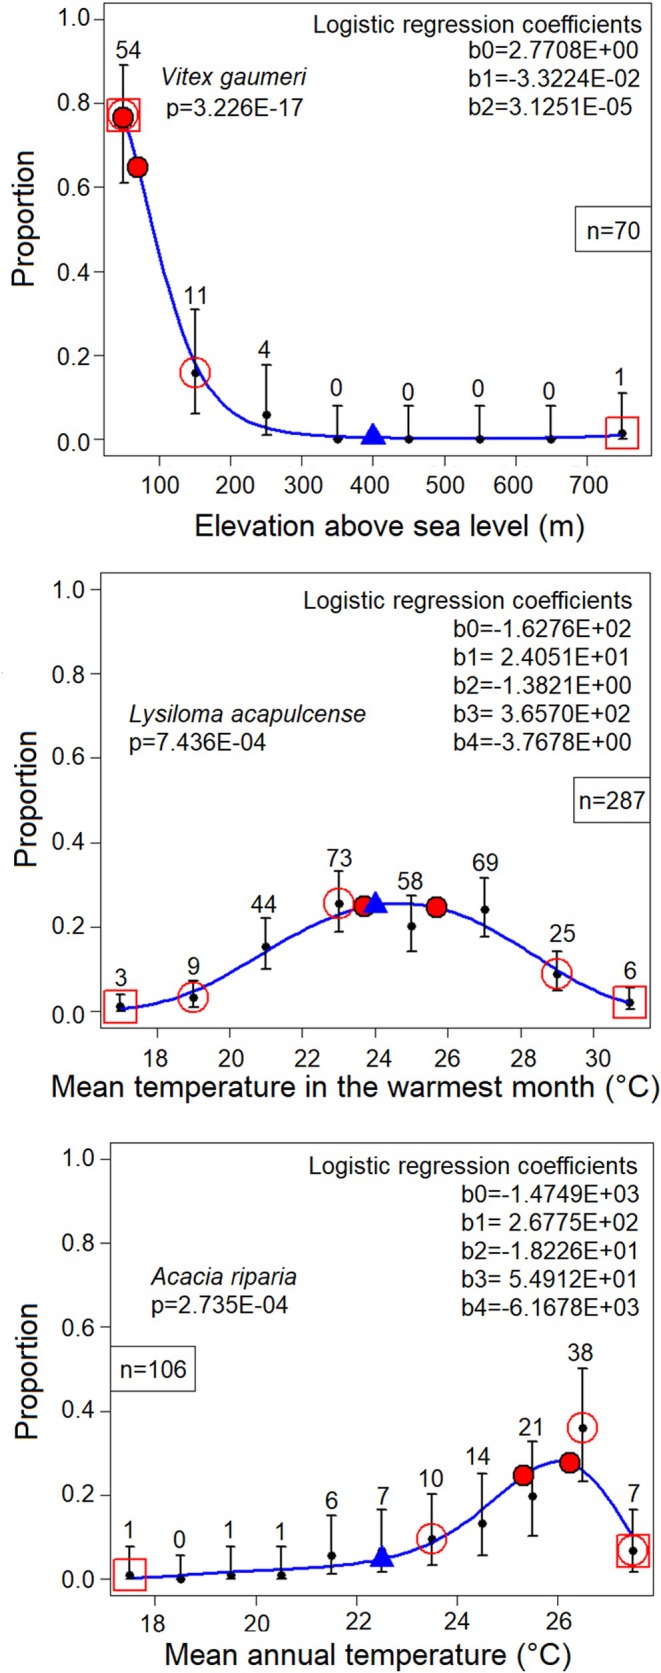 Figure 24
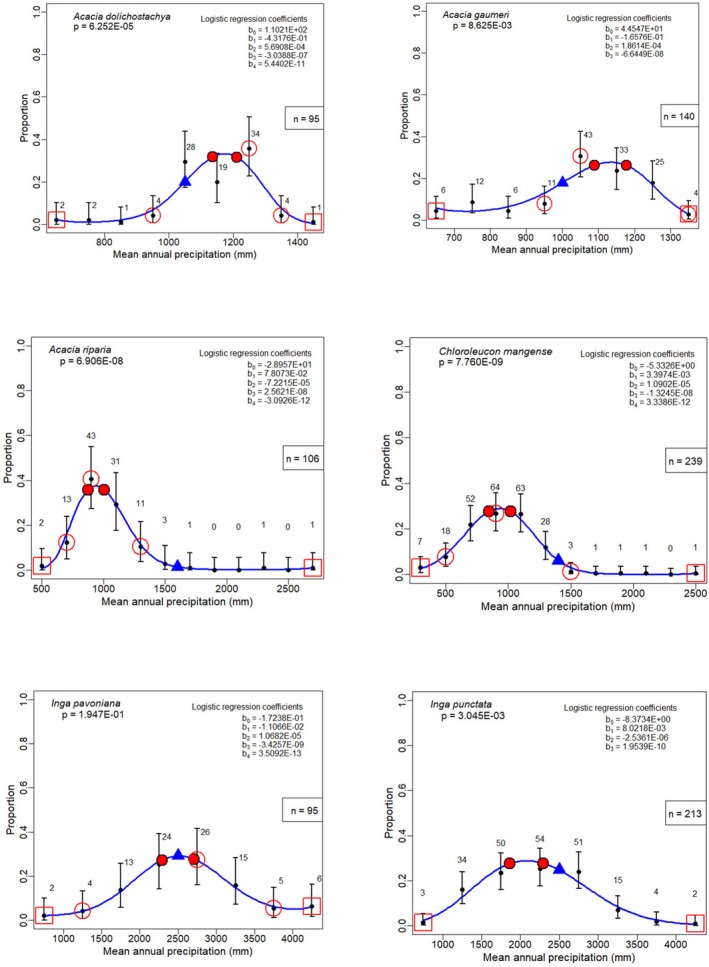 Figure 25
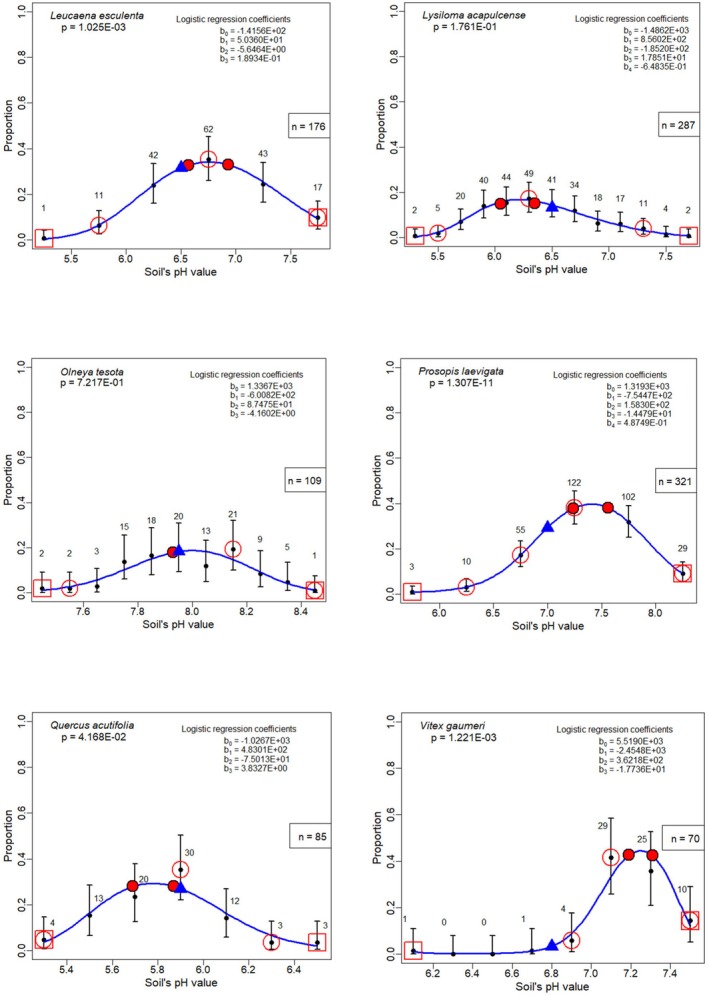 Figure 26
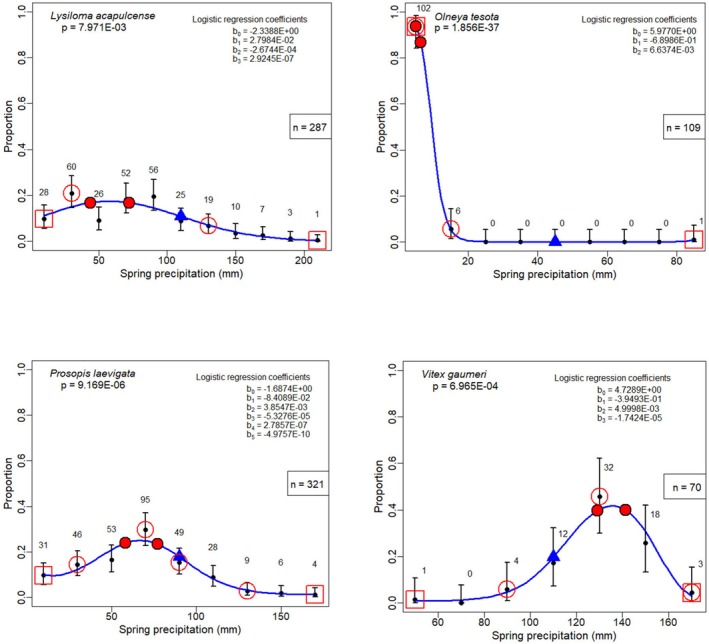 Figure 27
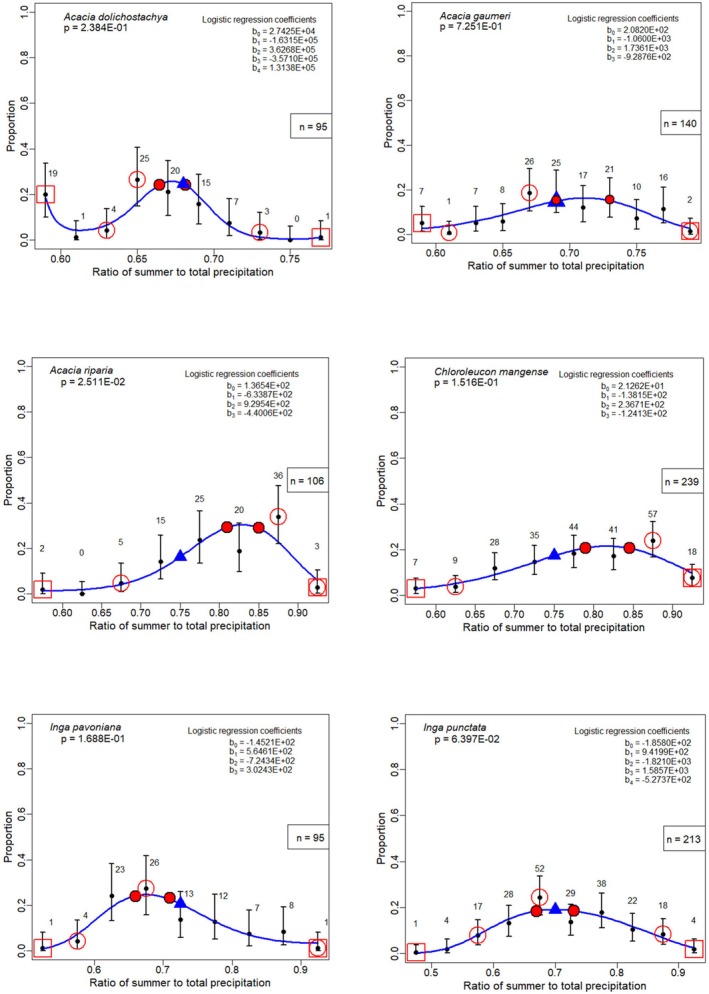 Figure 28
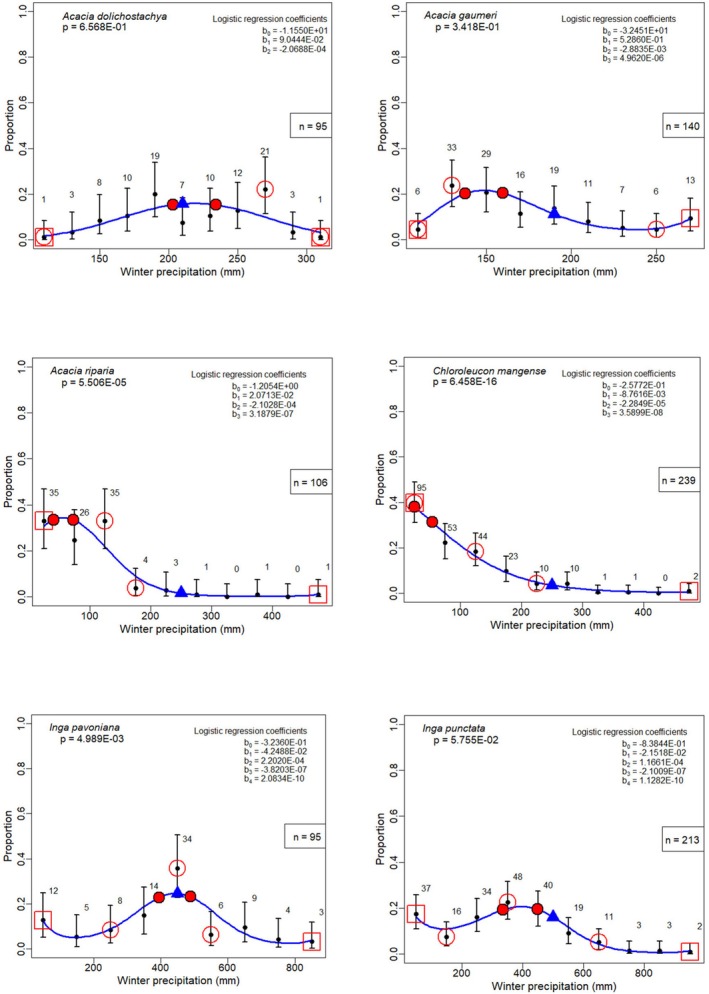 Figure 29
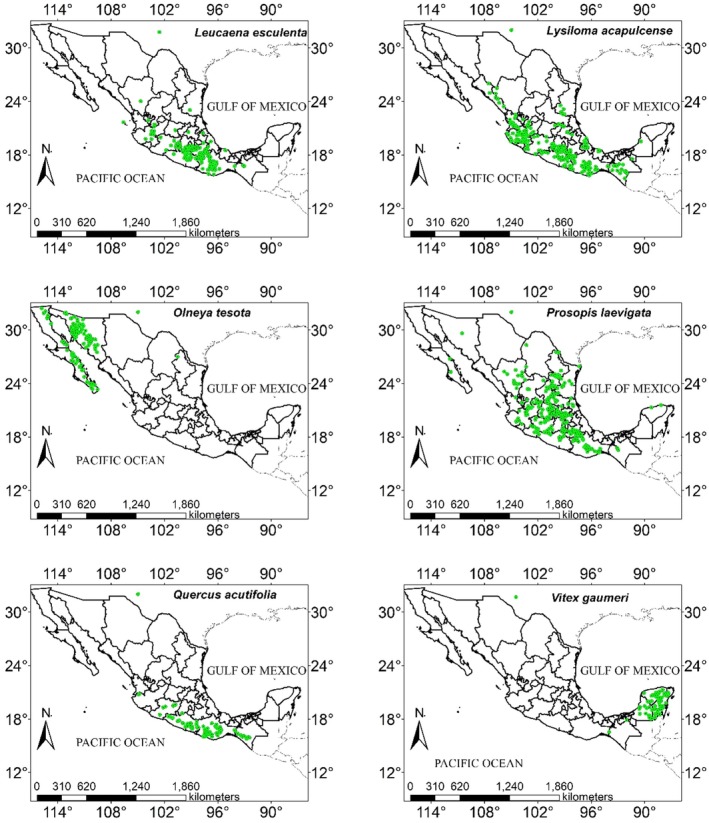 Figure 30
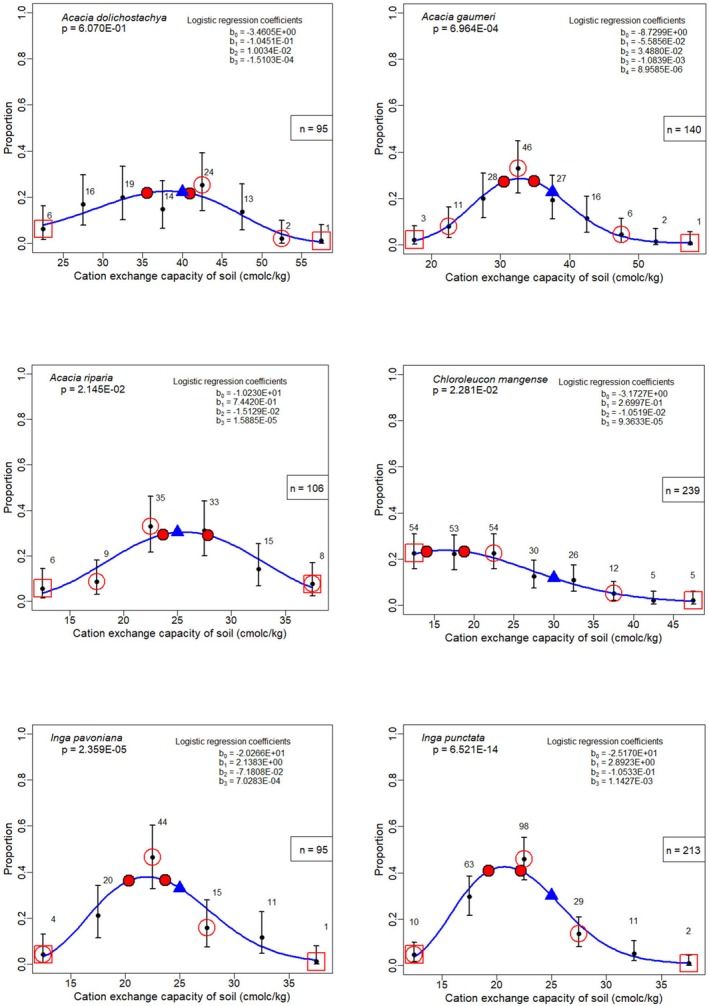 Figure 31
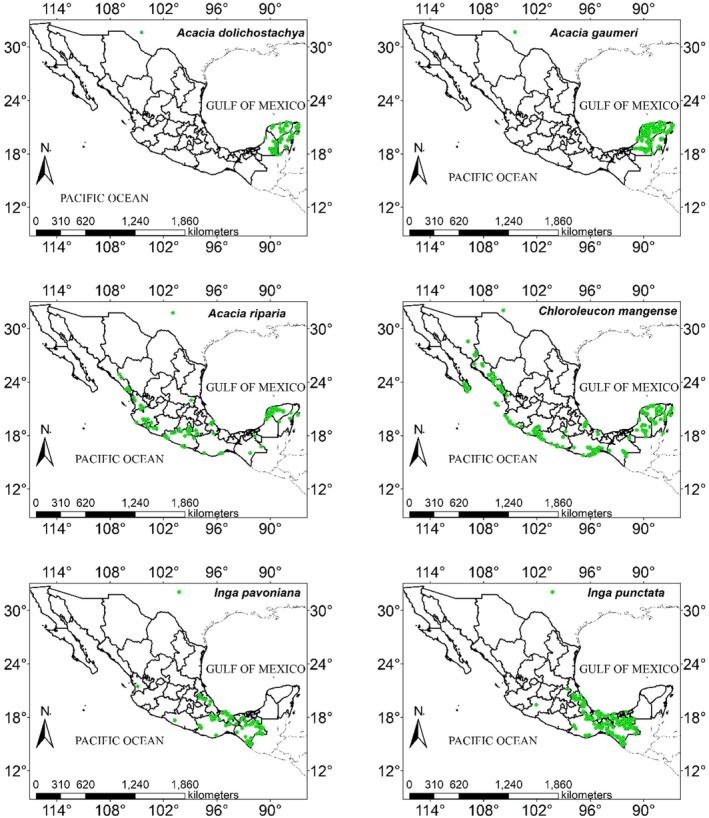 Figure 32
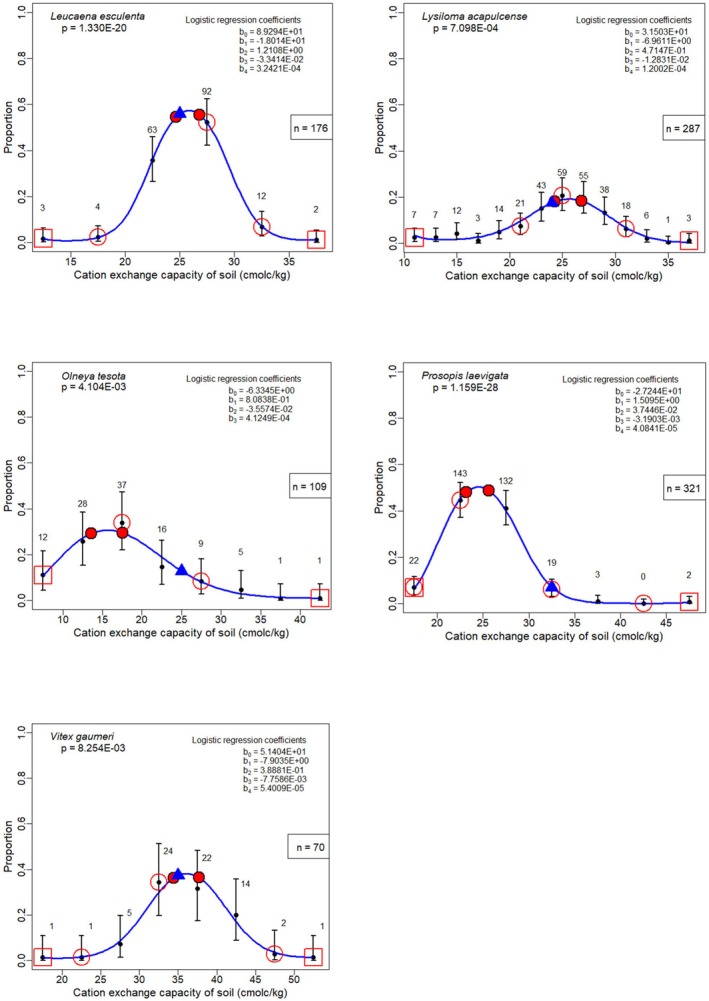 Figure 33
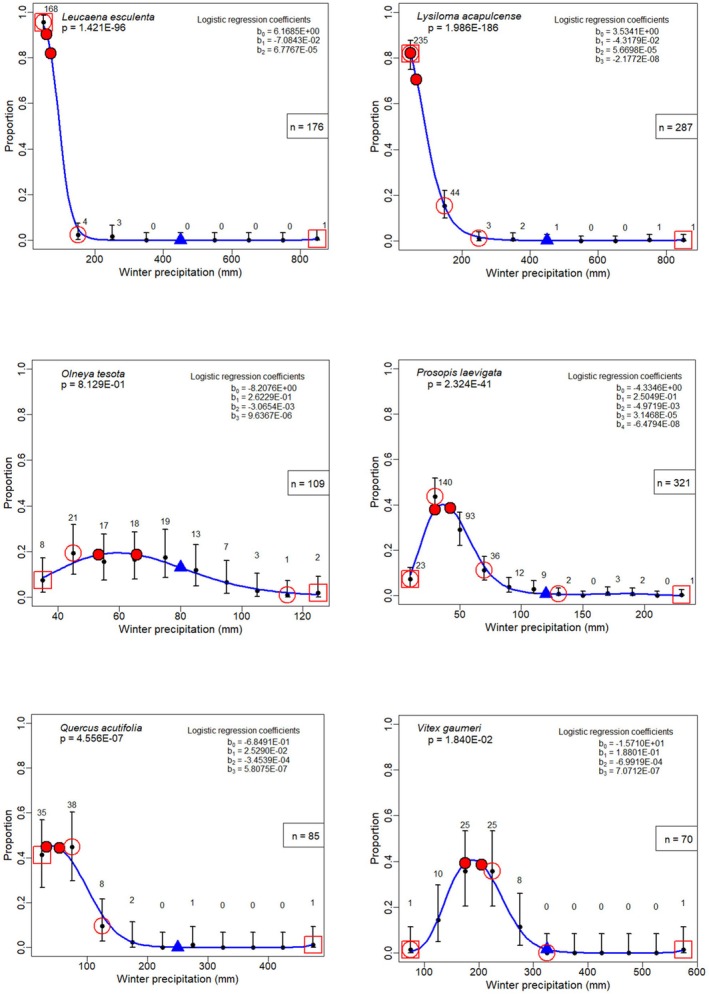 Figure 34
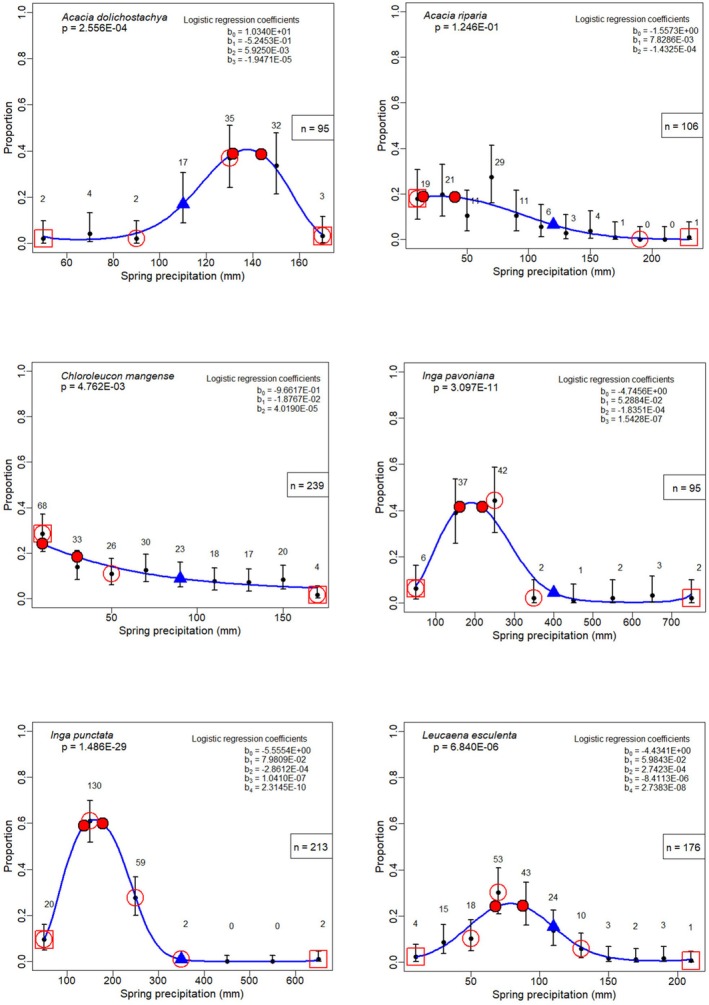 Figure 35
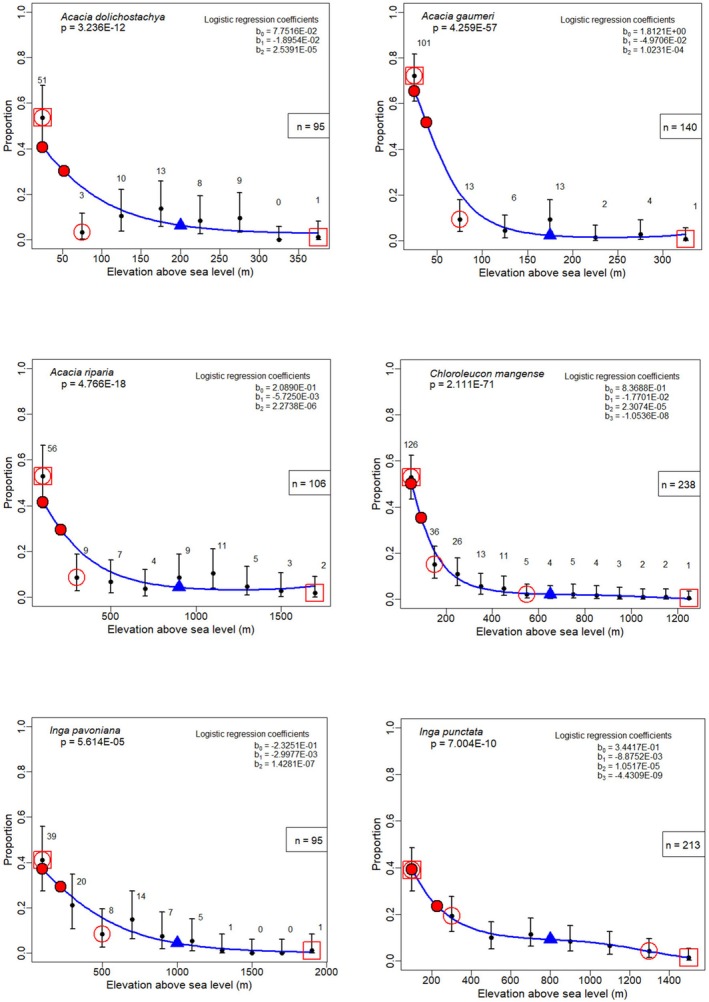 Figure 36
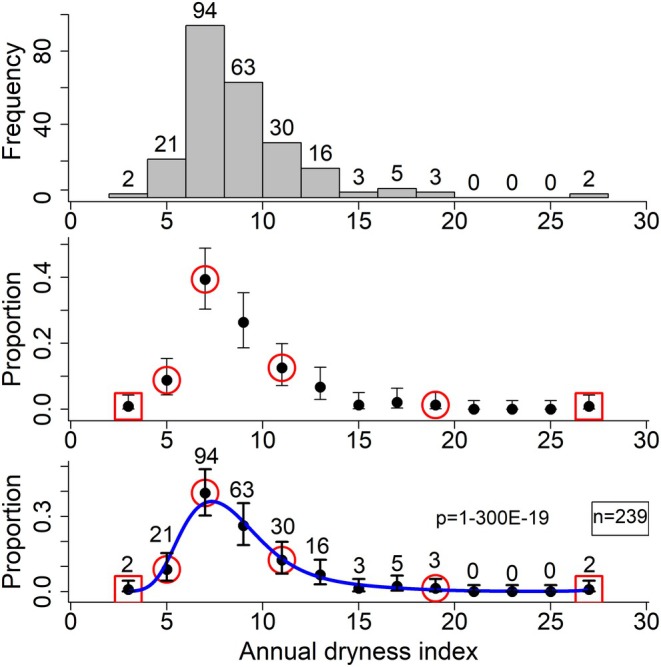 Figure 37
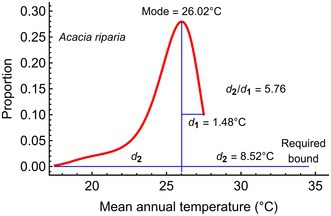 Figure 38
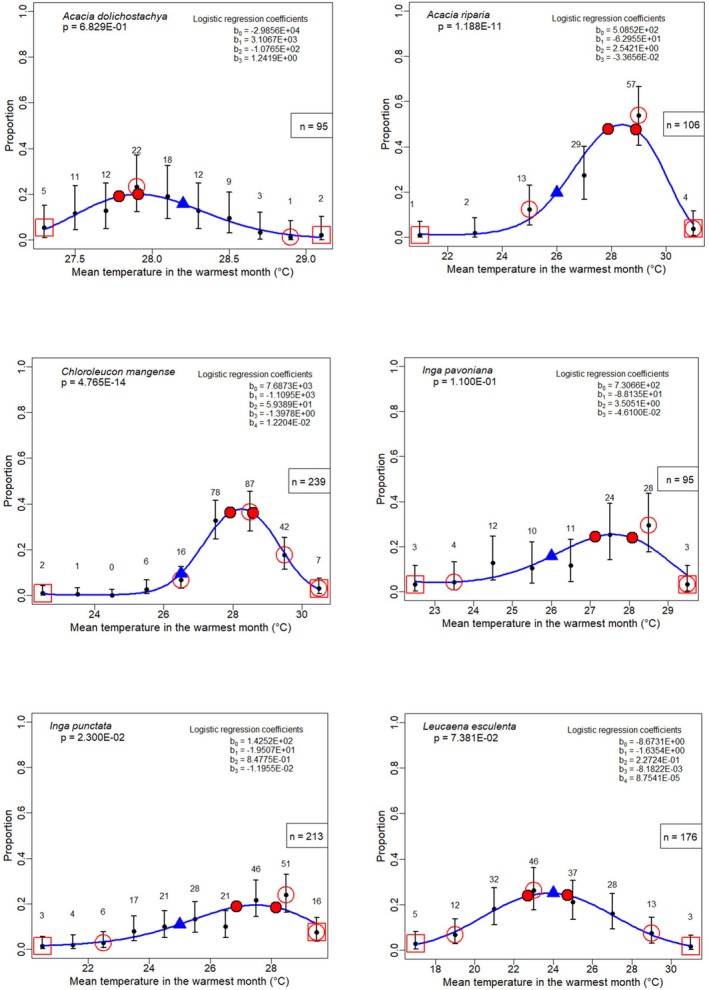 Figure 39
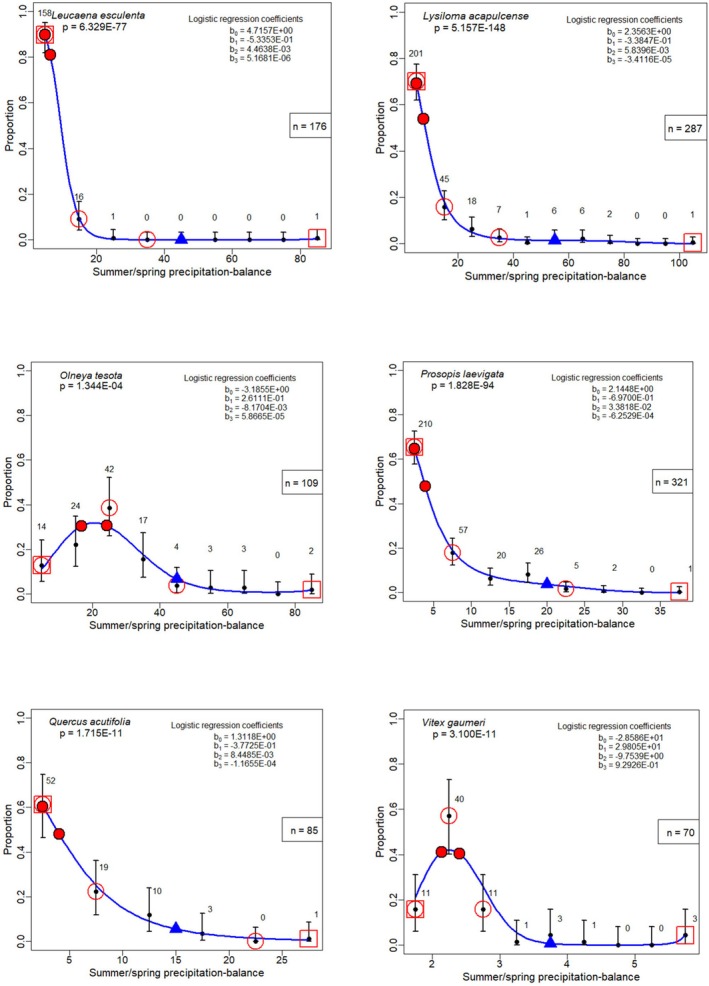 Figure 40
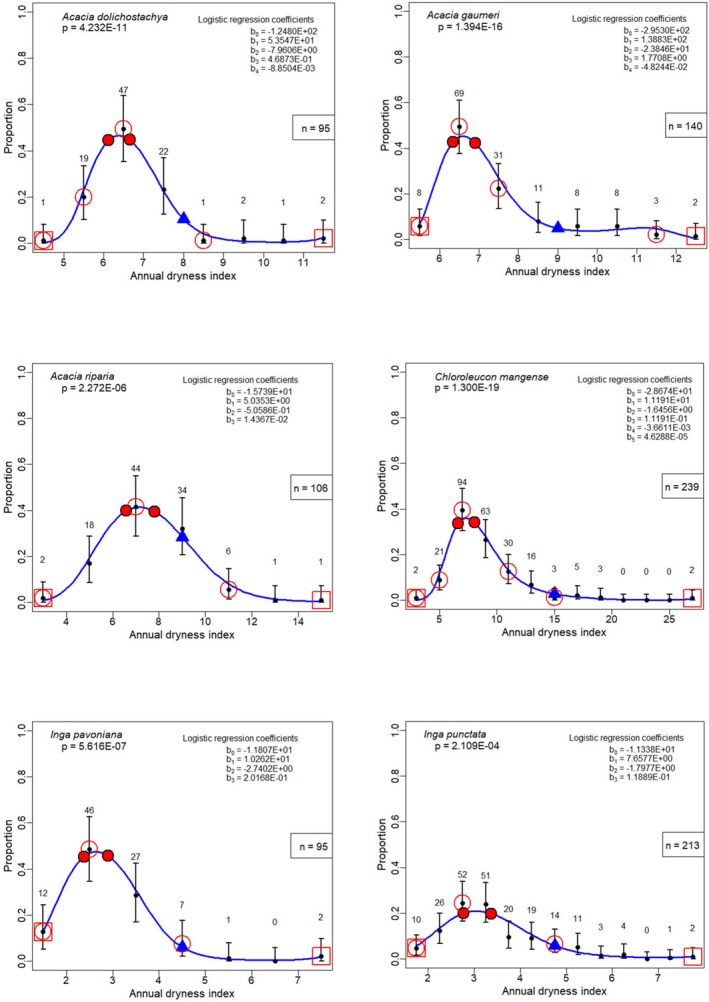 Figure 41
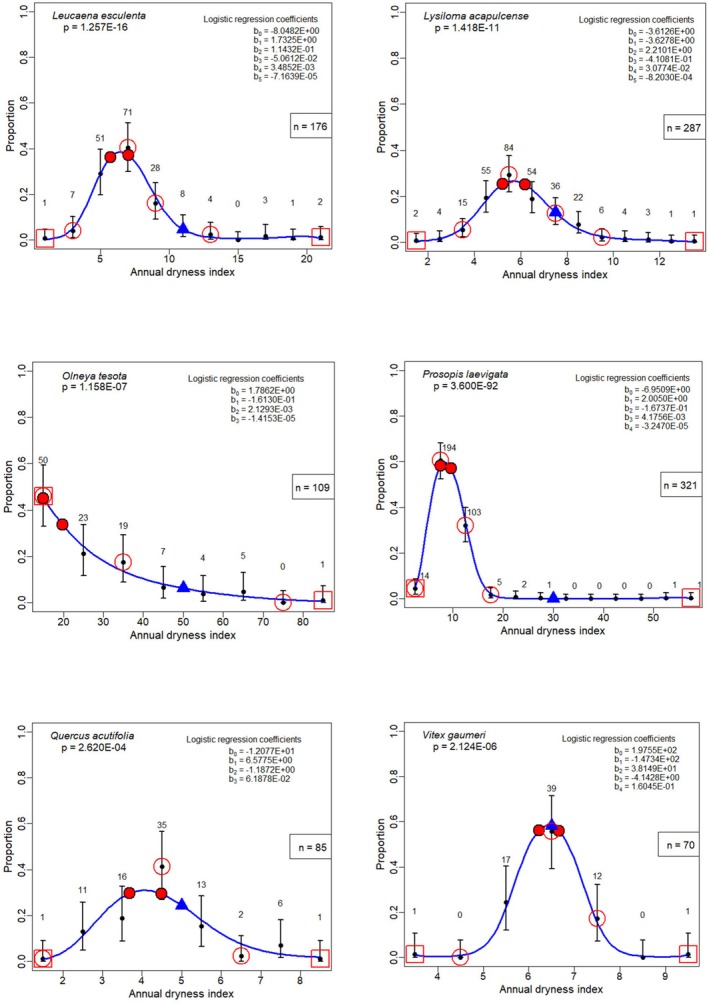 Figure 42
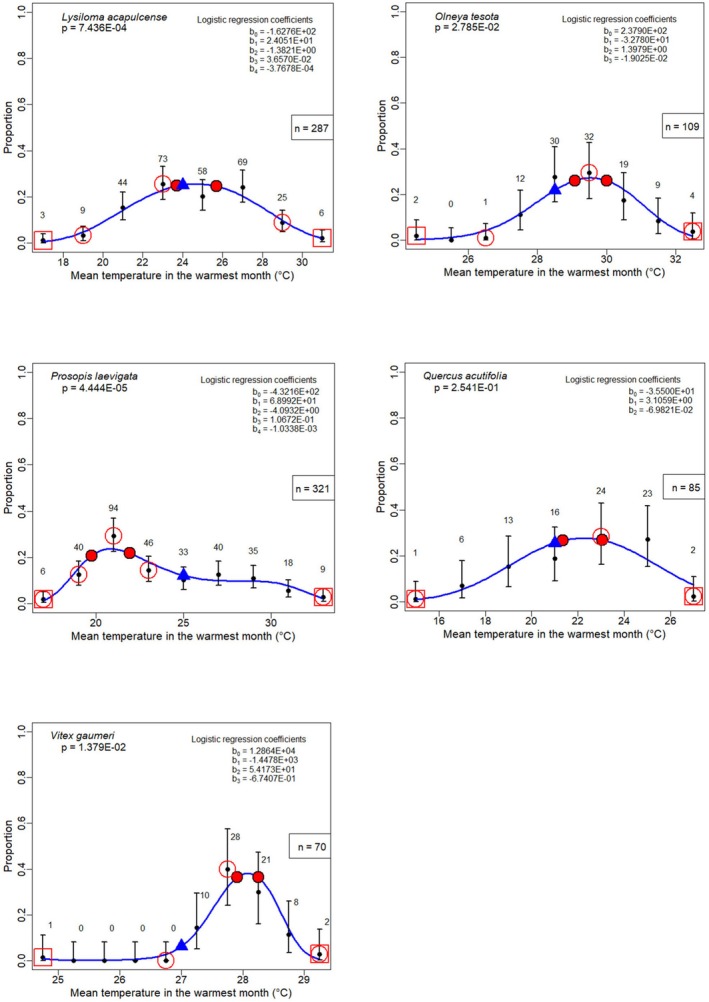 Figure 43
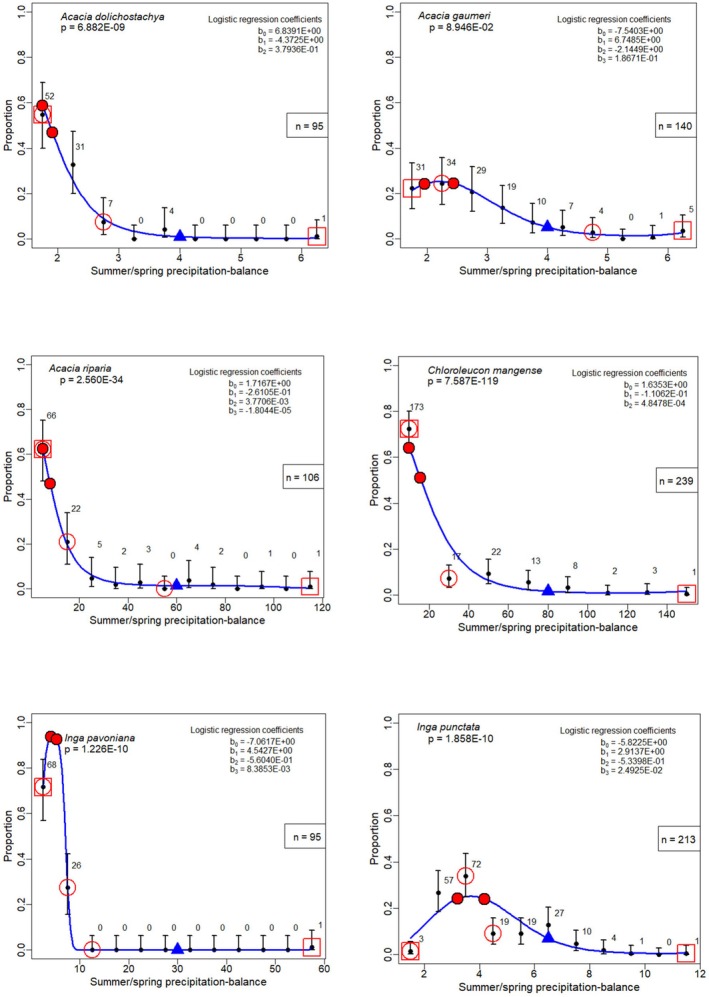 Figure 44
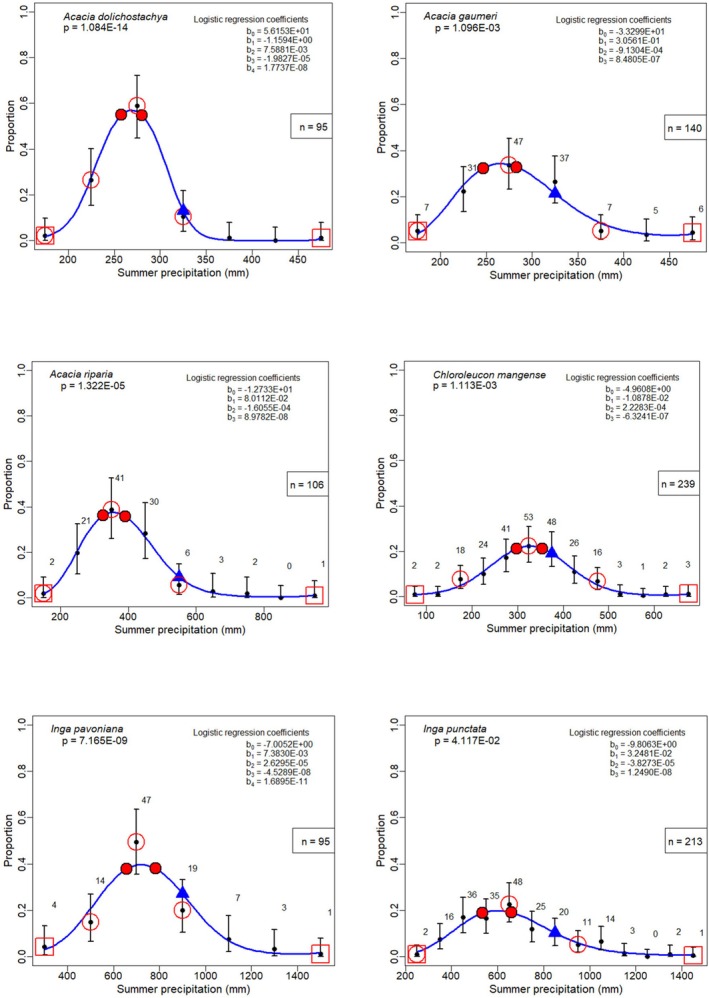 Figure 45
Peer Reviews
No public reviews on file for this paper yet. If you reviewed it on a platform where reviews are public (OpenReview, ICLR, NeurIPS, ICML), you can paste yours below so the community can read it here.
Videos
No videos yet. Explain this paper in a talk, walkthrough, or lecture? Add one.
Taxonomy
TopicsEcology and Vegetation Dynamics Studies · Species Distribution and Climate Change · Wildlife Ecology and Conservation