The Evolving Landscape of the Medicine-Pediatrics Workforce: Lessons From the Last 10 Years
Kristin Wong, Nabil Baker, Natalie Sous, Ravi Upadhyay, Nicole Reynoso-Vasquez, David Cennimo, Megna Khatri, Alan Tso, Luis Alzate-Duque, Jon Sicat, Brent Parris, Jayne Barr

TL;DR
This study explores the changing roles and career paths of Med-Peds physicians over the last decade, highlighting their contributions to primary care and the challenges they face.
Contribution
The study provides updated insights into the Med-Peds workforce's practice patterns and career trends over the past ten years.
Findings
Most Med-Peds physicians work as primary care providers and see patients of all ages.
There is a growing trend toward hospitalist roles and urban academic practice settings.
Financial concerns like educational debt and pay gaps are influencing career choices.
Abstract
Objective As a combined subspecialty, internal medicine-pediatrics (Med-Peds) physicians have played a significant role in both primary care and subspecialty care across the country. Over the last decade, the workforce has continued to grow and evolve. Thus, this study aims to characterize the current landscape of the Med-Peds workforce to address preconceptions and shine a light on current practice characteristics and career paths. Understanding factors influencing this group’s career path is vital in addressing the needs of an aging population and physician shortages. Methods The survey study was designed by the Committee on Pediatric Workforce of the American Academy of Pediatrics (AAP) and modified by the Section of Medicine-Pediatrics (SOMP) Executive Committee. The survey was distributed electronically via SurveyMonkey to 3,536 AAP Section members and 3,230 Med-Peds members of…
Genes, proteins, chemicals, diseases, species, mutations and cell lines named across the full text — each resolved to its canonical identifier and authoritative record.
Click any figure to enlarge with its caption.
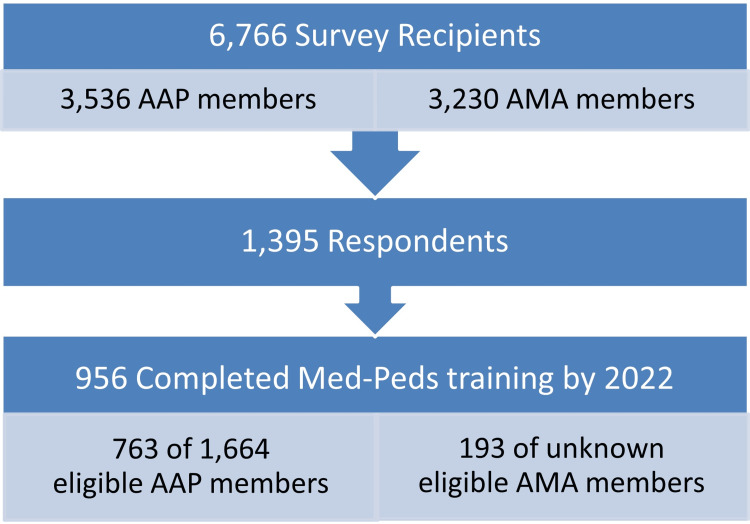 Figure 1
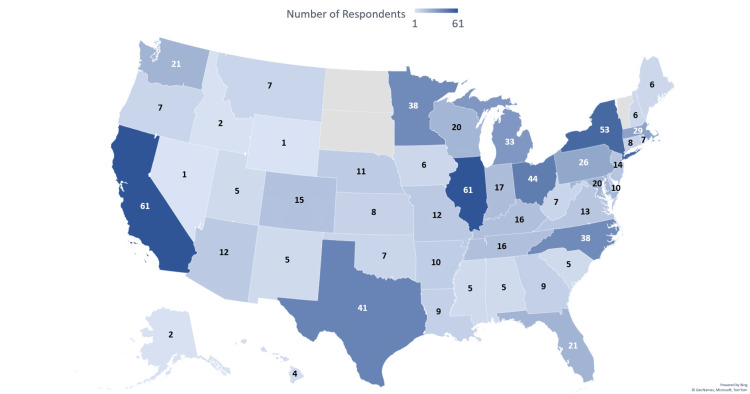 Figure 2
| Physician characteristics | n | % |
| Gender identity | ||
| Man | 311/802 | 38.80% |
| Woman | 478/802 | 59.60% |
| Non-binary | 3/802 | 0.40% |
| Self-described | 0/802 | 0.00% |
| Declined | 10/802 | 1.20% |
| Race | ||
| American Indian or Alaskan Native | 8/796 | 1.00% |
| Asian | 116/796 | 14.60% |
| Black/African American | 35/796 | 4.40% |
| Middle Eastern/North African | 7/796 | 0.90% |
| Native Hawaiian/Pacific Islander | 1/796 | 0.10% |
| White | 609/796 | 76.50% |
| Other | 8/796 | 1.00% |
| Declined to respond | 33/796 | 4.10% |
| Ethnicity | ||
| Hispanic or Latinx | 19/798 | 2.40% |
| Non-Hispanic White | 762/798 | 95.50% |
| Declined to respond | 17/798 | 2.10% |
| Sexual identity | ||
| Bisexual | 14/794 | 1.80% |
| Lesbian/gay | 28/794 | 3.50% |
| Straight | 716/794 | 90.20% |
| Other | 2/794 | 0.30% |
| I don't know | 2/794 | 0.30% |
| Declined to respond | 32/794 | 4.00% |
| Medical school location | ||
| United States | 778/802 | 97.00% |
| Canada | 0/802 | 0.00% |
| Caribbean | 8/802 | 1.00% |
| Other | 16/802 | 2.00% |
| Professional degree | ||
| MD | 885/942 | 93.90% |
| DO | 46/942 | 4.90% |
| Other | 11/942 | 1.20% |
| Current board certification | ||
| ABP only | 37/942 | 3.90% |
| ABIM only | 44/942 | 4.70% |
| Dual certification | 834/942 | 88.40% |
| Past certified | 20/942 | 2.10% |
| Never certified | 7/942 | 0.70% |
| Subspecialty/fellowship training | 206/938 | 22.00% |
| Organization membership | ||
| AAP | 705/730 | 96.60% |
| American College of Physicians | 580/730 | 79.50% |
| AAP's Section on Medicine-Pediatrics | 478/730 | 65.50% |
| Society for Hospital Medicine | 106/730 | 14.50% |
| Another organization or AAP section | 134/730 | 18.40% |
| Years since residency graduation | ||
| Mean | 15.4 years | |
| Range | 1 to 43 years | |
| Practice characteristics | n | % | Avg % FTEᵃ |
| Practice | |||
| PCP | 491/751 | 65.40% | |
| Hospitalist | 206/751 | 27.40% | |
| Subspecialist | 141/751 | 18.80% | |
| Practice setting | |||
| Medical school/hospital (or parent university) | 318/872 | 36.50% | |
| Family or Med-Peds group practice | 145/872 | 16.60% | |
| Multi-specialty group | 96/872 | 11.00% | |
| Community/staff model hospital | 83/872 | 9.50% | |
| Non-profit community health center or health department | 63/872 | 7.20% | |
| Solo practice | 25/872 | 2.90% | |
| Specialty group practice | 15/872 | 1.70% | |
| HMO staff/group model | 11/872 | 1.30% | |
| Pediatric group practice | 9/872 | 1.00% | |
| Uniformed Health Services clinic | 0/872 | 0.00% | |
| Other (please specify) | 107/872 | 12.30% | |
| Primary practice locale | |||
| Urban | 428/861 | 49.70% | |
| Suburban | 316/861 | 36.70% | |
| Rural | 117/861 | 13.60% | |
| Primary role | |||
| Employee | 696/786 | 88.50% | |
| Full or part-owner | 66/786 | 8.40% | |
| Independent contractor | 28/786 | 3.60% | |
| Other (please specify) | 9/786 | 1.10% | |
| Type of work | |||
| Direct patient care | 807/840 | 96.10% | 70.13% |
| Administration | 529/840 | 63.00% | 24.11% |
| Teaching | 528/840 | 62.90% | 13.53% |
| Clinical research | 116/840 | 13.80% | 14.24% |
| Basic science research | 8/840 | 1.00% | 24.37% |
| Health services research | 56/840 | 6.70% | 21.55% |
| Medical activities not involving the direct care of patients (e.g., committee work, consulting with agencies) | 292/840 | 34.80% | 10.14% |
| Other | 45/840 | 5.40% | 33.11% |
| Patient care work | |||
| Primary care pediatrics | 558/798 | 69.90% | 43.18% |
| Pediatric medical subspecialty | 200/798 | 25.10% | 58.22% |
| Pediatric surgical specialty | 3/798 | 0.40% | 35.00% |
| Another specialty, including adult | 648/798 | 81.20% | 67.84% |
| Patients cared for by age distribution | |||
| 2 years or younger | 612/712 | 86.00% | 16.90% |
| 3-17 years | 649/712 | 91.20% | 19.80% |
| 18-25 years | 677/712 | 95.10% | 12.90% |
| 26-40 years | 640/712 | 89.90% | 15.70% |
| 41-64 years | 631/712 | 88.60% | 22.10% |
| 65+ years | 621/712 | 87.20% | 24.70% |
| Academic details | n | % |
| Academic appointment | ||
| None | 322/872 | 36.90% |
| Non-tenured | 445/872 | 51.00% |
| Tenured | 74/872 | 8.50% |
| Other | 31/872 | 3.60% |
| Academic rank | 518/872 | 59.40% |
| Instructor | 55/518 | 10.60% |
| Assistant professor | 243/518 | 46.90% |
| Associate professor | 125/518 | 24.10% |
| Full professor | 45/518 | 8.70% |
| Adjunct | 33/518 | 6.40% |
| Other | 17/518 | 3.30% |
| Types of scholarship | ||
| None | 310/753 | 41.20% |
| QA/QI | 312/753 | 41.40% |
| Medical education research | 161/753 | 21.40% |
| Clinical research | 138/753 | 18.30% |
| Health service/population health research | 129/753 | 17.10% |
| Bench research | 7/753 | 0.90% |
| Other | 16/753 | 2.10% |
| Work with other providers | ||
| Hospitalists | 341/742 | 46.00% |
| Nurse practitioners | 547/742 | 73.70% |
| Physician assistants | 358/742 | 48.20% |
| Fellows | 185/742 | 24.90% |
| Residents | 451/742 | 60.80% |
| Medical students | 436/742 | 58.80% |
| Other students (e.g., nurse practitioner, physician assistant, nursing, undergraduate) | 210/742 | 28.30% |
| Compensation and salary details | n | % |
| Commonly received compensation packages | ||
| Malpractice insurance | 718/775 | 92.60% |
| Health insurance | 711/775 | 91.70% |
| Reimbursement for professional expenses such as licensure, dues, or meeting expenses | 662/775 | 85.40% |
| Retirement | 612/775 | 79.00% |
| Life insurance | 597/775 | 77.00% |
| Short-term disability | 528/775 | 68.10% |
| Long-term disability | 511/775 | 65.90% |
| Bonus | 462/775 | 59.60% |
| Paid family medical leave | 361/775 | 46.60% |
| Dependent care coverage | 285/775 | 36.80% |
| Paid family care leave | 258/775 | 33.30% |
| Tuition reimbursement | 126/775 | 16.30% |
| Loan repayment | 86/775 | 11.10% |
| Other | 33/775 | 4.30% |
| Compensation dependent on RVUs | 459/788 | 58.20% |
| Concerned about educational debt | ||
| Very concerned | 82/787 | 10.40% |
| Somewhat concerned | 118/787 | 15.00% |
| Not concerned | 161/787 | 20.50% |
| N/A - no debt | 426/787 | 54.10% |
| Effect on salary | ||
| Positive | 265/755 | 35.10% |
| Neutral | 358/755 | 47.40% |
| Negative | 132/755 | 17.50% |
| True statements | ||
| My salary would be higher if hired by medicine | 305/754 | 40.50% |
| My salary would be higher if hired by pediatrics | 10/751 | 1.30% |
| There is competition with local internists | 100/751 | 13.30% |
| There is competition with local pediatricians | 214/751 | 28.50% |
| I am responsible for covering my own practice costs | 75/751 | 10.00% |
| The group that I work for sees advantages to Med-Peds training over categorical training | 394/756 | 52.10% |
| I am completely grant-funded | 9/749 | 1.20% |
| Variables | <10 years† | >10 years‡ | Two-tailed z-scores | p-values | ||
| n | % | n | % | |||
| Demographics | ||||||
| ABP-only certified | 5/346 | 1.40% | 32/590 | 5.40% | -3.016 | 0.0025 |
| Dual medicine and pediatrics certified | 317/346 | 91.60% | 511/590 | 86.60% | 2.315 | 0.0203 |
| Identify as Asian | 60/288 | 20.80% | 56/504 | 11.10% | 3.723 | 0.0002 |
| Identify as White | 202/288 | 70.10% | 403/504 | 80.00% | -3.131 | 0.0017 |
| Members of AAP's Section on Medicine-Pediatrics | 195/254 | 76.80% | 282/473 | 59.60% | 4.642 | <0.00001 |
| Members of Society for Hospital Medicine | 63/254 | 24.80% | 43/473 | 9.10% | 5.7234 | <0.00001 |
| Members of American College of Physicians | 215/254 | 84.60% | 362/473 | 76.50% | 2.5773 | 0.00988 |
| Practice characteristics | ||||||
| Work as PCPs | 147/258 | 57.00% | 341/490 | 69.60% | -3.444 | 0.0006 |
| Work as hospitalists | 112/258 | 43.40% | 94/490 | 19.20% | 7.051 | <0.00001 |
| Dual-practicing PCPs and hospitalists | 26/258 | 10.10% | 28/490 | 5.70% | 2.192 | 0.0285 |
| Work in solo practices | 1/302 | 0.30% | 24/566 | 4.20% | -3.28 | 0.001 |
| Work in multi-specialty group practices | 20/302 | 6.60% | 76/566 | 13.40% | -3.045 | 0.0024 |
| Work at medical schools/hospitals | 142/302 | 47.00% | 174/566 | 30.70% | 4.747 | <0.00001 |
| Work in urban communities | 174/294 | 59.20% | 254/563 | 45.10% | 3.91 | 0.0001 |
| Work part-time | 28/294 | 9.50% | 110/565 | 19.50% | -3.766 | 0.0002 |
| Academics | ||||||
| Tenured academic appointment | 37/302 | 12.30% | 37/566 | 6.50% | 2.872 | 0.0041 |
| Instructor or assistant professor | 169/196 | 86.20% | 126/319 | 39.50% | 10.408 | <0.00001 |
| Associate or full professor | 13/196 | 6.60% | 157/319 | 49.20% | -9.978 | <0.00001 |
| Pursue scholarship in medical education research | 68/255 | 26.70% | 92/498 | 18.50% | 2.601 | 0.0093 |
| Pursue scholarship in QA/QI | 120/255 | 47.10% | 191/498 | 38.40% | 2.296 | 0.0214 |
| Work with other hospitalists | 146/260 | 56.20% | 194/480 | 40.40% | 4.101 | <0.00001 |
| Work with other trainees (fellows or residents) | 190/260 | 73.10% | 268/260 | 55.80% | 4.611 | <0.00001 |
| Work with medical students | 181/260 | 69.60% | 254/480 | 52.90% | 4.406 | <0.00001 |
| Compensation and salary perceptions | ||||||
| Employees | 248/265 | 93.60% | 446/521 | 85.60% | 3.29 | 0.001 |
| Full/part-owners | 7/265 | 2.60% | 59/521 | 11.30% | -4.149 | <0.00001 |
| Provided health insurance | 250/262 | 95.40% | 459/513 | 89.50% | 2.805 | 0.005 |
| Provided short-term disability | 195/262 | 74.40% | 332/513 | 64.70% | 2.741 | 0.0061 |
| Very concerned about educational debt | 64/265 | 24.20% | 17/519 | 3.30% | 9.084 | <0.00001 |
| No debt | 87/265 | 32.80% | 338/519 | 65.10% | -8.585 | <0.00001 |
| Believe their salary would be higher if hired by medicine | 136/256 | 53.10% | 168/495 | 33.90% | 5.077 | <0.00001 |
| Responsible for their own practice costs | 9/255 | 3.50% | 66/494 | 13.40% | -4.247 | <0.00001 |
| Work for groups that see advantages to Med-Peds over categorical training | 152/257 | 59.10% | 241/496 | 48.60% | 2.749 | 0.006 |
| Career attitudes and plans | ||||||
| Choose their current specialty if starting over | 215/263 | 81.70% | 372/521 | 71.40% | 3.154 | 0.0016 |
| Duty hour restrictions had a positive effect | 135/256 | 52.70% | 91/499 | 18.20% | 9.798 | <0.00001 |
| Administration/leadership as a primary career path | 20/250 | 8.00% | 94/477 | 19.70% | -4.123 | <0.00001 |
| Clinician educator as a primary career path | 45/250 | 18.00% | 60/477 | 12.50% | 1.975 | 0.0477 |
| Clinician educator as a secondary career path | 78/198 | 39.40% | 86/312 | 27.60% | 2.788 | 0.0053 |
| Feel that hours are too long if reducing clinical time | 25/74 | 33.80% | 33/179 | 18.40% | 2.642 | 0.0083 |
| Career attitudes and plans | n | % |
| Satisfaction with training preparation | ||
| Satisfied | 740/761 | 97.20% |
| Neutral | 10/761 | 1.30% |
| Unsatisfied | 11/761 | 1.40% |
| Effect of duty hour restrictions on training | ||
| Didn't train under | 278/758 | 36.70% |
| Positive | 226/758 | 29.80% |
| Neutral | 222/758 | 29.30% |
| Negative | 31/758 | 4.10% |
| Likely to choose Med-Peds again | ||
| Likely | 679/755 | 89.90% |
| Neutral | 25/755 | 3.30% |
| Unlikely | 51/755 | 6.80% |
| Agreement statements | ||
| I am satisfied with my career as a physician | 633/787 | 80.40% |
| If starting over, I would choose my current specialty | 590/787 | 75.00% |
| Primary career path | ||
| Staff clinician | 460/730 | 63.00% |
| Administration/leadership | 115/730 | 15.80% |
| Clinician educator | 105/730 | 14.40% |
| Physician scientist | 30/730 | 4.10% |
| Clinical expert | 20/730 | 2.70% |
| Secondary career path | ||
| Administration/leadership | 195/512 | 38.10% |
| Clinician educator | 165/512 | 32.20% |
| Staff clinician | 82/512 | 16.00% |
| Clinical expert | 52/512 | 10.20% |
| Physician scientist | 18/512 | 3.50% |
| Five-year plan | ||
| Reduce Med-Peds workload | 186/743 | 25.00% |
| Move into a nonclinical role in medicine | 91/743 | 12.20% |
| Retire from Med-Peds | 69/743 | 9.30% |
| Pursue a career outside of medicine | 34/743 | 4.60% |
| Pursue another specialty | 16/743 | 2.20% |
| Primary reason for reducing clinical practice | ||
| The hours are too long | 58/254 | 22.80% |
| The practice is too stressful | 34/254 | 13.40% |
| I am moving into a non-clinical position | 46/254 | 18.10% |
| I like Med-Peds, but I have better opportunities outside the field | 12/254 | 4.70% |
| I plan to retire | 63/254 | 24.80% |
| I expect to lose my job due to downsizing or other market factors | 0/254 | 0.00% |
| I dislike Med-Peds and hope for a better job offer outside the field | 0/254 | 0.00% |
| Other (please specify) | 41/254 | 16.10% |
Peer Reviews
No public reviews on file for this paper yet. If you reviewed it on a platform where reviews are public (OpenReview, ICLR, NeurIPS, ICML), you can paste yours below so the community can read it here.
Videos
No videos yet. Explain this paper in a talk, walkthrough, or lecture? Add one.
Taxonomy
TopicsChild and Adolescent Health · Healthcare Policy and Management · Diversity and Career in Medicine
Introduction
As a combined subspecialty, internal medicine-pediatrics (Med-Peds) physicians continue to play a significant role in both primary care and subspecialty care across the country. Approved by the American Board of Internal Medicine (ABIM) and American Board of Pediatrics (ABP) in 1967, combined Med-Peds residencies have grown to over 77 training programs and have over 1,500 active residents [1], with almost 400 graduates each year. In 2013, the American Academy of Pediatrics (AAP) research team and leadership from the Section of Medicine-Pediatrics (SOMP) developed the first comprehensive national survey of the Med-Peds workforce [2]. The survey revealed that Med-Peds physicians maintain both boards and practice medicine across the age range. As such, Med-Peds graduates continue to add to primary care, hospital medicine, and subspecialty care workforces, along the continuum of practice settings across the country.
Due to an aging population as well as current and projected workforce shortages, concerns about the ability of the healthcare workforce to meet the demand, particularly in primary care, have been emphasized. The American Academy of Medical Colleges (AAMC) projected a shortage of 20,200-40,400 primary care providers in the United States (US) and 3,800-13,400 medical subspecialists by 2036 [3]. Additionally, between 2008 and 2017, 10.4% of adult primary care physicians exited practice [4], and AAMC has speculated that more than a third of currently active physicians could retire in the next decade based on a traditional retirement age of 65 or older [3]. Further exacerbating these projections, 4.7% of internal medicine residency positions and 8% of pediatric residency positions remained unfilled in the 2024 National Residency Match [5]. Med-Peds resident positions accounted for 3.6% of medicine (390 of 10,681) and 12.4% of pediatric positions (390 of 3,139) and were completely filled [5]. In 2021, there were 5,701 active Med-Peds physicians with activities ranging from patient care, teaching, research, and administration [6]. In light of these mounting demands, it is important to understand trends within the Med-Peds workforce and recognize their flexibility in the scope of practice inherent to combined training and role in both primary and subspecialty care. Healthcare systems that recognize the strengths of this workforce can create flexible staffing models to care for an evolving spectrum of patients. This study aims to review the practices, perceptions, and careers of the current Med-Peds workforce.
Materials and methods
Study design
The Survey Initiative, organized by the Committee on Pediatric Workforce of the AAP, develops periodic surveys distributed to physician members as a means of reviewing and analyzing its workforce. This questionnaire was modified by the SOMP’s Executive Committee and approved by the AAP’s research team. The final survey consisted of 105 questions covering a core set of variables and specialty-specific questions including demographics, practice characteristics, practice-specific questions, and career planning and satisfaction. Within the survey tool, display and skip logic were used to direct respondents to applicable question sets. Single-answer, multiple-answer, constant sum, and free-text questions were used. The survey was approved and the study was deemed exempt by the AAP Institutional Review Board.
Inclusion and exclusion criteria
A total of 3,536 Med-Peds physicians were identified from the AAP’s member listserv. Med-Peds physicians from the American Medical Association’s (AMA) Medical Marketing Service (MMS) listserv were also identified and compared with the AAP’s list. Duplicates were removed and an additional 3,230 AMA members were added to the list for a total of 6,766 recipients. Only survey responses indicating “Yes” to having completed Med-Peds residency training by 2022 or earlier were included in this study (Figure 1).
Participant flow diagramAAP: American Academy of Pediatrics; AMA: American Medical Association; Med-Peds: Internal medicine-pediatrics
Data collection
The survey was distributed through email with an electronic link via SurveyMonkey, an online survey platform. Recipients received quarterly reminders from December 3, 2022, to June 19, 2023. Specific data concerning demographics, practice characteristics, practice-specific questions, and career planning and satisfaction were extracted and analyzed for this study.
Statistical analysis
Descriptive statistics and analysis, including frequency distributions and measures of central tendency, were used to summarize all responses. Additional statistical tests such as t-tests and z-proportions were used for comparative analysis. Results were compared with the published results obtained from the AAP's Med-Peds workforce survey done in 2013 [2].
Results
There were 1,395 respondents, of which 956 were considered eligible as having completed Med-Peds residency training. Of those, 763 of 1,664 eligible respondents were from the AAP listserv, resulting in a response rate of 45.8%. A total of 193 respondents were eligible physicians from the AMA MMS listserv, but we could not determine the total number of eligible AMA members and, therefore, the response rate (Figure 1). A total of 802 respondents completed the entirety of the survey, while others left some survey questions blank, resulting in a variable denominator within the responses. Due to skip and display logic questions, there was also variability in the responses to certain question sets depending on whether the questions applied to the respondent. Most respondents were members of the AAP (705/730, 96.6%), represented a wide range of geographical practice locations across the US (Figure 2), and self-identified as heterosexual, non-Hispanic, White women (337/599, 56.3%).
Number of Med-Peds respondents by stateMed-Peds: Internal medicine-pediatricsCredits: Kristin Wong
About 885 of 942 (94%) held allopathic doctorates, 46 (4.9%) held osteopathic doctorates, and 11 (1.2%) indicated an “other” type of medical degree. Most respondents had completed medical school in the US (778/802, 97%) and were currently dual-boarded (834/942, 88.4%). About 206 of 938 (22%) Med-Peds graduates had completed subspecialty or fellowship training (Table 1).
Practice and academic characteristics
Most of the respondents identified as primary care physicians (491/751, 65.4%) and practiced in a variety of settings including medical schools/hospitals (318/872, 36.5%) or family/Med-Peds group practices (145/872, 16.6%). Most respondents worked in urban communities (428/861, 49.7%), particularly as hospitalists (136/206, 66%) or subspecialists (99/140, 70.7%). A large proportion of respondents held faculty appointments (519, 59.5%) and pursued scholarly activities including quality assessment and quality improvement (QA/QI) (312/753, 41.4%) and medical education research (161/753, 21.4%). On average, respondents worked 50 hours/week for a full-time position (724/863, 83.9% of respondents worked full-time) and 32 hours/week for a part-time position (139/863, 16.1% of respondents worked part-time), with an average of 8.6 hours/week spent on documentation (n=853) and 70.1% time dedicated to direct patient care (807/840, 96.1% of respondents provided direct patient care). Of those providing direct patient care, 638 of 712 (89.6%) saw patients in both adult (≥18 years of age) and pediatric (<18 years of age) age groups and provided care evenly across the age range (Tables 2-3).
Financial and career attitudes
Most Med-Peds physicians reported working as employees and received benefits such as malpractice and health insurance, reimbursement for professional expenses, retirement, disability, and work bonuses. However, few received tuition (126/775, 16.3%) or loan reimbursements (86/775, 11.1%). While there were several Med-Peds physicians without debt (426/787, 54.1%), 200 of 787 (25.4%) respondents were somewhat concerned or very concerned about debt. This discrepancy was more evident when comparing recent graduates (early-career) and graduates more than 10 years out (late-career) (Tables 4-5). Over 50% of Med-Peds physicians’ compensation was dependent on relative value units (RVUs) (459/788, 58.2%) and less than 20% felt that Med-Peds had a negative effect on salary (132/755, 17.5%). Of note, many respondents believed their salary would be higher if employed solely in medicine (305/754, 40.5%) versus pediatrics (10/751, 1.3%). Respondents also believed that the group they worked for saw advantages to combined Med-Peds training (394/756, 52.1%) (Table 4).
Table 5: Significant differences between early versus late-career Med-Peds physiciansThe numbers do not sum to 100% due to rounding and not all respondents answered every question resulting in variable denominators per question.†: Early-career (<10 years after graduation); ‡: Late-career (>10 years after graduation); PCP: Primary care physicians; ABP: American Board of Pediatrics
Overall, most reported being satisfied with their training (740/761, 97.2%) and would choose Med-Peds again (679/755, 89.9%). Most were pursuing a primary career as a staff clinician (460/730, 63%), and 186 of 743 (25%) planned to reduce their Med-Peds workload in the next five years (Table 6).
Trends in the workforce over time
When comparing early-career Med-Peds physicians (defined as being in the workforce for 10 years or less) and late-career physicians (defined as being in the workforce for over 10 years), there were statistically significant differences (Table 5). Early-career respondents were less likely to be working in solo practices, had spent less time with their current employer, and had fewer job changes. Early-career respondents were also less likely to be practicing part-time, more likely to be provided health insurance and short-term disability, had more debt concerns, believed duty hour restrictions had a positive effect on their training, and were less likely to retire in five years. However, there was no significant difference in the proportion of early-career versus late-career respondents wanting to reduce their workload in the next five years (55/255, 21.6% versus 130/488, 26.6%, respectively; p=0.128). Time with the current employer and the number of job changes were found to be linearly related to time since graduation, with a Pearson's coefficient of 0.06344 and 0.03608, respectively (p<0.001).
More surprisingly, early career physicians were working in urban communities at medical schools/hospitals and for institutions/groups that saw advantages to Med-Peds training. Although respondents primarily pursued a primary career as a staff clinician and a secondary career in administration/leadership, there had been a rise in those pursuing careers in clinical education as primary and secondary career paths. In addition to a rise in physician hospitalists, there was also a trend toward more physicians practicing both primary care and hospital medicine (26/258 versus 28/490; p=0.028). Fewer graduates were boarded only in pediatrics, which seems to have resulted in a proportional increase in double-boarded physicians. A larger proportion of Asian (60/288 versus 56/504; p=0.0002) and smaller proportion of White (202/288 versus 403/504; p=0.0017) physicians were entering the field of Med-Peds. There was also an increase in the percentage of Blacks/African Americans entering the field (18/288, 6.3% versus 17/504, 3.4%; p=0.0574). All other characteristics and attitudes of the Med-Peds workforce presented in Tables 1-4, 6 had no statistical difference (p-values >0.05) when comparing early with late-career physicians, including satisfaction in training, the likelihood of choosing Med-Peds again, and being satisfied with their career.
Discussion
Clinical practice: primary care, hospitalist, and subspeciality
Several findings from this study have been consistent with the previous 2013 survey; however, much more has been revealed about the practice patterns, employment preferences, and concerns of the Med-Peds primary care workforce. While Med-Peds physicians remain actively engaged in primary care, a substantial number are choosing to practice hospital medicine, including a growing trend in combination hospital/primary care roles. However, when compared to internal medicine and pediatrics programs, the overall percentage of Med-Peds physicians practicing primary care is higher [7], suggesting a strong desire for Med-Peds graduates to remain in primary care. Still, hospital medicine appears to be a growing field with more Med-Peds physicians becoming members of the Society of Hospital Medicine (SHM). More recent evidence suggests this trend is plateauing around 24% of Med-Peds graduates [8], consistent with this study’s result of 27.4%. There also continue to be similar interests in subspecialty training when compared to the 2013 workforce survey. However, given this survey largely represents AAP members and recent evidence shows high attrition of Med-Peds graduates to internal medicine fellowships [8], this study is likely missing a large portion of subspecialist-related data. Other studies have noted as much as 40% of Med-Peds graduates pursue subspecialty careers [9], but graduate data does not account for several subspecialists identifying or dual practicing as primary care providers, such as infectious disease, adolescent medicine, geriatric, hospital, and academic specialists. Comparatively, this study shows 65.4% of respondents as practicing primary care.
Most Med-Peds physicians are engaged in direct patient care, with an even distribution of adult and pediatric patients (Table 2). This finding is similar to the age breakdown of patients in 2013 [2]. In the survey, 89.6% of Med-Peds primary care physicians saw patients across the age range of pediatric patients (less than 18 years of age) and adults (greater than 18 years of age). Despite practice changes endured in medicine over the last 10 years and the growing geriatric population, this has not affected the age ranges seen in this workforce. Many AAP members have also maintained membership with the American College of Physicians (ACP). This reaffirms the idea that most Med-Peds physicians practice both specialties in their careers [10]. This is vital as Med-Peds physicians are uniquely trained to care for complex pediatric patients into adulthood, reducing fragmentation or gaps in clinical services.
Patients with complex health needs, such as congenital heart disease and cystic fibrosis, are living longer [11,12] and the aging population highlights the growing demand for primary care services. Unfortunately, many of these shortages currently exist in rural settings [13,14], and this survey shows that Med-Peds physicians are inclined toward jobs in urban, university settings. This trend is likely influenced by the fact that only 2% of Medicare-funded residency positions occur in rural areas [15]. Although Congress recently created 1,000 new residency slots targeted toward training in rural and underserved areas, only 16.53 (4.13%) of the first 400 residency positions in 2023 went to pediatrics [15]. Strict Accreditation Council of Graduate Medical Education (ACGME) requirements also limit the existence of Med-Peds residency programs in areas with single institutional sponsorship of both internal medicine and pediatric programs [16]. While this survey was unable to determine if respondents preferred to work in a similar community compared to their training, AAMC data showed more than half of individuals practice in the state where they did residency, suggesting that they do not move far from their training grounds [17].
Adding to the limited number of Med-Peds training positions, this survey shows an equal proportion of early-career physicians wanting to reduce their workload compared to late-career physicians who are closer to retirement. That suggests a younger generation of physicians desiring a different work-life balance. This is consistent with AAMC’s 2022 survey findings that physicians expect to retire at an earlier age [3]. Therefore, a multi-specialty solution and thoughtfulness in the understanding of the younger generation's career goals is necessary to directly address the physician shortage and to provide seamless care to patients with complex medical needs.
Academia
One possible reason for Med-Peds physicians gravitating towards urban, university settings, is their propensity to maintain significant engagements in medical education. In addition to a large portion of the respondents holding a faculty appointment, there was a proportionally higher number of early-career physicians compared to late-career physicians pursuing medical education and QA/QI-related research activities. Early-career physicians have also surpassed late-career physicians in pursuing clinical education as a primary or secondary career, despite over 50% of late-career physicians working with trainees. These findings suggest a growing interest in academia and medical education in the Med-Peds workforce, as well as the development of a unique skill set due to the broad yet rigorous training requirements and the prevalence of Med-Peds training programs, particularly at larger academic institutions.
Diversity
Though not statistically significant, the percentage of Med-Peds women is higher than the results from 10 years ago. Over time, the percentage of women across the specialty has seemed to stabilize around 60% [4]. Not surprisingly, this data more closely resembles the gender differences seen in pediatrics presented by AAMC’s Physician Specialty Data Report 2022 [6]. This suggests that this survey’s respondents are more similar to pediatricians than internists. There is also a trend toward a more diverse workforce with a higher number of Asian physicians. However, racial differences do not seem to align with either pediatrics or internal medicine when compared to AAMC’s data, where rates of Asians in the workforce were slightly lower than AAMC’s Med-Peds results of 17.5% [6]. While the rise in the number of Black and African American physicians in the Med-Peds workforce survey has been modest, it is promising to see it is higher in Med-Peds than in medicine or pediatrics according to AAMC data (8.3% versus 6.7% and 6.5%, respectively) [6]. More concerning are the lower rates of Med-Peds physicians who identified as Hispanic or Latinx (4.8%) compared to medicine (6.3%) and pediatrics (7.8%) according to AAMC data [6] and mirrored in our survey results (2.4%). While ACGME has made efforts to emphasize and provide educational materials for the promotion of increasing diversity in medicine [18], these data suggest that more needs to be done in this area.
Training and certification
In 2024, there were 719 more positions offered in primary care compared to the previous match years; however, family medicine had 12% unfilled positions (636/5213), pediatrics had 8% (251/3078), and medicine had 5% (494/10261) [19]. Med-Peds had 100% filled positions (n=390), demonstrating continued interest in the specialty despite the concerns in other primary care fields [5]. While there are clear size differences, it remains that most Med-Peds physicians are satisfied with their career and training and would choose the same specialty again. This finding is consistent across Med-Peds physicians of all types: primary care physicians, hospitalists, and subspecialists. Concurrently, ACGME-imposed duty hour restrictions seem to positively affect the training of individuals who have completed Med-Peds residency. This, combined with the extremely high satisfaction with training preparation rates, suggests that Med-Peds residency programs provide sufficient training while adhering to duty hour restrictions despite an accelerated timeline for dual-specialty completion.
While the majority of Med-Peds physicians continued to maintain dual certification in pediatrics and medicine, there was a reduction in the number of those solely boarded in pediatrics. These trends mirror the larger workforce concerns in pediatrics (shift towards part-time work, concern about compensation, transition to urban practice, and loss of rural access to care). This is further highlighted in the national trend moving away from pediatrics as seen by a steady decrease in pediatric residency and fellowship applicants over the past few years [20]. Med-Peds residency programs tend to draw in a competitive applicant pool, with 86.9% of the available positions in 2024 filled by US Doctors of Medicine (MDs) compared to 35% in internal medicine and 47.6% in pediatrics [5], contributing to the outcomes and career choices of the Med-Peds workforce. With the increase in double-boarded Med-Peds physicians and highly successful match rates, increasing the number of available Med-Peds training positions would likely serve to benefit the widening gap in the primary care workforce, with the consideration of supporting training programs or workforce opportunities within rural areas.
Compensation and debt
While there were several Med-Peds physicians without debt, there were growing concerns about educational debt between early-career versus late-career respondents. This is likely a result of rising medical education costs, which are increasing at 2.9% per year after adjusting for inflation [21]. About 70% of medical school graduates have educational debt in the mean amount of 206,000 in 2023 [[22](#REF22)]. Medical school debt has wide-reaching effects on medical school graduates in terms of career choice, with those with more debt choosing higher compensation specialties. Despite these concerns, Med-Peds physicians showed confidence in their compensation and benefits, with less than 20% believing that Med-Peds training has a negative effect on salary. Interestingly, a large portion of Med-Peds physicians believed that their compensation would be higher if hired by internal medicine departments as opposed to pediatric departments. This is consistent with overall annual compensation rates of 312,526 for internists versus 273,472 [23]. Several pediatric subspecialties also lined the top 20 specialties with the lowest average annual compensation. In contrast, internal medicine subspecialties, such as cardiology, gastroenterology, and pulmonology, ranked among those with the highest annual compensation. Significant pay gaps by gender of around 23% also add to the inequitable compensation of pediatric professionals given a higher percentage of women in the field [23]. These differences in pay will continue to affect employee and employer decisions. While some employers will see a benefit of having Med-Peds physicians in pediatrician-sparse areas, Med-Peds employees may lean toward internal medicine for larger compensation packages. How these pressures will continue to affect the career decisions of new graduates and the Med-Peds workforce remains to be seen.
Limitations
There are several limitations to this study. The results of this survey primarily reflect the opinions of practicing Med-Peds members within the AAP, and despite the survey distribution through the MMS listserv of AMA members, the AAP’s listserv likely contained more up-to-date contact information of active members who had completed residency training. The survey also contained skip and display logic questions leading to variable response rates to each set of questions. However, likely due to the length of the questionnaire, there was also variation in the response rate to all available questions, leading to different denominators within question sets. It is also unclear what the motivations were of respondents answering some questions and not others. While most have maintained dual membership with the ACP, it is unclear if the reverse is true without an equivalent study distributed through the ACP. In 2022, the AAMC reported 6,088 Med-Peds physicians in the US [6]. This study likely represents 15% of the total workforce and is weighted toward primary care. Despite these limitations, it is important to recognize that little is published about the Med-Peds workforce nationally, and given the consistencies between this and the 2013 survey, these results are still generalizable to a large portion of the workforce.
Conclusions
Med-Peds offers a unique and diverse training program for physicians, particularly those interested in primary care, medical education, and urban health. These survey findings provide valuable insights into the current state of the Med-Peds workforce and underscore the importance of this specialty in addressing evolving healthcare needs. The Med-Peds specialty continues to attract diverse talent, offering a rewarding career path with opportunities for growth and impact within the healthcare community. By addressing key areas such as workforce shortages, diversity, education costs, training and certification, and pay gaps, the Med-Peds workforce can continue to thrive and make meaningful contributions to the healthcare landscape.
The reference list from the paper itself. Each links out to its DOI / PubMed record.
- 1The history of the Med-Peds program 4 2024 Barr J 2023 http://publications.aap.org/pediatrics/resources/26198/The-History-of-the-Med-Peds-Program?autologincheck=redirected
- 2Characteristics of the combined internal medicine-pediatrics workforce Am J Med Donnelly MJ Thornton SC Radabaugh CL Friedland AR Cross JT Ruch-Ross HS 1374137912820152632753510.1016/j.amjmed.2015.08.013 · doi ↗ · pubmed ↗
- 3The complexities of physician supply and demand: projections from 2021 to 2036 The Complexities of Physician Supply and Demand: Projections From 2021 to 2036 8 2024 Washington, DCAAMC 2024 http://www.aamc.org/media/75231/download?attachment
- 4Changes in health care use and outcomes after turnover in primary care JAMA Intern Med Sabety AH Jena AB Barnett ML 18619418120213319676710.1001/jamainternmed.2020.6288 PMC 7670398 · doi ↗ · pubmed ↗
- 5Results and data: 2024 main residency match Results and Data: 2024 Main Residency Match® 8 2024 Washington, D.C.NRMP 2024 https://www.nrmp.org/match-data/2024/06/results-and-data-2024-main-residency-match/
- 6US physician workforce data dashboard 1 2025 2022 http://www.aamc.org/data-reports/report/us-physician-workforce-data-dashboard
- 7Workforce characteristics of Med-Peds hospitalists Cureus Moza R Fish D Peterson RJ 14202210.7759/cureus.24799 PMC 916943335676991 · doi ↗ · pubmed ↗
- 8Career choices for graduates of combined medicine-pediatrics residency programs: a multi-year survey J Gen Intern Med Agrawal A Aronica M Kisielewski M Doolittle B 202510.1007/s 11606-024-09204-9PMC 1196857439806250 · doi ↗ · pubmed ↗