Social and economic predictors of under-five stunting in Mexico: a comprehensive approach through the XGB model
Brian Fogarty, Angélica García-Martínez, Nitesh V Chawla, Edson Serván-Mori

TL;DR
This paper uses machine learning to identify social and economic factors linked to childhood stunting in Mexico, highlighting the need for targeted interventions.
Contribution
The study introduces a novel application of the XGB model to analyze stunting risk in Mexico, emphasizing indigenous status and local deprivation as key predictors.
Findings
XGB model outperformed other algorithms in predicting childhood stunting in Mexico.
Household socioeconomic status and local deprivation were top predictors of stunting.
Indigenous population status was identified as a significant risk factor.
Abstract
The multifaceted issue of childhood stunting in low- and middle-income countries has a profound and enduring impact on children's well-being, cognitive development, and future earning potential. Childhood stunting arises from a complex interplay of genetic, environmental, and socio-cultural factors. It requires a comprehensive approach across nutrition, education, healthcare, and poverty reduction sectors to mitigate its prevalence and short- and long-term effects. The Mexican case presents a distinct challenge, as the country has experienced the recent dissolution of social health security programmes, rising poverty rates, and reduced government expenditures for childhood well-being. We propose a machine learning approach to understand the contribution of social and economic determinants to childhood stunting risk in Mexico. Using data from the 2006–2018 population-based Mexican…
Genes, proteins, chemicals, diseases, species, mutations and cell lines named across the full text — each resolved to its canonical identifier and authoritative record.
Click any figure to enlarge with its caption.
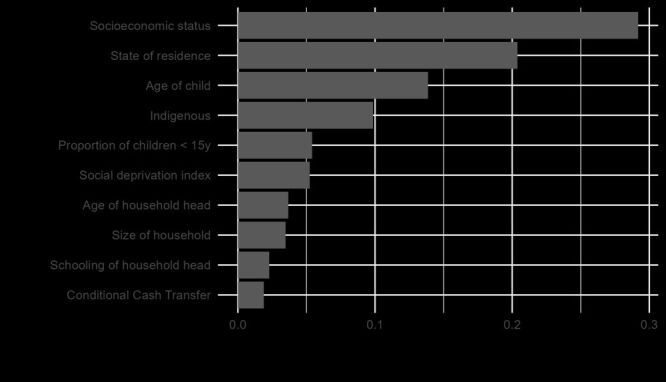 Figure 1
| Sample size (n) = 20 803 | Mean or % (95% CI) |
|---|---|
| Child |
|
|
| 13.86% (13.40, 14.34) |
|
| 13.28% (13.40, 14.34) |
|
| 13.76% (13.07, 14.48) |
|
| 15.27% (14.16, 16.45) |
| Age, years | 2.67 (2.65, 2.69) |
| Female | 49.19% (48.51, 49.88) |
| Household head |
|
|
| 40.23 (40.05, 40.42) |
|
| 7.45 (7.38, 7.50) |
|
| 12.50% (12.06, 12.96) |
|
| 80.44% (79.89, 80.98) |
| Marital status |
|
|
| 86.45% (85.97, 86.91) |
|
| 10.92% (10.50, 11.35) |
|
| 2.63% (2.42, 2.86) |
| Household |
|
|
| 5.24 (5.21, 5.27) |
|
| 28.7 (28.5, 28.8) |
|
| 44.2 (44.0, 44.4) |
|
| −0.045 (−0.058, 0.031) |
|
| −0.602 (−0.616, 0.589) |
| Participating in a conditional cash transfer programme | 30.64% (30.01, 31.27) |
| Health insurance |
|
|
| 27.39% (26.79-28.00) |
|
| 38.55% (37.88-39.21) |
|
| 1.48% (1.32-1.66) |
|
| 32.58% (31.95-33.23) |
| State of residence |
|
|
| 3.88% (3.62, 4.15) |
|
| 2.37% (2.17, 2.59) |
|
| 2.60% (2.39, 2.82) |
|
| 3.20% (2.96, 3.45) |
|
| 2.59% (2.38, 2.82) |
|
| 2.62% (2.41, 2.85) |
|
| 4.11% (3.84, 4.39) |
|
| 2.72% (2.50, 2.95) |
|
| 2.06% (1.88, 2.27) |
|
| 3.38% (3.14, 3.64) |
|
| 3.39% (3.15, 3.65) |
|
| 3.71% (3.46, 3.98) |
|
| 3.19% (2.95, 3.44) |
|
| 3.23% (3.00, 3.48) |
|
| 3.21% (2.98, 3.46) |
|
| 3.27% (3.03, 3.52) |
|
| 3.18% (2.95, 3.43) |
|
| 2.85% (2.62, 3.08) |
|
| 3.09% (2.86, 3.33) |
|
| 4.05% (3.79, 4.33) |
|
| 3.25% (3.01, 3.50) |
|
| 2.96% (2.73, 3.20) |
|
| 2.96% (2.74, 3.20) |
|
| 2.93% (2.70, 3.17) |
|
| 2.60% (2.39, 2.82) |
|
| 2.59% (2.38, 2.81) |
|
| 4.03% (3.77, 4.31) |
|
| 2.86% (2.64, 3.10) |
|
| 3.69% (3.44, 3.96) |
|
| 3.21% (2.98, 3.46) |
|
| 3.11% (2.88, 3.35) |
|
| 3.13% (2.90, 3.38) |
| Variables | LGB | Logistic | NN | MARS | RF | XGB |
|---|---|---|---|---|---|---|
| YI | 0.248 | 0.236 | 0.241 | 0.235 | 0.233 | 0.255* |
| ROC AUC | 0.664 | 0.674* | 0.666 | 0.670 | 0.669 | 0.672 |
| MCC | 0.181 | 0.172 | 0.169 | 0.168 | 0.185* | 0.185* |
|
|
|
|
|
|
|
|
| Specificity | 0.697 | 0.688 | 0.624 | 0.661 | 0.779* | 0.692 |
| Sensitivity | 0.551 | 0.548 | 0.617* | 0.574 | 0.454 | 0.563 |
| Accuracy | 0.677 | 0.669 | 0.623 | 0.649 | 0.734* | 0.674 |
Peer Reviews
No public reviews on file for this paper yet. If you reviewed it on a platform where reviews are public (OpenReview, ICLR, NeurIPS, ICML), you can paste yours below so the community can read it here.
Videos
No videos yet. Explain this paper in a talk, walkthrough, or lecture? Add one.
Taxonomy
TopicsChild Nutrition and Water Access
Over the past few years, hard-won progress in reducing global malnutrition has been stymied by the direct and indirect impacts of the COVID-19 pandemic and conflict in Ukraine [1,2]. These impacts include shifting public health priorities, reducing and eliminating nutrition programmes, and disrupting the global supply chain. Childhood malnutrition is particularly insidious due to the short- and long-term effects on the development of individual children, as well as its adverse effects on local communities, regional populations, and entire societies [3,4]. Despite numerous efforts and interventions to tackle the underlying factors associated with childhood malnutrition, it remains a persistent and chronic global public health challenge [5]. The scale of the problem is alarming, with international organisations reporting 148.1 million children are affected by stunting, 45 million by wasting, and 37 million by being overweight [6].
Researchers seeking a better understanding of childhood malnutrition to guide the development of targeted interventions have been hindered by the limited availability of high-quality and harmonised data. This challenge is especially pronounced when studying vulnerable groups, such as indigenous populations in low and middle-income countries (LMICs) [2]. Given the available data, a critical question is whether we can leverage Artificial Intelligence (AI) to enhance our insight into the determinants of childhood malnutrition and design new approaches for mitigating its prevalence and impact [7]. In this paper, we employ machine learning (ML) classification algorithms, a subset of AI, to assess the influence of social health protection programmes and social and economic factors on the risk of childhood stunting in Mexico between 2006–2018.
Mexico, the world's fifteenth largest economy [8], the tenth most populous country globally and second in Latin America and the Caribbean [9], and highly economically unequal [10], is a compelling case study among LMICs for investigating the multifaceted factors contributing to childhood stunting at the individual, family, and community levels [4]. Mexico's social health system has recently scaled back pivotal health and nutrition initiatives designed to safeguard vulnerable populations, including for indigenous and children under five years old in rural areas [11]. The reduction in government support has imposed additional financial burden on families, resulting in many children foregoing preventative and essential medical care [12]. By not addressing stunting and poor health in childhood, countries like Mexico are creating conditions where a larger proportion of the most vulnerable population are at higher risk of developing chronic health issues in adulthood [13–16]. This perpetuates limited opportunities for social and economic advancement within rural communities, further exacerbating inequities between them and their urban peers [11,14,17,18].
The intricate interdependence of health outcomes with other social subsystems (e.g. education, economic, environmental, etc.) [19,20] calls for a comprehensive analytical approach to the problem of child malnutrition [21]. Prior research has recognised the potential of robust predictive models to inform the design of innovative strategies aimed at effectively addressing the factors that influence the prevalence and persistence of child malnutrition [22,23]. However, the paucity of high-quality, longitudinal data has limited the implementation of predictive models in this area [2].
In lieu of high-quality nutrition data, particularly in LMICs, researchers have increasingly adopted ML as an alternative modelling approach to applied statistical analysis [24]. For example, ML has recently been used to study childhood malnutrition in Bangladesh [25–27], Pakistan [28], Philippines [29] and Rwanda [30]. Machine learning is adept at sifting through large and complex data sets to discern patterns and identify latent factors involved in nutrition-related outcomes and public health [31]. Other recent applications in public health include creating predictive models for nutritional risk assessment, regional health needs, disease patterns, and healthcare expenditure forecasts [32].
METHODS
We conducted a pooled cross-sectional analysis using data from three National Health and Nutrition Surveys (Encuesta Nacional de Salud y Nutrición, ENSANUT) carried out in 2006, 2011/12, and 2018/19. Each survey collected social, demographic, and health-related data from the Mexican population and recorded information on the coverage of health services. The methodological details of the surveys have been described elsewhere [33,34]. However, briefly, ENSANUT is a probabilistic, population-based, stratified, two-stage, cluster-design survey conducted in all 32 Mexican states, with samples representative at national and state levels and disaggregated into urban and rural strata. Data are gathered during home visits through electronically captured face-to-face interviews after respondents provide informed consent or assent. The protocols for the three surveys were approved by the Research Ethics and Biosecurity Committees of the authors’ institution in Mexico. Data collected are available to the public and can be downloaded from https://ensanut.insp.mx/.
We analysed the survey modules on sociodemographic and household characteristics, as well as the module on anthropometric measurements. After combining the data from the three survey rounds, we selected only those children with complete information for all relevant characteristics. Consequently, from the initial sample of 21 304 children, we excluded 501 due to missing data, resulting in a 2.4% reduction in sample size. We then compared the children included in the final analysis (n = 20 803) with those excluded, across various relevant characteristics, and found no significant differences between the two groups.
Outcome variable
We assessed the nutritional status of the children according to the World Health Organization (WHO) child-growth standards based on height and age [35,36]. We defined a binary variable to classify children as stunted (1) if their height-for-age Z-score was <−2 and not stunted (0) if it was ≥ −2. All observations were within the interval from − 6.0 to + 6.0 Z-score (for length or height for age) for identifying valid observations.
Social and economic predictors
We selected demographic and socioeconomic predictors for our ML models based on prior literature, theoretical expectations, and bivariate statistical analyses [17,37–39]. Since we had categorical and numeric predictors, two types of bivariate statistical analysis were conducted. First, logit regression analyses were used with stunting as the outcome variable and each predictor was tested individually. Second, χ^2^ analyses were performed between stunting and each predictor, where quartile versions of the numeric predictors (i.e. categorical versions were created) were used. Predictors that did not have a statistically significant relationship with stunting in the logit regression and the χ^2^ analysis were excluded from the final set of variables used in the ML models. This process only excluded two variables – an indicator variable for whether the head of household was working and the proportion of the household 65 years old or older. To reduce potential collinearity, we removed predictors that were highly correlated and measured the same concept, keeping only the most relevant ones based on substantive importance. Specifically, we excluded adult equivalency and retained household size. Additionally, we removed predictors for the proportion of household members aged 15–64 years and over 65 years and kept the predictors for the proportion of household members under five years and under 15 years. Further, in our ML models, we use the non-categorical versions of the numeric predictors to preserve variation in our predictors’ values. We tested an all-categorical version of the predictors, and the classification metrics were the same or worse depending on the algorithm.
Three groups of predictors were selected:
-
Individual: age (years) and sex (male = 1, female = 0) of child
-
Household: age, sex, education level, and marital status (free union/married, separated/divorced/widowed, single) of household’s head, the type of health insurance (social security, the extinct Seguro Popular de Salud, private, mixed, other or none), the household’s size, the proportion of household members aged 0–5 years and under 15 years, indigenous status (defined according to the official Mexican definition: those residing in a household where the head of the family, a spouse and/or an older relative such as a grandmother speaks an indigenous language) [40,41], participating in the Mexico’s Conditional Cash Transfer Progresa/Prospera/Oportunidades (CCT-POP) programme [42–44], and a factorial index of assets and housing materials as a measure of socioeconomic status (SES) [45–54]. We calculated the index based on the factor loadings for the 2006 survey. This index consolidates a broad range of household characteristics into a single variable. These characteristics include asset ownership (television sets, radios or stereos, iron, refrigerator, gas cooker, blender, washing machine, telephone, car or motorised transport), housing conditions (roofs, walls, and floors made of durable materials, number of bedrooms), and access to essential public services (electricity, running water and sewage services). To ensure consistency and comparability across different survey years, we applied the factor weights estimated from the 2006 survey (the first round of data collection) when constructing the index. The range of the SES index was from −3.997 to 2.069; more positive scores indicate higher SES, while lower SES households have more negative scores.
-
Place of residence: we also included state and a social deprivation index for the place of residence based on municipal access to basic public services, housing conditions, and salary [55]. This index ranged from −2.982 to 3.652, with higher values indicating greater social and economic development in the municipality.
Table 1 provides descriptive information about the variables used in our analysis. Of note, the overall percentage of children classified as stunted was 13.9% in our analytical sample. Over the three waves, stunting increased from 13.3% in 2006 to 15.3% in 2018.
Machine learning approach
Prior to specifying and evaluating classification algorithms, we first pre-processed our data. To maximise the number of observations in our models, we imputed missing values in numeric predictors (using the mean) and in categorical predictors (using the mode). No numeric predictor had an absolute difference between the mean and median greater than 1.5 times the interquartile range. Therefore, missing values were imputed using the mean rather than the median. Since the amount of missing data was small (only five predictors had missing values, consisting of a total of 709 observations) and did not appear to be influenced by or related to other predictors, this simple imputation approach performed similarly to more complex imputation methods (e.g. K-Nearest Neighbors imputation). We next dummy encoded all of the categorical predictors. All numeric predictors were normalised as is required for some algorithms we examined (e.g. neural networks) and as a general practice to improve learning efficiency [56]. We also applied a zero-variance filter to remove any predictors that consisted of a single value. However, none of the predictors were found to have zero variance. Additionally, we specified a mixed generalised linear model encoding for households’ states instead of a fixed effect specification. Analysis was conducted using R, version 4.2.2 (Vienna, Austria) with the ‘tidymodel’s’ framework and packages [57].
We split the data into a training set (75% of observations) and a testing set (25% of observations). Due to the imbalanced nature of our outcome variable, stunting, we used simple up-sampling of the minority class to create even classes in the training data. Simple up-sampling performed better than other techniques such as Synthetic Minority Over-sampling Technique SMOTE [58]. Following standard guidance, the up-sampling was only applied in the training data and not the testing data [57]. If we did not apply oversampling (or under sampling) in this case, the classification algorithms would likely overfit the ‘not stunted’ outcome (the majority class). As a result, commonly used evaluation metrics, including accuracy and Receiver Operating Characteristic Area Under the Curve (ROC AUC), would indicate better performance than what was achieved. For example, if a model classified all children as not stunted and none as stunted, the accuracy would be 0.861 (the proportion of children in the data who are not stunted).
Since we had no a priori expectation about the best model for predicting childhood stunting, we initially tested 10 commonly used algorithms for binary classification. Four algorithms performed poorly, based on classification metrics, and were excluded from further consideration. The excluded classification algorithms were Support Vector Machines (Radial Basis Function specification), K-Nearest Neighbors, Classification and Regression Trees (CART), and Bagged CART [57]. Six algorithms performed similarly in initial testing analysis: logistic, random forest (RF), neural network (NN), multivariate adaptive regression splines (MARS), Extreme Gradient Boosting (XGB), and Light Gradient Boosting (LGB).
In the training phase, each algorithm’s parameters were tuned over a grid (consisting of 25 different parameter values) and performance was evaluated using stratified 10-fold cross-validation resampling. Due to the outcome variable’s imbalanced classes, we used the Youden Index (YI) to determine each algorithm’s optimal specification. Youden Index takes into account both sensitivity and specificity (sensitivity + specificity −1) and is insensitive to the distribution of observations across a variable’s categories [59,60]. Maximising this metric ensures that each algorithm’s specification was optimised for correctly classifying both children who are stunted and not stunted. Using common performance metrics such as ROC AUC and accuracy for this purpose can yield misleading results when working with imbalanced data [57,61]. The optimal parameter specifications, based on the training data, were then selected for each classification algorithm in the testing data. See Box 1 for the algorithms’ tuned specifications.
Box 1Classification algorithms’ final tuning specifications● LGB: tree depth = 4, learning rate = 0.000985, minimum loss reduction = 1.72e-10, minimal node size = 34, number of randomly selected predictors = 10, number of trees = 1661● Logistic: amount of regularisation = 0.0549, proportion of Lasso penalty = 0.0668● MARS: degree of interaction = 1● NN: number of hidden units = 1, amount of regularisation = 1.50e-10, number of epochs = 694● RF: number of randomly selected predictors = 1, minimal node size = 16, number of trees = 265● XGB: tree depth = 2, learning rate = 0.0239, minimum loss reduction = 11.2, minimal node size = 22, proportion of observations samples = 0.692, number of trees = 935
RESULTS
In Table 2, we present performance metrics for the six classification algorithms using the testing data. Given the imbalanced classes of the outcome variable, we use YI for determining the highest performing algorithm. Additional metrics, which are commonly used in classification, are provided in Table 2 for transparency. Although the algorithms performed somewhat similarly, XGB had the highest YI value (YI = 0.255). XGB also had the highest Matthew’s Correlation Coefficient (MCC) value, which is another commonly used metric for evaluating classification performance in the presence of imbalanced data. This means that XGB achieved the highest performance, effectively balancing the correct classification of children with stunting (i.e. sensitivity) and without stunting (i.e. specificity). Random Forest was the best algorithm for classifying children without stunting (specificity = 0.779) but performed poorly at classifying children with stunting (sensitivity = 0.454). Even though we used oversampling in training, the fact that RF had the highest accuracy (accuracy = 0.734) in testing highlights the issue of relying on performance metrics that are sensitive to imbalanced data.
Figure 1 illustrates the 10 most important predictors contributing to XGB’s classification performance. The most important predictor is SES (socioeconomic status of the household), followed by State (pooled effect of Mexican states), child’s age, indigenous status, number of children <15 (household’s portion of children under 15 years old), deprivation index (local area’s deprivation level), age of household head (HH Age), household size (number of members), schooling of household head (HH Edu), and CCT-POP programme.
Extreme Gradient Boosting (XGB) variable importance.
Lower in importance than one might expect is household participation in Mexico’s CCT-POP programme. This programme was designed to improve the health and well-being of Mexicans, especially children. The CCT programme, technically part of Oportunidades/Prospera, initially focused on conditional cash transfers to low-income families for poverty alleviation but subsequently expanded to encompass broader social protection measures addressing various well-being dimensions [11]. Mexico also implemented child nutrition programmes, targeting marginalised communities with initiatives such as supplementary feeding and nutrition education [62]. Programme effectiveness varied and was contingent on factors like design, funding, and evolving social and economic contexts.
DISCUSSION
Utilising a ML approach, this paper underscores the significance of family socioeconomic status, community deprivation levels, state of residence, and indigenous status in understanding childhood malnutrition in Mexico. These structural factors collectively highlight the profound impact of poverty on childhood stunting, with potential short- and long-term consequences not only for individual children and families but also for local and regional communities. Addressing the influence of these factors on childhood stunting, and consequently tackling poverty itself, necessitates synergistic partnerships between governmental and non-governmental organisations (NGOs). Such collaborations can harness the strengths of governmental bodies (e.g. resources, infrastructure, policy management) and non-governmental entities (e.g. flexibility, technical expertise, community engagement strategies) to deliver coordinated and sustainable interventions aimed at mitigating persistent public health issues such as childhood malnutrition.
Our research leverages ML to transcend traditional analyses, offering a comprehensive perspective on the social and economic predictors of stunting, which have been underexplored in the Mexican context. It is crucial to note that our study’s aim is not to compare different ML algorithms to identify the highest performer for modelling childhood stunting. Rather, it aims to illustrate how ML can complement existing research by revealing nuanced insights into the structural determinants of stunting that may escape traditional statistical models. This approach allows for a more robust understanding of the factors driving childhood stunting in Mexico and similar contexts [30,63,64].
While our research indicates that the CCT-POP programme in Mexico may have had a limited influence on addressing childhood stunting, the programme initially succeeded in narrowing inequality gaps and reducing chronic malnutrition in Mexico when launched in 1999 [65–67]. Our study pools survey data from the 2006, 2012, and 2018 ENSANUTs and thus we are capturing the programme’s importance from 2006–2018. During this period, the programme became increasingly ineffective and unsustainable due to growing resource constraints, shifting priorities towards other policy initiatives, and waning political support across multiple presidential administrations [42,68]. Because politicians typically gain credit only for initiating new government programmes, incoming administrations frequently phase out or reduce funding for existing programmes that lack widespread public support [69]. Social welfare programmes can be especially susceptible to diminished investment or complete elimination under new administrations as they often only benefit a narrow segment of the population [70]. Curtailing or eliminating these programmes disproportionality impacts a society’s most vulnerable groups (e.g. the indigenous population in Mexico) and exacerbates existing health inequalities [69].
This raises the critical question of how to foster public-private partnerships that can develop effective and sustainable health, nutrition, and education programmes, especially tailored to the needs of young children, and are resistant to political changes. Private donors and NGOs in these partnerships may hesitate to continue funding programmes with limited impact on those most in need, suffer from wasteful management, and lack long-term public commitment. While studies like ours help identify factors that affect public health issues (e.g. childhood malnutrition), the effectiveness of interventions is contingent on the implementation, management, and commitment of governmental and NGOs [71].
Our study also identifies predictors previously highlighted in research as significant determinants of childhood stunting. These include child age [64,72], the presence of young children in households [73], and the age and level of education of the household head [4,74]. Designing programmes to address these determinants can be relatively straightforward and require low-cost interventions [68]. For example, if the risk of stunting monotonically decreases for a child overtime, then nutrition and health interventions can be targeted to the ages that generate the most beneficial effect [3]. In contrast, tackling the influence of structural factors in childhood stunting poses a substantially more challenging problem for researchers, policymakers, and stakeholders [3,4].
This study’s use of ML was motivated by the goal of identifying overlooked determinants of childhood stunting. In contrast to the deductive research process of testing theory-derived hypotheses using statistical inference, the inductive and conceptual-based approach of ML explores and leverages the data to identify patterns and relationships that may have eluded or been discarded by prior research. Through its application, we identified the importance of structural factors impacting childhood stunting and raised new questions about the role of Mexican states and social security programmes in childhood stunting and malnutrition more broadly. Machine Learning’s rigorous inductive approach to quantitative data analysis provides researchers innovative procedures to generate new insights and refine hypotheses and theories about a topic [75]. This approach is particularly useful in public health research, where many complex factors can contribute to health outcomes [76]. Critically, ML is not meant to replace traditional statistical modelling or qualitative analysis in public health research. Instead, it should be considered an additional methodological tool for public health researchers to use in tandem with traditional methods in developing a comprehensive understanding of various health outcomes [75].
Effectively tackling stunting in indigenous children requires a holistic public health approach. This involves implementing new policies and targeted programmes, revitalising social security initiatives, and consolidating them for real-time tracking of health and nutrition conditions among vulnerable population groups. To secure the well-being of indigenous populations, a collective regional agenda should be devised, integrating stakeholders, governments, research teams, quality data collection, and AI utilisation to anticipate actions, reduce costs, and enhance the social and economic development of these communities.
We demonstrate the impact of poverty at the family and community levels on childhood malnutrition. The results illustrate how the deficiencies of social security programmes in Mexico exacerbated existing inequities between indigenous groups and the broader population [67]. Our findings confirm age [64,72], the presence of more young children in households [73], and the age and education of the household head [4,74] as important predictors of stunting in children under five. Structural predictors highlight the profound impact of poverty at household and community levels, emphasising the potential negative consequences when social security programmes become unsustainable or ineffective [68]. Despite the initial success of CCT-POP programme had positive impacts on child health and nutrition outcomes [77], challenges in sustaining a trans-governmental programme and limited studies on long-term impacts hinder a comprehensive understanding of the chronic problem of malnutrition, particularly in the indigenous population [78]. The individual Mexican states also have an important contribution to stunting in children under five years. More exhaustive research is required to understand the intersection of poverty and social security programmes available at different levels of government and to understand the actual weights of structural determinants of stunting at the community level.
Current evidence shows how persistent socioeconomic disparities significantly impact stunting rates, particularly among vulnerable populations. Stunting in Mexico remains a critical public health issue, with a 16.3% prevalence in 2018, notably higher in rural southern regions and among low SES households [79,80]. Economic inequality restricts access to nutritious food and adequate healthcare, exacerbating chronic malnutrition. Systemic issues such as inadequate maternal health services, poor sanitation, and limited parental education also contribute to the problem [81]. The dismantling of social health programmes since 2018 has further exacerbated stunting rates, particularly following the COVID-19 pandemic. Indigenous households and those with the lowest SES face the greatest risk, underlining the need for targeted health-financial protection measures and addressing structural discrimination in healthcare [82,83].
The negative effect of stunting in health and neurodevelopment in indigenous populations, under a cycle of life perspective, is limited in the literature [84]. Beyond biological adaptations [3,28], concerns and questions revolve around addressing structural factors like inadequate social security programmes and limited resources. This raises the question of how to encourage public and private investment in high-quality, sustainable health, nutrition, and education programmes during the crucial ‘one hundred days’ window. Additionally, there is a consideration of whether and how civil organisations can efficiently facilitate these benefits for those most in need [71]. The multidimensional approach of stunting requires a comprehensive approach to how poverty and racial and ethnic disparities interact under cultural and social norms to understand the relevance of tailored programmes for vulnerable populations like indigenous [4,85]. Although previous studies found that these programs significantly improved children’s nutrition and reduced illness rates and stunting [65,66], the programmes only play a minor role in our results. This underscores the influence of structural factors, such as poverty and deprivation, in understanding childhood stunting in Mexico. We also found that the CCT-POP Programme did not have a statistically significant effect on childhood stunting in separate logit and complementary log-log regressions with fixed and random effects specifications.
Evidence reported in Latin American countries describes similarities in structural factors related to facilities, health care programmes, and vulnerable subgroups, such as children. Crucial points emerge when comparing crop and meat producers like Uruguay and Argentina to countries with high indigenous populations like Guatemala, Peru, and Mexico, where risk factors reveal similarities in social and economic deprivation contexts, illustrating a nutritional transition where all forms of malnutrition are present. For instance, in Uruguay, 5.45% of children under four in the lower-income tertile are stunted compared to 3.44% in the upper tertile. Excess weight is also a significant public health challenge, particularly among more educated mothers, highlighting the need for targeted interventions [86]. In Argentina, 26% of households have unsatisfied basic needs, 23% receive food assistance, and children are particularly affected by anaemia (15.2%), overweight/obesity (9.9%), and stunting (7.4%) [87]. Stunting prevalence rates (PR) in Peru shows significantly lower stunting in children with high socioeconomic status (PR = 0.25) and highly educated mothers (PR = 0.26), but higher stunting in Indigenous children (PR = 1.3), indicating the need for policies addressing socioeconomic and educational disparities [88]. In Guatemala, stunting prevalence among children is 46.7% (95% confidence interval (CI) = 45.0, 48.6), with higher rates among low-income, low-educated, and indigenous populations [89]. Despite none of the previous studies conducted in Latin America using ML as an approach for predicting stunting in children under five years, our results are consistent with the findings reported in those studies.
Integrating ML with traditional analytical approaches is vital for improving public health research. Machine Learning builds on statistical methods to manage complex patterns and large data sets, enhancing insights and data-driven decision-making [90,91]. However, both approaches face challenges including high-class imbalance, insufficient data variability, and confounding variables that can lead to poor model performance and biased results [92].
A key limitation in our study is the absence of comprehensive historical data, particularly maternal and foetal information covering the first five years of life. This data is crucial for understanding phenomena like stunting. Mexico’s shifting cultural and social landscape, coupled with intermittent social security programmes, further complicates the integration of long-term data, limiting the scope of our analysis.
Effectively tackling stunting in indigenous children requires a holistic approach, recognising it as a triple vulnerability. This involves implementing new policies and targeted programmes, revitalising social security initiatives, and consolidating a nutrition and health observatory initiative for tracking in real-time the condition of multi-vulnerable groups of the population. Finally, to secure the well-being of indigenous populations, a collective regional agenda should be devised, integrating stakeholders, governments, research teams, quality data collection, and AI utilisation to anticipate actions, reduce costs, and enhance the social and economic development of original communities.
While our findings are consistent with prior research, including that socioeconomic status and the child’s age play important roles in understanding childhood stunting in Mexico [93], our study also identifies key factors that have been overlooked or found to have null effects using statistical analysis. Unlike previous studies, we observe that children’s indigenous status and the level of deprivation in their local area are important factors in the prevalence of stunting. Hence, through the application of ML approach, we provide new insight into the determinants of childhood stunting that are not apparent with traditional statistical modelling. Mexico’s scaling back of pivotal health and nutrition initiatives, coupled with the absence of child-focused health and nutrition programmes, portends a substantial increase in childhood stunting and malnutrition, particularly among vulnerable populations such as indigenous and under-five children in rural areas. Given the limited investment in infrastructure and the need for skilled human resources in Mexico and other LMICs to address public health issues in specific groups, research like ours is critically needed by public health officials to help design effective interventions, policies, and programmes.
In sum, addressing malnutrition at the municipal level through sustainable actions supported by community engagement, access to healthy foods, and the collaboration of NGOs and international organisations is essential. Multi-sectoral interventions that integrate both nutrition-specific and nutrition-sensitive approaches, involving government, non-government, and private sectors, are key to improving outcomes like stunting. To break the cycle of poverty in LMICs, regional efforts are needed to monitor childhood malnutrition indicators and strengthen social programmes in education and health, particularly in rural and Indigenous communities [4,68]. Leveraging data science and AI to integrate social determinants of health can enable a comprehensive, inclusive approach to addressing stunting in children under five by capturing diverse influences and informing targeted, equitable interventions and policies [94].
The reference list from the paper itself. Each links out to its DOI / PubMed record.
- 1The triple burden of malnutrition. Nat Food. 2023;4:925. 10.1038/s 43016-023-00886-837985699 · doi ↗ · pubmed ↗
- 2Victora CG Christian P Vidaletti LP Gatica-Domínguez G Menon P Black RE Revisiting maternal and child undernutrition in low-income and middle-income countries: variable progress towards an unfinished agenda. Lancet. 2021;397:1388–99. 10.1016/S 0140-6736(21)00394-933691094 PMC 7613170 · doi ↗ · pubmed ↗
- 3De Sanctis V Soliman A Alaaraj N Ahmed S Alyafei F Hamed N Early and long-term consequences of nutritional stunting: from childhood to adulthood. Acta Biomed. 2021;92:e 2021168.33682846 10.23750/abm.v 92i 1.11346 PMC 7975963 · doi ↗ · pubmed ↗
- 4Vaivada T Akseer N Akseer S Somaskandan A Stefopulos M Bhutta ZA Stunting in childhood: an overview of global burden, trends, determinants, and drivers of decline. Am J Clin Nutr. 2020;112:777S–91S. 10.1093/ajcn/nqaa 15932860401 PMC 7487433 · doi ↗ · pubmed ↗
- 5World Health Organization (WHO). Reducing stunting in children: equity considerations for achieving the global targets 2025. Geneva 27, Switzerland. 2018. Available: https://www.who.int/publications/i/item/9789241513647. Accessed: 15 January 2022.
- 6United Nations International Children’s Emergency Fund (UNICEF). (WHO) WHO, World Bank Group (WB). Levels and trends in child malnutrition. UNICEF / WHO / World Bank Group joint child malnutrition estimates. Key findings of the 2023 edition. New York, NY. 2023. Available: https://data.unicef.org/resources/jme-report-2023/. Accessed: 13 May 2024.
- 7Liang W Tadesse GA Ho D Fei-Fei L Zaharia M Zhang C Advances, challenges and opportunities in creating data for trustworthy AI. Nat Mach Intell. 2022;4:669–77. 10.1038/s 42256-022-00516-1 · doi ↗
- 8The World Bank. Mexico overview. The World Bank in Mexico. 2023. Available: https://www.worldbank.org/en/country/mexico/overview. Accessed: 3 October 2024.