Toxicity and Oncologic Outcomes of Proton Radiotherapy for Oropharyngeal Cancer: A Systematic Review and Meta-Analysis
Niema B Razavian, Rachel F Shenker, Sydney Smith, Ralph B D'Agostino, Ryan T Hughes

TL;DR
This study reviews and analyzes the effectiveness and side effects of proton radiotherapy for treating oropharyngeal cancer compared to traditional methods.
Contribution
The study provides a meta-analysis of toxicity and oncologic outcomes of proton radiotherapy for oropharyngeal cancer.
Findings
Proton radiotherapy showed lower rates of acute feeding tube use compared to IMRT.
PRT had favorable toxicity and oncologic outcomes with high survival rates at two and three years.
Late toxicities like xerostomia and dysphagia were rare with PRT.
Abstract
Intensity-modulated radiotherapy (IMRT) for oropharyngeal cancer (OPC) is associated with acute and late toxicities that impact patient quality of life. Proton radiotherapy (PRT) can reduce exposure to surrounding tissues, but the clinical magnitude of this advantage is unclear. A systematic review and meta-analysis was performed in accordance with the Preferred Reporting Items for Systematic Reviews and Meta-Analyses (PRISMA) guidelines. Included studies reported toxicity or oncologic outcomes from patients treated with PRT for OPC. Pooled outcomes were estimated using random-effects models. Comparisons between PRT and IMRT were performed using log odds ratios. Primary outcomes were the pooled rates of adverse events, overall survival (OS), and progression-free survival (PFS). A total of 18 studies (16 retrospective, two prospective) consisting of 956 patients were identified. Pooled…
Genes, proteins, chemicals, diseases, species, mutations and cell lines named across the full text — each resolved to its canonical identifier and authoritative record.
Click any figure to enlarge with its caption.
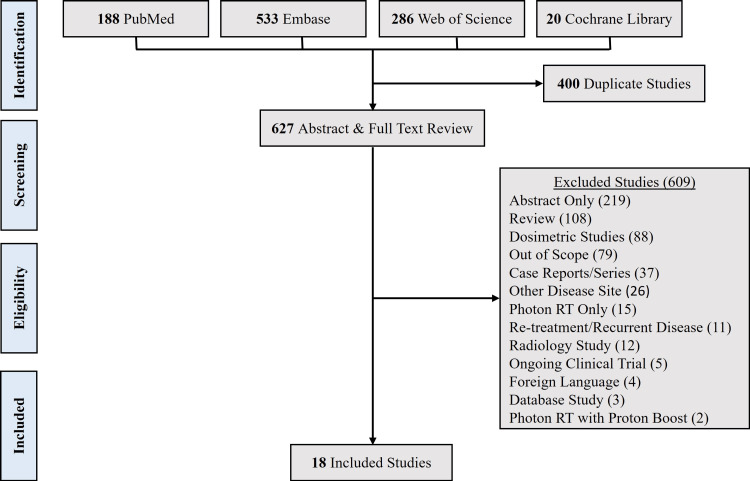 Figure 1
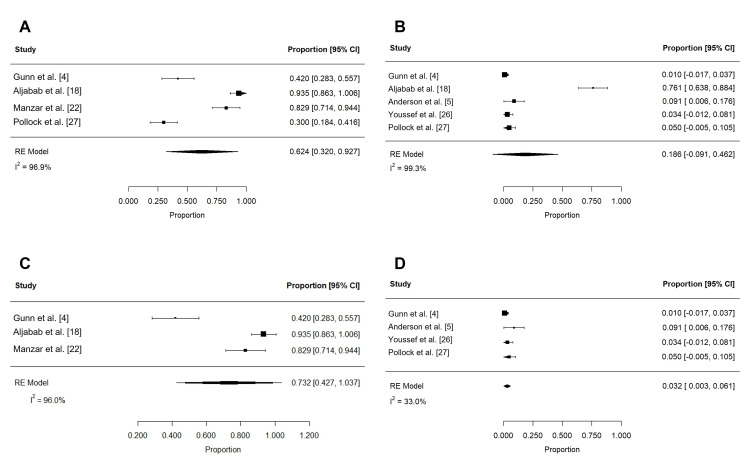 Figure 2
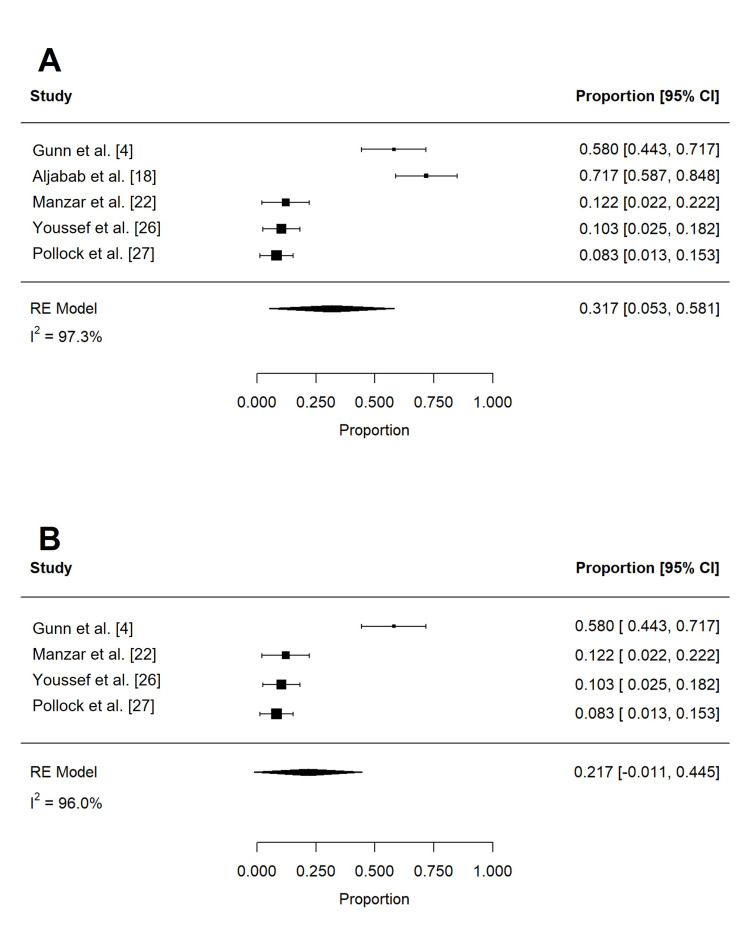 Figure 3
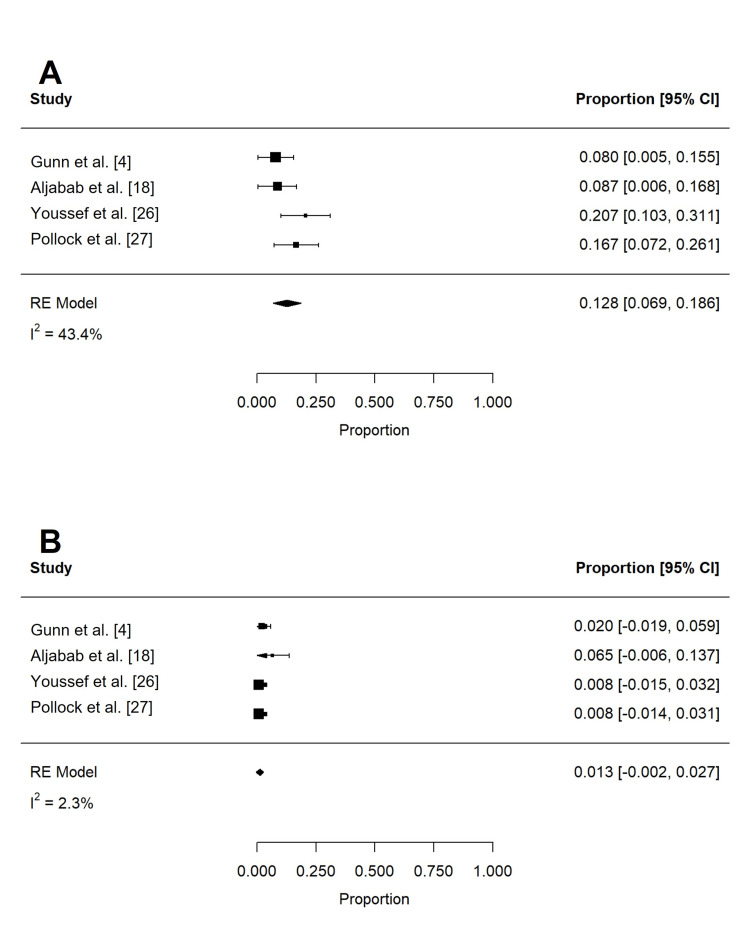 Figure 4
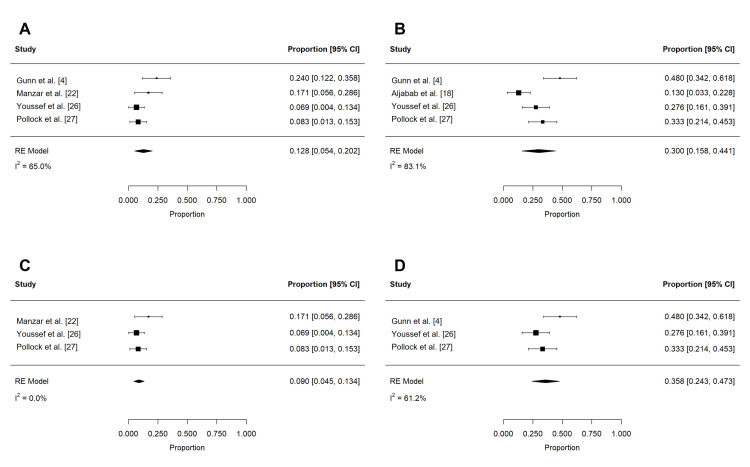 Figure 5
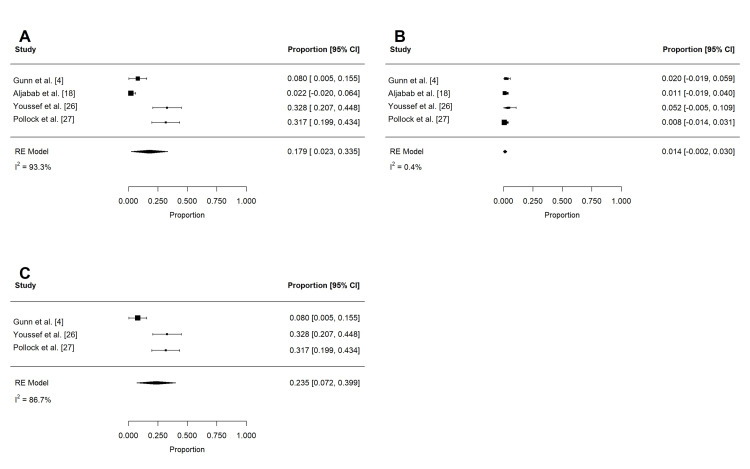 Figure 6
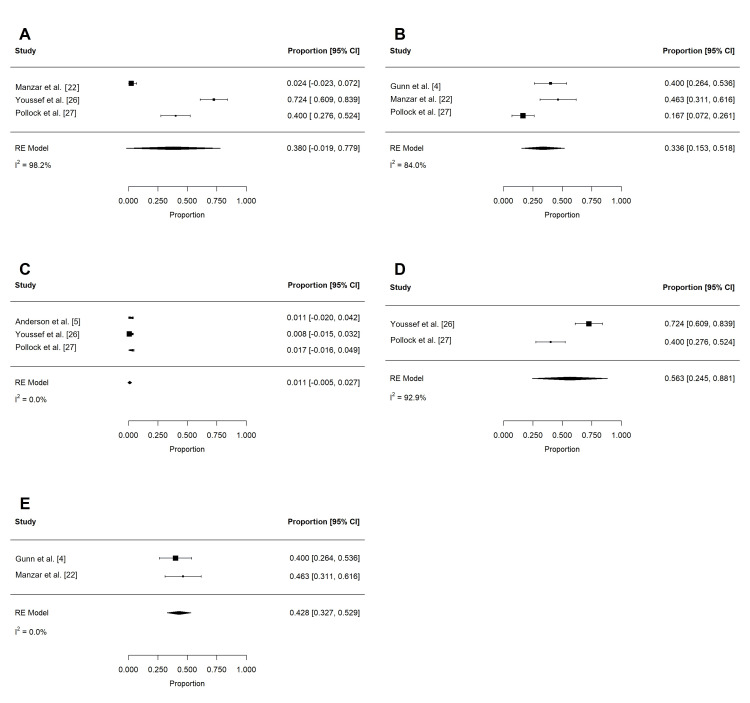 Figure 7
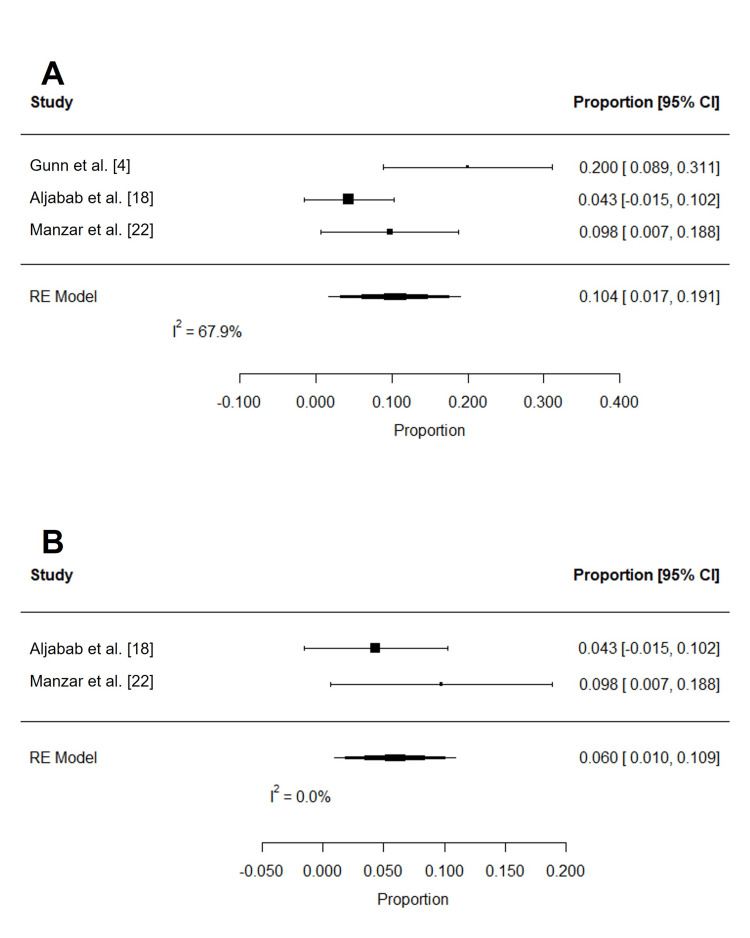 Figure 8
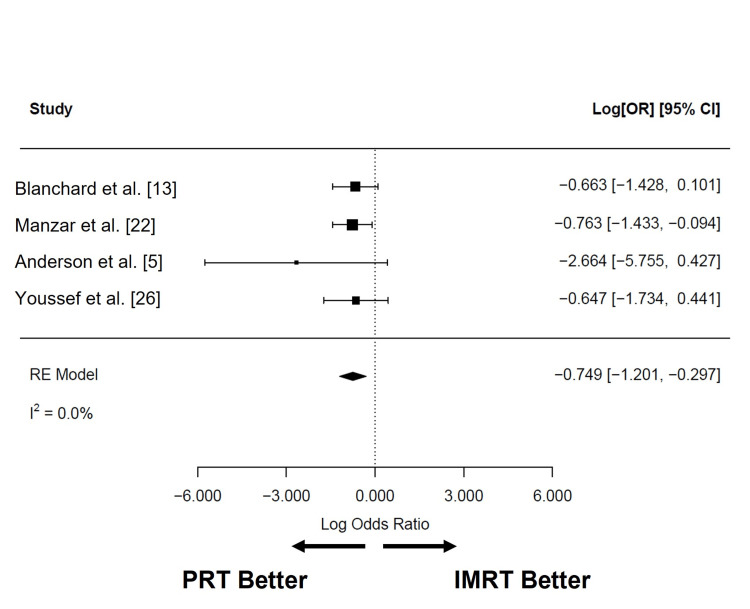 Figure 9
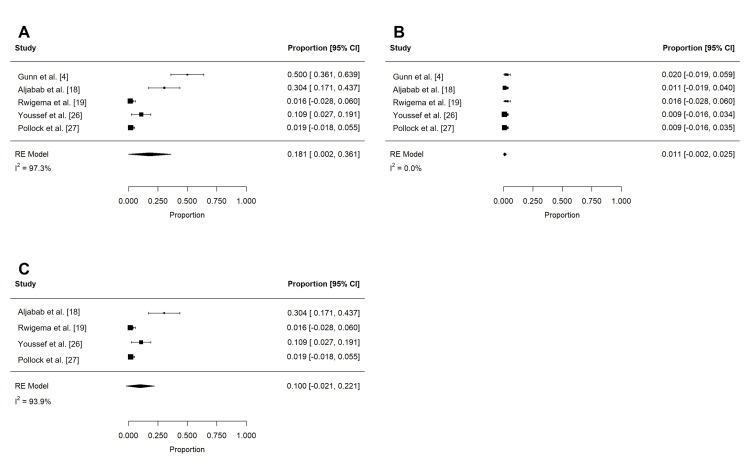 Figure 10
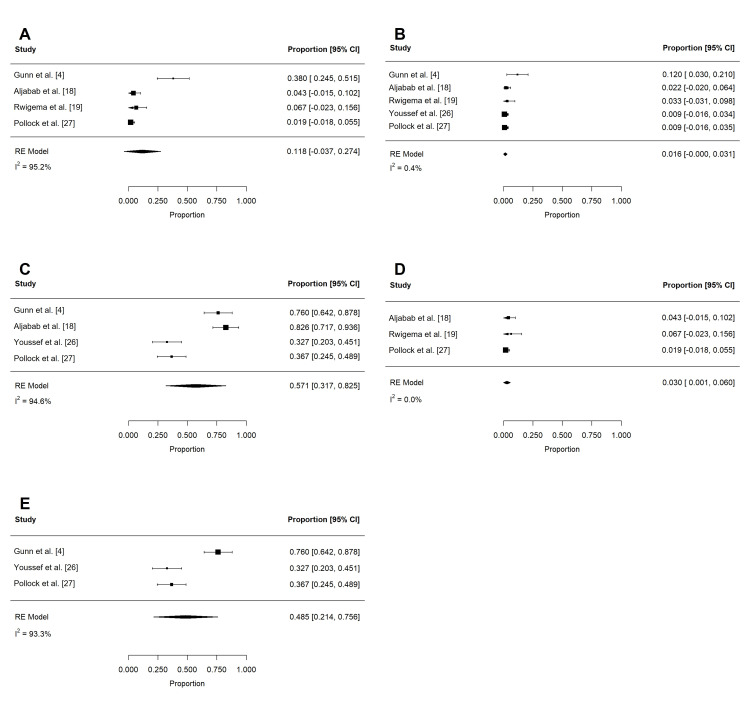 Figure 11
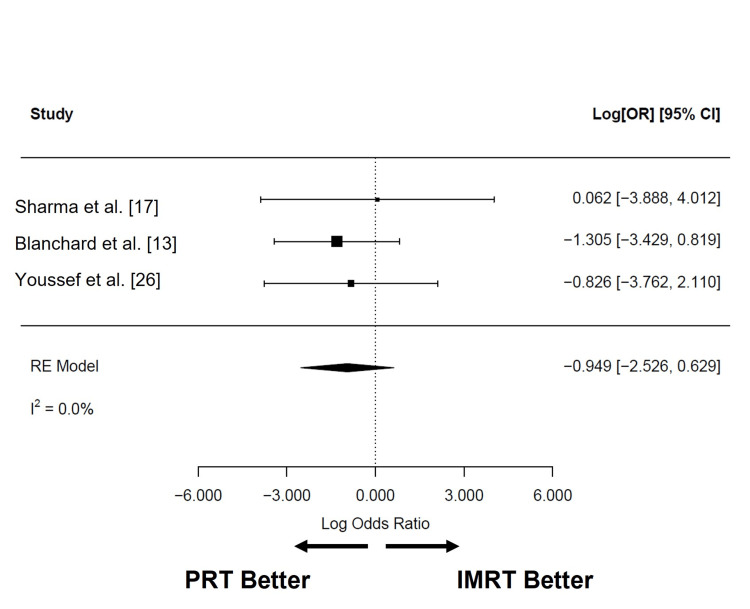 Figure 12
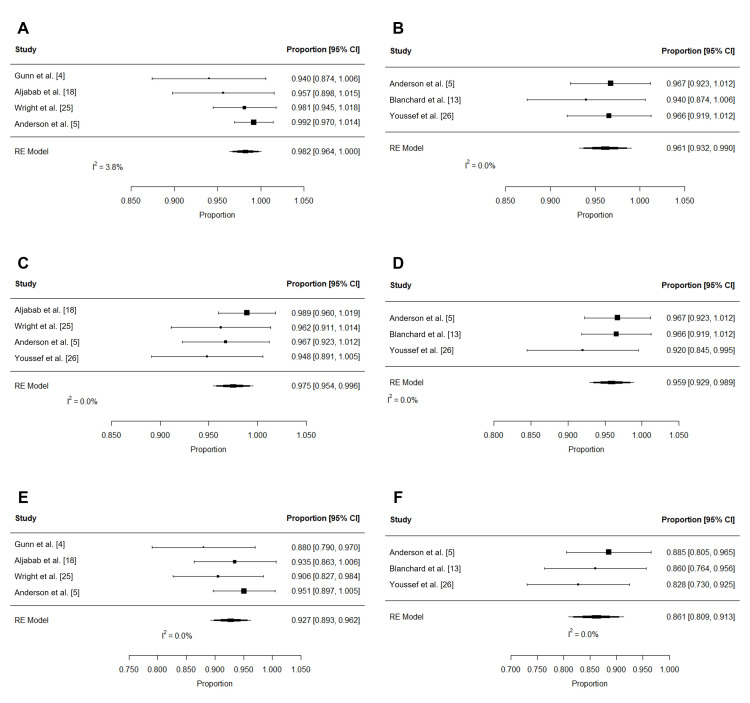 Figure 13
| Author (citation) | Study type | Study period | Institution | Total | Median FU, months (range) | Median age, years (range) | Men | Women | Any smoking | No smoking | Smoking unknown | HPV positive | HPV negative or unknown | BOT primary | Tonsil/other primary | Staging edition | Tumor (T)-stage | Nodal (N)-stage | Group stage | Definitive RT | Adjuvant RT | Median RT dose, Gy (range) | Induction chemotherapy | Concurrent chemotherapy | No chemotherapy | Acute feeding tube use | Late feeding tube use |
| Blanchard et al. [ | R | 2010-2014 | MDACC | 50 | 29 (8-49) | 61 (37-84) | 42 (84%) | 8 (16%) | 25 (50%) | 25 (50%) | N/A | 44 (88%) | 6 (12%) | 23 (46%) | 27 (54%) | N/A | T1-2: 40 (80%), T3-4: 10 (20%) | N0-1: 10 (20%), N2-3: 40 (80%) | I-III: 10 (20%), IV: 40 (80%) | 50 (100%) | 0 (0%) | N/A (N/A) | 20 (40%) | 32 (46%) | N/A | 12 (24%) | 1 (2%) |
| Gunn et al. [ | P | 2011-2014 | MDACC | 50 | 29 (8-49) | 61 (37-84) | 42 (84%) | 8 (16%) | 25 (50%) | 25 (50%) | N/A | 44 (88%) | 6 (12%) | 21 (42%) | 29 (58%) | N/A | T1-2: 40 (80%), T3-4: 10 (20%) | N0-1: 10 (20%), N2-3: 40 (80%) | I-III: 10 (20%), IV: 40 (80%) | 49 (98%) | 1 (2%) | 70 (60-70) | 20 (40%) | 32 (46%) | 13 (26%) | N/A | N/A |
| Sio et al. [ | R | 2012-2015 | MDACC | 35 | 7.7 (N/A) | 69.1 (N/A) | 30 (86%) | 5 (14%) | N/A | N/A | N/A | 26 (74%) | 9 (26%) | 20 (57%) | 15 (43%) | N/A | T1-2: 31 (89%), T3-4: 4 (11%) | N0-2a: 15 (42%), N2b-3: 20 (58%) | I-III: 11 (31%), IV: 24 (69%) | 35 (100%) | 0 (0%) | 70 (59-70) | 26 (74%) | 35 (100%) | 0 (0%) | N/A | N/A |
| Jensen et al. [ | R | 2010-2014 | MDACC | 50 | N/A (N/A) | N/A (N/A) | N/A | N/A | N/A | N/A | N/A | N/A | N/A | N/A | N/A | N/A | N/A | N/A | N/A | 50 (100%) | 0 (%) | N/A (N/A) | N/A | N/A | N/A | N/A | N/A |
| Zhang et al. [ | R | 2011-2014 | MDACC | 50 | 34.6 (N/A) | N/A (N/A) | 42 (84%) | 8 (16%) | N/A | N/A | N/A | 35 (70%) | 15 (30%) | 21 (42%) | 29 (58%) | N/A | T1-2: 40 (80%), T3-4: 10 (20%) | N0-1: 10 (20%), N2-3: 40 (80%) | N/A | 50 (100%) | 0 (0%) | N/A (N/A) | 20 (40%) | 32 (64%) | N/A | N/A | N/A |
| Sharma et al. [ | R | 2013-2015 | UPenn | 31 | N/A (N/A) | 60 (N/A) | 27 (87%) | 4 (13%) | N/A | N/A | N/A | N/A | N/A | 11 (36%) | 21 (64%) | N/A | T1-2: 28 (90%), T3-4: 3 (10%) | N0-2b: 31 (100%), N2c-3: 0 (0%) | I-III: 4 (13%), IV: 27 (87%) | 0 (0%) | 31 (100%) | 62.6 (N/A) | N/A | 12 (39%) | 19 (61%) | N/A | 0 (0%) |
| Aljabab et al. [ | R | 2015-2017 | UW | 46 | 19.2 (N/A) | 58 (N/A) | 43 (93%) | 3 (7%) | 15 (33%) | 31 (67%) | N/A | 41 (89%) | 5 (11%) | 19 (41%) | 27 (59%) | AJCC 7th | N/A | N/A | I-III: 5 (11%), IV: 41 (89%) | 29 (63%) | 17 (37%) | 70 (60-74.4) | 0 (0%) | 31 (67%) | 15 (33%) | 18 (39%) | 1 (2.2%) |
| Rwigema et al. [ | R | 2013-2016 | UPenn | 30 | N/A (N/A) | 58.2 (N/A) | 26 (87%) | 4 (13%) | N/A | N/A | N/A | N/A | N/A | N/A | N/A | N/A | T1-2: 25 (83%), T3-4: 5 (17%) | N0: 1 (3%), N1-3: 29 (97%) | N/A | 0 (0%) | 30 (100%) | 62.2 (N/A) | N/A | 7 (23%) | 23 (77%) | N/A | N/A |
| Bagley et al. [ | R | 2012-2016 | MDACC | 69 | N/A (N/A) | 64 (37-84) | 60 (87%) | 9 (13%) | 38 (55%) | 31 (45%) | N/A | 58 (84%) | 11 (16%) | 37 (54%) | 32 (46%) | AJCC 7th | T1-2: 54 (78%), T3-4: 15 (22%) | N0-1: 16 (19%), N2-3: 52 (81%) | I-III: 14 (20%), IV: 55 (80%) | 69 (100%) | 0 (0%) | 69.3 (60-70) | 16 (23%) | 49 (71%) | 15 (22%) | N/A | N/A |
| Grant et al. [ | R | 2012-2017 | MDACC | 71 | N/A (N/A) | 63 (37-84) | 62 (87%) | 9 (13%) | 37 (52%) | 30 (42%) | 4 (6%) | 61 (86%) | 10 (14%) | 35 (49%) | 36 (51%) | AJCC 7th | T1-2: 56 (79%), T3-4: 15 (21%) | N0-1: 15 (21%), N2-3: 56 (79%) | I-III: 13 (18%), IV: 58 (82%) | 71 (100%) | 0 (0%) | 69.3 (52.5-70.1) | 15 (21%) | 51 (72%) | 15 (21%) | N/A | N/A |
| Manzar et al. [ | R | 2013-2018 | Mayo | 46 | 12 (N/A) | 66 (40-79) | 43 (93%) | 3 (7%) | 27 (58%) | 19 (40%) | 1 (2%) | 39 (85%) | 7 (15%) | 21 (46%) | 25 (54%) | AJCC 7th | T1-2: 19 (41%), T3-4: 24 (52%) | N0-1: 10 (22%), N2-3: 35 (76%) | I-III: 7 (15%), IV: 36 (78%) | 27 (59%) | 19 (41%) | 70 (56-70) | N/A | 36 (78%) | 10 (22%) | 17 (41%) | N/A |
| Bahig et al. [ | R | 2011-2018 | MDACC | 57 | 33.6 (N/A) | 60 (41-84) | 49 (86%) | 8 (14%) | 29 (51%) | 28 (49%) | N/A | 52 (91%) | 5 (8%) | N/A | N/A | AJCC 7th | T1-2: 45 (79%), T3-4: 12 (21%) | N0-1: 11 (19%), N2-3: 46 (81%) | I-III: 9 (16%), IV: 36 (78%) | 53 (93%) | 4 (7%) | N/A (N/A) | 16 (28%) | 39 (68%) | 13 (23%) | N/A | N/A |
| Cao et al. [ | R | 2011-2015 | MDACC | 103 | 37.7 (N/A) | 60 (33-85) | 90 (87%) | 13 (13%) | N/A | N/A | N/A | 79 (77%) | 24 (23%) | 53 (52%) | 50 (48%) | N/A | T1-2: 67 (65%), T3-4: 36 (35%) | N0-1: 24 (23%), N2-3: 79 (77%) | N/A | 103 (100%) | 0 (0%) | N/A (N/A) | 30 (29%) | 79 (76%) | N/A | N/A | N/A |
| Wright et al. [ | R | 2015-2019 | UPenn | 53 | 20.4 (6-50) | 62 (47-77) | N/A | N/A | N/A | N/A | N/A | 53 (100%) | 0 (0%) | 19 (36%) | 34 (64%) | N/A | T1-2: 40 (76%), T3-4: 10 (19%) | N0-1: 43 (81%), N2-3: 10 (19%) | I-III: 53 (100%), IV: 0 (0%) | 0 (0%) | 53 (100%) | 60 (60-63) | N/A | 16 (30%) | 37 (70%) | N/A | N/A |
| Anderson et al. [ | P | 2016-2019 | Mayo | 44 | N/A (N/A) | N/A (N/A) | N/A | N/A | N/A | N/A | N/A | 44 (100%) | 0 (0%) | N/A | N/A | AJCC 7th | T1-2: 44 (100%), T3-4: 0 (0%) | N/A | N/A | 0 (0%) | 44 (100%) | N/A (N/A) | N/A | N/A | N/A | 0 (0%) | N/A |
| Youssef et al. [ | R | 2018-2021 | MSKCC | 58 | 20 (N/A) | 65.2 (N/A) | 50 (86%) | 8 (14%) | 24 (41%) | 34 (59%) | N/A | 57 (98%) | 1 (2%) | N/A | N/A | N/A | T1-2: 34 (59%), T3-4: 24 (41%) | N0-1: 13 (22%), N2-3: 45 (78%) | N/A | 58 (100%) | 0 (0%) | Primary: 70 (N/A), neck: 30 (N/A) | N/A | 55 (95%) | 3 (5%) | 4 (6.9%) | 0 (0%) |
| Pollock et al. [ | R | 2016-2021 | Maryland | 60 | 17 (N/A) | 64 (44-84) | 56 (93%) | 4 (7%) | 37 (62%) | 23 (38%) | N/A | 60 (100%) | 0 (0%) | 31 (52%) | 29 (48%) | AJCC 7th | T1-2: 38 (63%), T3-4: 22 (37%) | N0-1: 30 (50%), N2-3: 30 (50%) | N/A | 60 (100%) | 0 (0%) | 70 (56-70) | N/A | 60 (100%) | 0 (0%) | N/A | N/A |
| Singh et al. [ | R | 2013-2019 | MSKCC | 53 | N/A (N/A) | N/A (N/A) | N/A (N/A) | N/A (N/A) | N/A (N/A) | N/A (N/A) | N/A (N/A) | N/A (N/A) | N/A (N/A) | N/A | N/A | N/A | N/A | N/A | N/A | N/A | N/A | N/A | N/A | N/A | N/A | N/A | N/A |
| Author (citation) | Study type | Treatment period | Institution | Total | Median FU, months (range) | Median age, years (range) | Men | Women | Any smoking | No smoking | Unknown smoking | HPV positive | HPV negative or unknown | BOT primary | Tonsil/other primary | Tumor (T)-stage | Nodal (N)-stage | Group stage | Definitive RT | Adjuvant RT | Median RT dose, Gy (range) | Induction chemotherapy | Concurrent chemotherapy | No chemotherapy | Acute feeding tube use | Late feeding tube use |
| Blanchard et al. [ | R | 2010-2012 | MDACC | 100 | 33 (2-55) | 55.5 (34-78) | 86 (86%) | 14 (14%) | 55 (55%) | 45 (45%) | N/A | 87 (87%) | 13 (13%) | 46 (46%) | 54 (54%) | T1-2: 80 (80%), T3-4: 20 (20%) | N0-1: 20 (20%), N2-3: 80 (80%) | I-III: 20 (20%), IV: 80 (80%) | 100 (100%) | 0 (0%) | N/A (N/A) | 44 (44%) | 64 (64%) | N/A | 38 (38%) | 7 (7%) |
| Sio et al. [ | R | 2006-2014 | MDACC | 46 | 2.7 (N/A) | 57.2 (N/A) | 42 (91%) | 4 (9%) | N/A | N/A | N/A | 6 (13%) | 40 (87%) | 23 (50%) | 23 (50%) | T1-2: 28 (61%), T3-4: 17 (39%) | N0-2a: 12 (26%), N2b-3: 34 (74%) | I-III: 20 (44%), IV: 36 (56%) | 46 (100%) | 0 (0%) | 70 (58-70) | 11 (24%) | 46 (100%) | 0 (0%) | N/A | N/A |
| Jensen et al. [ | R | 2010-2014 | MDACC | 114 | N/A (N/A) | N/A (N/A) | N/A | N/A | 63 (55%) | 51 (45%) | N/A | 98 (86%) | 16 (14%) | 85 (51%) | 48 (49%) | T1-2: 86 (75%), T3-4: 28 (25%) | N0-1: 18 (16%), N2-3: 96 (84%) | N/A | 114 (100%) | 0 (%) | N/A (N/A) | 54 (47%) | 96 (84%) | N/A | N/A | N/A |
| Zhang et al. [ | R | 2011-2014 | MDACC | 534 | 33.8 (N/A) | N/A (N/A) | 462 (87%) | 72 (13%) | N/A | N/A | N/A | 364 (68%) | 170 (32%) | 260 (49%) | 274 (51%) | T1-2: 347 (65%), T3-4: 187 (35%) | N0-1: 92 (17%), N2-3: 442 (83%) | N/A | 534 (100%) | 0 (0%) | N/A (N/A) | 217 (41%) | 360 (67%) | N/A | N/A | N/A |
| Sharma et al. [ | R | 2013-2015 | UPenn | 33 | N/A (N/A) | 58 (N/A) | 27 (82%) | 6 (18%) | N/A | N/A | N/A | N/A | N/A | 13 (39%) | 20 (61%) | T1-2: 32 (97%), T3-4: 1 (3%) | N0-2b: 30 (91%), N2c-3: 3 (9%) | I-III: 5 (15%), IV: 28 (85%) | 0 (0%) | 33 (100%) | 61.7 (N/A) | N/A | 14 (42%) | 19 (58%) | N/A | 0 (0%) |
| Rwigema et al. [ | R | 2013-2016 | UPenn | 175 | N/A (N/A) | 60.1 (N/A) | 112 (64%) | 63 (36%) | N/A | N/A | N/A | N/A | N/A | N/A | N/A | T1-2: 85 (49%), T3-4: 90 (51%) | N0: 40 (23%), N1-3: 135 (77%) | N/A | 175 (100%) | 0 (0%) | 69.8 (N/A) | N/A | 101 (58%) | 74 (42%) | N/A | N/A |
| Manzar et al. [ | R | 2013-2018 | Mayo | 259 | 30 (N/A) | 61 (42-88) | 224 (86%) | 35 (14%) | 93 (36%) | 165 (63%) | 1 (1%) | 219 (85%) | 40 (15%) | 125 (48%) | 134 (52%) | T1-2: 152 (59%), T3-4: 102 (39%) | N0-1: 37 (14%), N2-3: 222 (86%) | I-III: 26 (10%), IV: 232 (90%) | 111 (43%) | 148 (57%) | 70 (56-70) | N/A | 173 (67%) | 86 (33%) | 155 (60.3%) | N/A |
| Cao et al. [ | R | 2011-2015 | MDACC | 429 | 35.8 (N/A) | 59 (32-84) | 368 (86%) | 61 (14%) | N/A | N/A | N/A | 295 (69%) | 134 (31%) | 203 (47%) | 223 (53%) | T1-2: 292 (68%), T3-4: 137 (32%) | N0-1: 76 (18%), N2-3: 353 (82%) | N/A | 429 (100%) | 0 (0%) | N/A (N/A) | 158 (37%) | 289 (67%) | N/A | N/A | N/A |
| Anderson et al. [ | P | 2016-2019 | Mayo | 17 | N/A (N/A) | N/A (N/A) | N/A | N/A | N/A | N/A | N/A | 16 (100%) | 0 (0%) | N/A | N/A | T1-2: 16 (100%), T3-4: 0 (0%) | N/A | N/A | 0 (0%) | 16 (100%) | 60 (54-63) | N/A | N/A | N/A | 2 (11.8%) | N/A |
| Youssef et al. [ | R | 2018-2021 | MSKCC | 234 | 26 (N/A) | 64.1 (N/A) | 204 (87%) | 31 (13%) | 117 (50%) | 117 (50%) | N/A | 215 (92%) | 19 (8%) | N/A | N/A | T1-2: 157 (67%), T3-4: 77 (33%) | N0-1: 53 (23%), N2-3: 181 (77%) | N/A | 234 (100%) | 0 (0%) | N/A (N/A) | N/A | 228 (97%) | 5 (3%) | 29 (12.4%) | 4 (1.6%) |
| Author (citation) | Study type | Clearly stated aim | Inclusion of consecutive patients | Prospective data collection | Endpoints appropriate of study | Unbiased assessment of study endpoint | Follow-up period appropriate to study aim | Loss to follow-up does not exceed the proportion experiencing the major endpoint | An adequate control group | Contemporary groups | Baseline equivalence of groups | Adequate statistical analysis | Total score |
| Blanchard et al. [ | R | 2 | 2 | N/A | 2 | 1 | 2 | 2 | 2 | 2 | 2 | 2 | 19 |
| Gunn et al. [ | P | 2 | 2 | 2 | 2 | 1 | 2 | 2 | N/A | N/A | N/A | 2 | 15 |
| Sio et al. [ | R | 2 | 2 | N/A | 2 | 1 | 2 | 2 | 2 | 2 | 2 | 2 | 19 |
| Jensen et al. [ | R | 2 | 2 | N/A | 2 | 2 | 2 | 2 | 2 | 2 | 2 | 2 | 20 |
| Zhang et al. [ | R | 2 | 2 | N/A | 2 | 1 | 1 | 2 | 2 | 2 | 2 | 2 | 18 |
| Sharma et al. [ | R | 2 | 2 | N/A | 2 | 1 | 2 | 2 | 2 | 2 | 2 | 2 | 19 |
| Aljabab et al. [ | R | 2 | 2 | N/A | 2 | 1 | 2 | 2 | N/A | N/A | N/A | 2 | 13 |
| Rwigema et al. [ | R | 2 | 2 | N/A | 2 | 1 | 2 | 2 | 2 | 1 | 1 | 2 | 17 |
| Bagley et al. [ | R | 2 | 2 | N/A | 2 | 1 | 2 | 2 | N/A | N/A | N/A | 2 | 13 |
| Grant et al. [ | R | 2 | 2 | N/A | 2 | 1 | 2 | 2 | N/A | N/A | N/A | 2 | 13 |
| Manzar et al. [ | R | 2 | 2 | N/A | 2 | 1 | 2 | 2 | 2 | 2 | 2 | 2 | 19 |
| Bahig et al. [ | R | 2 | 2 | N/A | 2 | 1 | 2 | 2 | N/A | N/A | N/A | 2 | 13 |
| Cao et al. [ | R | 2 | 2 | N/A | 2 | 1 | 2 | 2 | N/A | N/A | N/A | 2 | 13 |
| Wright et al. [ | R | 2 | 2 | N/A | 2 | 1 | 2 | 2 | N/A | N/A | N/A | 2 | 13 |
| Anderson et al. [ | P | 2 | 2 | 2 | 2 | 1 | 2 | 2 | 2 | 2 | 0 | 2 | 19 |
| Youssef et al. [ | R | 2 | 2 | N/A | 2 | 1 | 2 | 2 | 2 | 2 | 2 | 2 | 19 |
| Pollock et al. [ | R | 2 | 2 | N/A | 2 | 1 | 2 | 2 | N/A | N/A | N/A | 2 | 13 |
| Singh et al. [ | R | 2 | 2 | N/A | 2 | 1 | 2 | 2 | N/A | N/A | N/A | 2 | 13 |
| Adverse event | CTCAE grade | Total patients | Pooled rate (95% confidence interval) |
| Dermatitis | 2+ | 197 | 62.4% (32.0 to 92.7%) |
| 3+ | 258 | 18.6% (-12.8 to 56.9%) | |
| Mucositis | 3+ | 255 | 31.7% (5.3 to 58.1%) |
| Xerostomia | 2+ | 214 | 12.8% (6.9 to 18.6%) |
| 3+ | 214 | 1.3% (-0.2 to 2.3%) | |
| Dysphagia | 3+ | 209 | 12.8% (5.4 to 20.2%) |
| Dysgeusia | 2 | 214 | 30.0% (15.8 to 44.1%) |
| Weight loss | 2 | 214 | 17.9% (2.3 to 33.5%) |
| 3 | 214 | 1.4% (-0.2 to 3.0%) | |
| Pain | 2+ | 159 | 38.0% (-1.9 to 77.9%) |
| Fatigue | 2+ | 151 | 33.6% (15.3 to 51.8%) |
| Nausea | 3 | 162 | 1.1% (-0.5 to 2.7%) |
| Hospitalization (within 30 days) | N/A | 137 | 10.4% (1.7 to 19.1%) |
| Feeding tube use | 239 | 21.4% (5.3 to 37.6%) |
| Author (citation) | Toxicity scale | Total | Dermatitis | Mucositis | Xerostomia | Dysphagia | Pain | Fatigue | Nausea | Weight loss | Dysgeusia | Hospitalization (within 30 days) | |||
| Grade 2+ | Grade 3+ | Grade 3+ | Grade 2+ | Grade 3+ | Grade 3+ | Grade 2+ | Grade 2+ | Grade 3+ | Grade 2 | Grade 3 | Grade 2 | ||||
| Gunn et al. [ | CTCAE v.4 | 50 | 21 (42%) | 0 (0%) | 29 (58%) | 4 (8%) | 1 (2%) | 12 (24%) | N/A | 20 (40%) | N/A | 4 (8%) | 1 (2%) | 24 (48%) | 10 (20%) |
| Aljabab et al. [ | CTCAE v.4 | 46 | 43 (93%) | 35 (75%) | 33 (71%) | 4 (9%) | 3 (7%) | N/A | N/A | N/A | N/A | 1 (2%) | 0 (0%) | 6 (13%) | 2 (4%) |
| Manzar et al. [ | CTCAE v.4 | 41 | 34 (83%) | N/A | 5 (12%) | N/A | N/A | 7 (17%) | 1 (2%) | 19 (46%) | N/A | N/A | N/A | N/A | 4 (9%) |
| Anderson et al. [ | CTCAE v.4 | 44 | N/A | 4 (9%) | N/A | N/A | N/A | N/A | N/A | N/A | 0 (0%) | N/A | N/A | N/A | N/A |
| Youssef et al. [ | CTCAE v.4-5 | 58 | N/A | 2 (3%) | 6 (10%) | 12 (20%) | 0 (0%) | 4 (7%) | 42 (72%) | N/A | 0 (0%) | 19 (32%) | 3 (5%) | 16 (28%) | N/A |
| Pollock et al. [ | CTCAE v. 5 | 60 | 18 (30%) | 3 (5%) | 5 (8%) | 10 (17%) | 0 (0%) | 5 (8%) | 24 (40%) | 10 (17%) | 1 (2%) | 19 (32%) | 0 (0%) | 20 (33%) | N/A |
| Adverse event | CTCAE grade | Total patients | Pooled rate (95% confidence interval) |
| Xerostomia | 2 | 234 | 18.1% (0.2 to 36.1%) |
| 3 | 234 | 1.1% (-0.2 to 2.5%) | |
| Dysphagia | 2+ | 179 | 11.8% (-3.7 to 27.4%) |
| 3+ | 234 | 1.6% (0.0 to 3.1%) | |
| Dysgeusia | 1-2 | 211 | 57.1% (31.7 to 82.5%) |
| Feeding tube use | N/A | 185 | 1.4% (-0.3 to 3.0%) |
| Author (citation) | Toxicity scale | Total | Xerostomia | Dysphagia | Dysgeusia | Osteoradionecrosis | ||
| Grade 2 | Grade 3 | Grade 2+ | Grade 3+ | Grade 1-2 | Grade 1+ | |||
| Gunn et al. [ | CTCAE v.4 | 50 | 25 (50%) | 1 (2%) | 19 (38%) | 6 (12%) | 38 (76%) | 1 (2%) |
| Zhang et al. [ | CTCAE v.4 | 50 | N/A | N/A | N/A | N/A | N/A | 1 (2%) |
| Aljabab et al. [ | CTCAE v.4 | 46 | 14 (30%) | 0 (0%) | 2 (4.3%) | 1 (2.2%) | 38 (83%) | N/A |
| Rwigema et al. [ | CTCAE v.4 | 30 | 0 (0%) | 0 (0%) | 2 (6.7%) | 1 (3.3%) | N/A | N/A |
| Youssef et al. [ | CTCAE v.4-5 | 55 | 6 (11%) | 0 (0%) | N/A | 0 (0%) | 18 (33%) | 1 (2%) |
| Pollock et al. [ | CTCAE v.5 | 53 | 1 (2%) | 0 (0%) | 1 (2%) | 0 (0%) | 22 (42%) | N/A |
| Singh et al. [ | Glanzmann and Gratz | 53 | N/A | N/A | N/A | N/A | N/A | 5 (9.4%) |
| Survival outcome | Time post-PRT | Total patients | Pooled estimate (95% confidence interval) |
| Overall survival | 2 years | 210 | 98.2% (96.4 to 100%) |
| 3 years | 169 | 96.1% (93.2 to 99%) | |
| Locoregional control | 2 years | 218 | 97.5% (95.4 to 99.6%) |
| 3 years | 169 | 95.9% (92.9 to 98.9%) | |
| Progression-free survival | 2 years | 210 | 92.7% (89.3 to 96.2%) |
| 3 years | 169 | 86.1% (80.9 to 91.3%) | |
| Crude locoregional failures | N/A | 276 | 2.1% (0.4 to 3.8%) |
| Crude distant failures | 233 | 5.9% (2.8 to 9.0%) |
| Author (citation) | Total | Overall survival | Progression-free survival | Locoregional control | Crude failures | ||||
| 2 years | 3 years | 2 years | 3 years | 2 years | 3 years | Locoregional | Distant | ||
| Gunn et al. [ | 50 | 94.5% | N/A | 88.6% | N/A | N/A | N/A | N/A | N/A |
| Blanchard et al. [ | 50 | N/A | 94.3% | N/A | 86.4% | N/A | 91% | N/A | N/A |
| Aljabab et al. [ | 46 | 95.7% | N/A | 93.5% | N/A | 100% | N/A | 0 (0%) | 2 (4.3%) |
| Bahig et al. [ | 56 | N/A | N/A | N/A | N/A | N/A | N/A | 5 (8.9%) | 4 (7.1%) |
| Wright et al. [ | 53 | 98% | N/A | 90.3% | N/A | 97% | N/A | 1 (1.9%) | N/A |
| Anderson et al. [ | 61 | 100% | 97% | 95% | 88% | N/A | 97% | 1 (1.6%) | 3 (4.9%) |
| Youssef et al. [ | 58 | N/A | 97% | N/A | 82% | 95% | 96% | N/A | N/A |
| Pollock et al. [ | 60 | N/A | N/A | N/A | N/A | N/A | N/A | 1 (1.6%) | 5 (8.3%) |
| Author (citation) | Institution | No. of patients | PRT-IMRT comparison | PRO scale | Domains with data | Quantitative data | Timing of PRO collection (months) | |||||||||
| Baseline | During RT | End of RT | 2.5-3 | 6 | 9 | 12 | 18 | 24 | 36 | |||||||
| Sio et al. [ | MDACC | PRT: 35; IMRT: 46 | Yes | MDASI-HN | Food taste, dry mouth, swallowing/chewing, fatigue, pain, appetite, mucus, sleep, mouth sores, drowsiness, distress | Mean (SD) | x | x | - | x | x | - | ||||
| Sharma et al. [ | UPenn | PRT: 31; IMRT: 33 | Yes | EORTC QLQ-HN35, GRIX | EORTC: general health domain, physical and role function, overall xerostomia, dental issues, head and neck pain, fatigue, sticky saliva; GRIX: day/night xerostomia, sticky saliva day | Mean | x | - | - | x | x | - | x | - | - | - |
| Bagley et al. [ | MDACC | PRT: 69; IMRT: N/A | No | XeQoLS | Global, physical, personal, pain, social | Mean (SD), IQR | x | x | - | x | x | - | x | - | x | - |
| Grant et al. [ | MDACC | PRT: 71; IMRT: N/A | No | MDADI | Global, composite, emotional, functional, physical | Mean (SD), median | x | x | - | x | x | - | x | - | x | - |
| Manzar et al. [ | Mayo | PRT: 46; IMRT: 259 | Yes | EORTC QLQ-HN35 | Cough, sense of smell/taste, problems with teeth, dry mouth, nutritional supplements, sexual symptoms, feeling ill, feeding tube, swallowing, pain, dry mouth, sticky saliva, weight loss | Mean difference | x | - | x | - | - | - | - | - | - | - |
| Bahig et al. [ | MDACC | PRT: 57; IMRT: N/A | No | FACT-HN | General, total, trial outcome index, physical well-being, social/family well-being, emotional well-being, functional well-being, head and neck cancer concerns | Mean (SD) | x | x | - | x | x | - | x | - | x | - |
| Cao et al. [ | MDACC | PRT: 103; IMRT: 429 | Yes | XQ | N/A | Mean (SD), % XQ ≥ 50 | - | - | - | x | x | x | x | x | x | x |
| Anderson et al. [ | Mayo | PRT: 44; IMRT: 17 | No | EORTC QLQ-HN35, PROMIS10 | EORTC: pain, swallowing, problems with senses, speech problems, trouble with social eating, trouble with social contact, less sexuality, teeth, opening mouth, dry mouth, sticky saliva, coughing, felt ill, pain killers, nutritional supplements, feeding tube, weight loss, weight gain; PROMIS10: overall, physical, mental | Mean (SD), range | x | - | - | x | - | - | x | - | - | x |
| Author (citation) | Institution | Total patients | PRO instrument | PROs | ||||||||
| During RT | End of RT | 2.5-3 months | 6 months | 9 months | 12 months | 18 months | 24 months | 36 months | ||||
| Sio et al. [ | MDACC | PRT: 35; IMRT: 46 | MDASI-HN | No difference in the composite of subdomains between IMRT and PRT | - | PRT improved the composite of top 5 subdomains; PRT with improved food taste and appetite subdomains | No difference in the composite of subdomains between IMRT and PRT; PRT improved appetite subdomain | - | ||||
| Sharma et al. [ | UPenn | PRT: 31; IMRT: 33 | EORTC QLQ-HN35, GRIX | - | - | PRT improved dental problems subdomain | PRT improved moderate-severe dry mouth, xerostomia day, xerostomia night, sticky saliva day, dental problems, physical function, role function subdomains | - | PRT improved pain, moderate-severe dry mouth, xerostomia day, role function subdomains | - | - | - |
| Manzar et al. [ | Mayo | PRT: 46; IMRT: 259 | EORTC QLQ-HN35 | - | PRT improved cough, sense of smell/taste, nutritional supplements subdomains | - | - | - | - | - | - | - |
| Cao et al. [ | MDACC | PRT: 103; IMRT: 429 | XQ | - | - | No difference in xerostomia between IMRT and PRT | PRT improved xerostomia | |||||
| Outcome | PRT (this study) | RTOG-1016 [ | NRG-HN002 [ | |||
| IMRT + cisplatin | IMRT + cetuximab | IMRT + cisplatin | IMRT | |||
| Acute toxicity | Dysphagia (grade 3+) | 12.8% | 37.4% | 32% | 17.8% | 7.5% |
| Mucositis (grade 3+) | 31.7% | 41.5% | 46.2% | 21.1% | 21.1% | |
| Weight loss (grade 3) | 1.4% | 7.8% | 5.8% | 5.9% | 3.4% | |
| Xerostomia (grade 2+) | 12.8% | 49.7% | 53.6% | 51.3% | 45.6% | |
| Dermatitis (grade 3+) | 18.6% | 8% | 12.4% | 2.6% | 5.4% | |
| Late toxicity | Xerostomia (grade 2-3) | 19.2% | 32.1% | 33.6% | 26% | 19.4% |
| Dysphagia (grade 3+) | 1.6% | 4.4% | 6.1% | N/A | N/A | |
| Oncologic outcomes | Overall survival | 2 yr: 98.2%; 3 yr: 96.1% | 5 yr: 84.6% | 5 yr: 77.9% | 2 yr: 96.7% | 2 yr: 97.3% |
| Progression-free survival | 2 yr: 92.7%; 3 yr: 86.1% | 5 yr: 78.4% | 5 yr: 67.3% | 2 yr: 90.5% | 2 yr: 87.6% | |
| Locoregional failure | Crude: 2.1% | Crude: 5.7% | Crude: 11.7% | 2 yr: 3.3% | 2 yr: 9.5% | |
| Distant failure | Crude: 5.9% | Crude: 7.6% | Crude: 10.7% | 2 yr: 4% | 2 yr: 2.1% | |
Peer Reviews
No public reviews on file for this paper yet. If you reviewed it on a platform where reviews are public (OpenReview, ICLR, NeurIPS, ICML), you can paste yours below so the community can read it here.
Videos
No videos yet. Explain this paper in a talk, walkthrough, or lecture? Add one.
Taxonomy
TopicsHead and Neck Cancer Studies · Lung Cancer Diagnosis and Treatment · Advanced Radiotherapy Techniques
Introduction and background
Proton radiotherapy (PRT) is an emerging treatment modality for patients with oropharyngeal cancer (OPC) [1,2]. Compared to intensity-modulated radiotherapy (IMRT), PRT has distinct physical properties that allow for more conformal dose distributions and lower doses to surrounding normal tissues [1,3]. While PRT is purported to improve the side effect profile associated with radiotherapy (RT) for OPC, data are primarily limited to single-institution series [4,5], its potential for increased biologic effectiveness may increase the risk of late toxicity [6], and randomized, comparative trials with IMRT are ongoing [7,8]. Given the potential increases in cost and resource utilization [8-10], a clearer understanding of outcomes associated with PRT would strongly inform clinical practice and future resource allocation.
We performed a systematic review and meta-analysis to better understand the safety and efficacy of PRT for patients with OPCs. The primary objective of this study was to determine the rates of toxicity and oncologic outcomes after PRT. Additionally, patient-reported outcomes (PROs), patterns of failure, and comparisons between PRT and IMRT were assessed. An improved understanding of PRT will allow for more comprehensive discussions in an area where the optimal balance of risk and benefit is unclear.
Review
Methods
Search Strategy
A systematic literature review was performed following the Preferred Reporting Items for Systematic Reviews and Meta-Analyses (PRISMA) guidelines [11]. Review and analysis were designed prospectively and registered with the International Prospective Register of Systematic Reviews (PROSPERO) (CRD42023444520).
Four electronic databases (PubMed, Embase, Web of Science, and Cochrane Library) were queried for published articles from 01/01/1980 to 05/01/2024. Searches were performed on 05/01/24.
The following search terms were used to query each database: ("Tonsil" OR "tonsillar" OR "tonsils" OR "oropharynx" OR "oropharyngeal" or "base of tongue" or “BOT” or “soft palate”) AND ("Neoplasm" OR "neoplasms" OR "carcinoma" OR "carcinomas" OR "Cancer" OR "Cancers") AND ("radiotherapy" OR "Radiotherapies" OR "Radiation Therapy" OR "Targeted Radiation Therapies" OR "radiation" OR "RT" OR "irradiation" OR "IMRT") AND ("proton" OR "protons" OR "IMPT" OR "PBS" OR "intensity-modulated proton therapy" OR "intensity modulated proton therapy" OR "pencil beam scanning" OR "passive scattering").
After removing duplicate publications, titles and abstracts were screened by at least two reviewers. In the case of discordance, a third reviewer was added, and inclusion was determined by consensus opinion. Articles were included for analysis if they contained at least 10 patients with OPCs treated with PRT in the upfront setting and reported oncologic outcomes (progression-free survival (PFS) or overall survival (OS)), clinician-rated toxicity outcomes, or PROs. Studies that used IMRT alone, IMRT combined with PRT, or PRT for re-irradiation were excluded.
Full Inclusion and Exclusion Criteria (Population, Intervention, Comparator, Outcomes, Timing, and Setting (PICOTS) Format)
Population: Included peer-reviewed studies treated 10 or more patients with squamous cell carcinoma of the oropharynx (e.g., tonsil, base of tongue). Patients of all genders, race, socioeconomic status, and comorbidities were eligible for inclusion. Studies treating patients with other head and neck tumor sites (e.g., oral cavity, larynx) were excluded.
Intervention: Included studies treated patients with PRT in the upfront setting. Studies that used only IMRT, PRT as a boost to IMRT, and PRT in the setting of re-irradiation or re-treatment were excluded.
Comparator: This study was designed to describe oncologic outcomes and adverse events associated with PRT; thus, no control group was specified for the primary endpoint. However, for studies that reported outcomes of IMRT, this was considered the comparator treatment for secondary analysis (see below).
Outcomes: The primary outcome was the pooled rates of adverse events (both acute and late), OS, and PFS after PRT. Secondary outcomes included PRO measures and a comparison of outcomes between PRT and IMRT. Pooled rates were estimated using a random-effects model.
Timing: Included studies treated patients with radiation in either a definitive or adjuvant (post-operative) manner. Patient follow-up was performed per the institutional standard of care.
Setting: Included studies consisted of patients treated by radiation oncologists, which is generally delivered in the outpatient setting.
Statistical Methods
Primary outcomes were the pooled rates of acute or late clinician-rated toxicities, OS, and PFS following PRT. Secondary outcomes included PROs and comparisons of outcomes between PRT and IMRT. Pooled rates were estimated using a random-effects model for outcomes reported in three or more studies. To reduce confounding, if studies had overlapping patient populations, pooled analysis of a given outcome was performed using only the study with the larger population. Heterogeneity among the studies was assessed using the Higgins I2 test. If heterogeneity was moderate or high (I2 > 50%), outlier studies were identified using Cook's distance and removed, and then pooled rates were re-estimated using random-effects models. Differences in rates of outcomes between PRT and IMRT were assessed using a random-effects meta-analysis comparing log odds ratios (ORs) across studies. For this analysis, only studies that reported patients treated with PRT or IMRT were included. The quality of studies included for statistical analysis was quantified using the Methodological Index for Non-randomized Studies (MINORS) criteria [12], and publication bias was assessed using Egger's test for funnel plot asymmetry. Statistical significance was defined as P < 0.05. All tests were performed using the "metafor" package (Version 4.6-0) in R version 4.4.1 (R Foundation for Statistical Computing, Vienna, Austria (https://www.R-project.org/)).
Results
Characteristics of the Included Studies
After removing duplicate citations, 627 abstracts were screened, and 18 articles (956 patients) underwent full-text review and analysis (Figure 1) [4,5,13-26]. Baseline characteristics, treatments, and outcomes from the included studies are summarized in Table 1 and Table 2. Published from 2016 to 2023, most studies (16 of 18) were retrospective and had a median follow-up ranging from 7.7 to 40.6 months. The median study quality was 16 (Table 3) and publication bias was not identified. All studies used pencil beam scanning PRT, and eight studies reported a separate population of patients treated with IMRT. Among patients receiving PRT, treatment was delivered in either the definitive (14 studies) or post-operative (eight studies) setting. The median age ranged from 55.5 to 69.1 years old. The American Joint Committee on Cancer (AJCC) 7th Edition was the most frequently employed staging system: in 15 studies, the majority of patients had T1-2, N2-3, and stage IV disease. Among the 14 studies reporting human papillomavirus (HPV) status, 70-100% of patients had HPV-associated disease. Use of concurrent chemotherapy ranged from 23% to 100% (15 studies).
PRISMA diagramPRISMA: Preferred Reporting Items for Systematic Reviews and Meta-Analyses; RT: radiotherapy
Acute and Late Toxicities Following PRT
Toxicity outcomes were reported in 13 studies [4-6,13,15-19,21,22,26,27] consisting of 356 patients. The majority of patients were men (90%) with HPV-associated disease (93%) who received treatment in the definitive setting (68%). Per AJCC 7th Edition, 72% of patients had T1-2 disease and 71% had N2-3; the most common primary tumor site was tonsil (54%). Among all studies, toxicities were graded by clinicians using the Common Terminology Criteria for Adverse Events (CTCAE) Version 4 or 5.
Acute toxicities reported in at least three studies are summarized in Table 4 and Table 5. These included dermatitis, mucositis, xerostomia, dysphagia, weight loss, dysgeusia, nausea, pain, fatigue, and feeding tube use. To reduce confounding, if studies contained overlapping patient populations, only the larger study was included for statistical analysis. Rates of grade 2 or more (n = 197) and grade 3 or more (n = 258) dermatitis were 62.4% (95% confidence interval (CI): 32.0 to 92.7%; I2 = 96.9%) and 18.6% (95% CI: -9.1 to 46.2%; I2 = 99.3%), respectively (Figure 2). The rate of grade 3 or more mucositis (n = 255) was 31.7% (95% CI: 5.3 to 58.1%; I2 = 97.3%; Figure 3). Acute xerostomia of grade 2 or more (n = 214) and grade 3 or more (n = 214) were estimated to be 12.8% (95% CI: 6.9 to 18.6%; I2 = 43.4%) and 1.3% (95% CI: -0.2 to 2.3%; I2 = 2.3%), respectively (Figure 4). The pooled rate of grade 3 or more dysphagia (n = 209) was 12.8% (95% CI: 5.4 to 20.2%; I2 = 65%; Figure 5A), while the rate of grade 2 dysgeusia (n = 214) was 30.0% (95% CI: 15.8 to 44.1%; I2 = 83.1%; Figure 5B). Weight loss was grade 2 (n = 214) and grade 3 (n = 214) in 17.9% (95% CI: 2.3 to 33.5%; I2 = 93.3%) and 1.4% (95% CI: -0.2 to 3.0%; I2 = 0.4%), respectively (Figure 6). Acute pain (grade 2 or more; n = 159), fatigue (grade 2 or more; n = 151), and nausea (grade 3; n = 162) were 38.0% (95% CI: -1.9 to 77.9%; I2 = 98.2%; Figure 7A), 33.6% (95% CI: 15.3 to 51.8%; I2 = 84%; Figure 7B), and 1.1% (95% CI: -0.5 to 2.7%; I2 = 0.0%; Figure 7C), respectively. The pooled rate of hospitalization during or within 30 days of PRT (n = 137) was 10.4% (95% CI: 1.7 to 19.1%; I2 = 67.9%; Figure 8).
Pooled rates of acute dermatitis after PRTPooled estimates of acute (A) grade 2 or more and (B) grade 3 or more dermatitis after PRT. Given heterogeneity (I2 > 50%), rates were re-estimated after the removal of outlier studies, which were identified using Cook's distance (C-D).PRT: proton radiotherapy
Pooled rates of acute mucositis after PRTPooled estimates of acute (A) grade 3 or more mucositis after PRT. Given heterogeneity (I2 > 50%), rates were re-estimated after the removal of outlier studies, which were identified using Cook's distance (B).PRT: proton radiotherapy
Pooled rates of acute xerostomia after PRTPooled estimates of acute (A) grade 2 or more and (B) grade 3 or more xerostomia after PRT.PRT: proton radiotherapy
Pooled rates of acute dysphagia and dysgeusia after PRTPooled estimates of acute (A) grade 3 or more dysphagia and (B) grade 2 or more dysgeusia after PRT. Given heterogeneity (I2 > 50%), rates were re-estimated after the removal of outlier studies, which were identified using Cook's distance (C-D).PRT: proton radiotherapy
Pooled rates of acute weight loss after PRTPooled estimates of acute (A) grade 2 and (B) grade 3 weight loss after PRT. Given heterogeneity (I2 > 50%), rates of (C) grade 2 weight loss were re-estimated after the removal of outlier studies, which were identified using Cook's distance.PRT: proton radiotherapy
Pooled rates of acute pain, fatigue, and nausea after PRTPooled estimates of late (A) grade 2 or more pain, (B) grade 2 or more fatigue, and (C) grade 3 nausea after PRT. Given heterogeneity (I2 > 50%), rates of (D) grade 2 or more pain and (E) grade 2 or more fatigue were re-estimated after the removal of outlier studies, which were identified using Cook's distance.PRT: proton radiotherapy
Pooled rates of acute hospitalization after PRTPooled estimates of (A) acute hospitalization (within 30 days) after PRT. Given heterogeneity (I2 > 50%), rates were re-estimated after the removal of outlier studies, which were identified using Cook's distance (B).PRT: proton radiotherapy
Among all the reported toxicities, feeding tube use was the only acute toxicity reported in at least three studies that included patients treated with PRT or IMRT. Following IMRT (n = 608), the pooled rate of feeding tube use was 31.0% (95% CI: 8.0 to 54.0%; I2 = 97.5%), while after PRT (n = 239), it was 21.4% (95% CI: 5.3 to 37.6%; I2 = 95.0%). Compared to IMRT, PRT was associated with a significantly lower feeding tube use (log OR: -0.749; 95% CI: -1.201 to -0.297; I2 = 0%; P = 0.0012; Figure 9), corresponding to a 2.12-fold lower odds of feeding tube use in the acute setting (absolute difference 10%).
Comparison of acute feeding tube use after PRT and IMRTRatios less than 0 indicate lower odds of feeding tube use in patients treated with PRT.PRT: proton radiotherapy; IMRT: intensity-modulated radiotherapy
Late toxicities after PRT reported in at least three studies were xerostomia, dysphagia, dysgeusia, and feeding tube use (Table 6 and Table 7). Grade 2 (n = 234) and 3 (n = 234) xerostomia were estimated to be 18.1% (95% CI: 0.2 to 36.1%; I2 = 97.3%) and 1.1% (95% CI: -0.2 to 2.5%; I2 = 0%), respectively (Figure 10). Dysphagia of grades 2 or more (n = 179) and 3 or more (n = 234) were 11.8% (95% CI: -3.7 to 27.4%; I2 = 95.2%) and 1.6% (95% CI: 0.0 to 3.1%; I2 = 0.4%), respectively (Figure 11A-11B). The pooled rate of late grade 1-2 dysgeusia (n = 211) was 57.1% (95% CI: 31.7 to 82.5%; I2 = 94.6%; Figure 11C). Osteoradionecrosis (ORN) was reported among four studies [4,6,16,26]: while crude rates of ORN ranged from 0% to 9.4%, the pooled analysis could not be completed due to overlapping patient populations. Among late toxicities, only feeding tube use was reported in at least three studies that included patients treated with PRT or IMRT. At six months or more after RT, the pooled rates of late feeding tube use associated with PRT (n = 185; 1.4% (95% CI: -0.3 to 3.0; I2 = 0%)) and IMRT (n = 367; 2.7% (95% CI: 0 to 5.4%; I2 = 48.5%)) were not significantly different (log OR: -0.949 (95% CI: -2.526 to 0.629); I2 = 0%; P = 0.239; Figure 12).
Pooled rates of late xerostomia after PRTPooled estimates of late (A) grade 2 and (B) grade 3 xerostomia after PRT. Given heterogeneity (I2 > 50%), rates of grade 2 xerostomia were re-estimated after the removal of outlier studies, which were identified using Cook's distance (C).PRT: proton radiotherapy
Pooled rates of late dysphagia and dysgeusia after PRTPooled estimates of late (A) grade 2 or more dysphagia, (B) grade 3 or more dysphagia, and (C) grade 1-2 dysgeusia after PRT. Given heterogeneity (I2 > 50%), rates of (D) grade 2 or more dysphagia and (E) grade 1-2 dysgeusia were re-estimated after the removal of outlier studies, which were identified using Cook's distance.PRT: proton radiotherapy
Comparison of late feeding tube use after PRT and IMRTRatios less than 0 indicate lower odds of feeding tube use in patients treated with PRT.PRT: proton radiotherapy; IMRT: intensity-modulated radiotherapy
Oncologic Outcomes Associated With PRT
Table 8 and Table 9 summarize the oncologic outcomes and patterns of failure associated with PRT. Actuarial outcomes were reported in eight studies (314 patients) [4,5,13,15,18,22,25,26]. Following PRT, estimated OS at two years (n = 210) and three years (n = 169) was high (Figure 13A-13B): 98.2% (95% CI: 96.4 to 100%; I2 = 3.8%) and 96.1% (95% CI: 93.2 to 99%; I2 = 0%), respectively. Similarly, locoregional control at two years (n = 218) was 97.5% (95% CI: 95.4 to 99.6%; I2 = 0%) and at three years (n = 169) was 95.9% (95% CI: 92.9 to 98.9%; I2 = 0%; Figure 13C-13D). After proton beam therapy (PBT), pooled PFS at two years (n = 210) was 92.7% (95% CI: 89.3 to 96.2%; I2 = 0%) and at three years (n = 169) was 86.1% (95% CI: 80.9 to 91.3%; I2 = 0%; Figure 13E-13F).
Pooled oncologic outcomes after PRTPooled estimates of actuarial two- and three-year (A-B) overall survival, (C-D) locoregional control, and (E-F) progression-free survival after PRT.PRT: proton radiotherapy
Crude patterns of failure were reported in five studies (276 patients) [5,18,23,25,27]. Distant failures (n = 223) were most frequent (5.9%; 95% CI: 2.8 to 9.0%; I2 = 0.0%), followed by locoregional failures (n = 276 (2.1%); 95% CI: 0.4 to 3.8; I2 = 0.3%).
PROs Following PRT
PRO analysis was performed in eight studies [5,14,17,20-24] consisting of 456 and 784 patients treated with PRT and IMRT, respectively (Table 10). PROs were measured using eight instruments [28-34] and collected across multiple timepoints (Table 10). Only the QLQ-HN35 [30] instrument was reported in more than one study [5,17,22]. However, a pooled quantitative analysis could not be performed because data were collected at different timepoints after RT.
Qualitatively, there were notable trends in PROs with PRT. Among the three studies [20,21,23] that reported PRO changes over time, symptom severity was worst at week 6 during PRT, while changes plateaued between 12 and 24 months post-PRT. Comparisons in PROs between patients treated with either PRT or IMRT were reported in four studies [14,17,22,24], each using a different instrument assessment timepoint (Table 10). Compared to IMRT, these studies found that PRT was associated with improvement in multiple symptoms: xerostomia, dry mouth, taste, appetite, dental problems, sense of smell, use of nutritional supplements, and physical/role function (Table 11). However, most symptoms were improved at only one timepoint post-RT. The symptoms associated with improved PROs in multiple studies and timepoints were xerostomia and dry mouth (Table 11).
Discussion
PRT is an attractive treatment modality for patients with OPCs. Given that the majority of OPCs are HPV-related and long-term survival is high in these patients [28], the reduced doses to surrounding normal tissues afforded by PRT [1,3] could translate into lower toxicity rates and improved quality of life. PRT, however, is not without costs. It is an advanced RT modality that requires specialized equipment, facilities, personnel, and experience [29]. While the number of proton facilities is increasing [30,31], travel to these centers poses a barrier to access [32]. Moreover, the cost-effectiveness of PRT compared to IMRT is widely debated [9,33,34]. While awaiting final results from randomized controlled trials comparing PRT to IMRT [8,35,36], additional data are needed to inform patient and provider decisions regarding the use of PRT in the upfront management of OPCs.
In this study, oncologic outcomes associated with PRT appear to be similar to those reported in prospective studies of IMRT (Table 12). For example, in RTOG-1016, IMRT with concurrent cisplatin for patients with locally advanced HPV-associated OPC resulted in five-year OS and PFS rates of 84.6% and 78.4%, respectively [37]. In NRG-HN002, patients with low-risk, early-stage HPV-associated OPCs who received de-escalated IMRT with or without concurrent cisplatin had two-year OS rates of 96.7% and 97.3%, respectively, and two-year PFS rates of 90.5% and 87.6%, respectively [38]. While RTOG-1016 and NRG-HN002 used different RT doses (70 and 60 Gy, respectively), these were comparable to doses used by studies included in this analysis (Table 1 and Table 2). Moreover, for patients treated in these trials with IMRT and concurrent cisplatin, distant and locoregional failure patterns were similar to those observed in our study (Table 12).
Our analysis also further defined the toxicity profile associated with PRT. Our finding that acute feeding tube use was lower (2.1-fold) following PRT than IMRT is consistent with earlier reports on intensity-modulated proton therapy (IMPT) for patients with OPCs as well as preliminary results of a prospective trial comparing IMPT and IMRT [36,39]. After six months, however, this difference was no longer significant. Among prospective studies of patients with HPV-associated OPC treated with IMRT and concurrent cisplatin, rates of feeding tube use have decreased in the more recent treatment era: in RTOG-1016, the crude rates of feeding tube use one, six, and 12 months after treatment were 51%, 17%, and 9%, respectively, while in NRG-HN002, they were 22%, 2.8%, and 3.4%, respectively [37,38]. This may be related to multiple factors including reduced dose of RT, improved methods of supportive care before and after treatment, increased integration of dieticians and speech-language pathologists during treatment, and decreased utilization of prophylactic feeding tubes [40].
When compared to prospective studies using IMRT [37,38], adverse event rates associated with PRT appear favorable (Table 12). For example, relative to patients treated with IMRT enrolled on RTOG-1016 and NRG-HN002, patients treated with PRT appear to have similar rates of acute grade 3 or more dysphagia (PRT: 12.8%, RTOG-1016: 32-37.4%, NRG-HN002: 7.5-17.8%) and grade 3 or more mucositis (PRT: 31.7%, RTOG-1016: 41.5-46.2%, NRG-HN002: 21.1%). While rates of acute grade 3 weight loss (PRT: 1.4%, RTOG-1016: 5.8-7.8%, NRG-HN002: 3.4-5.9%) and grade 2 or more xerostomia (PRT: 12.8%, RTOG-1016: 49.7-53.6%, NRG-HN002: 45.6-51.3%) were numerically lower in with PRT compared to IMRT, this should be interpreted with caution as this is not a statistical comparison. Theoretically, lower rates of xerostomia and weight loss could contribute to the lower rates of acute feeding tube use seen with PRT. In terms of late adverse events, rates of grade 2-3 xerostomia (PRT: 19.2%, RTOG-1016: 32.1-33.6%, NRG-HN002: 19.4-26%) appear to be similar between PRT and IMRT, while grade 3 or more dysphagia may be less frequent after PRT (PRT: 1.6%, RTOG-1016: 4.4-6.1%, NRG-HN002: N/A). However, acute dermatitis (grade 3 or more) appears to be more frequent with PRT than IMRT (PRT: 18.6%, RTOG-1016: 8-12.4%, NRG-HN002: 2.6-5.4%). This finding is consistent with prior reports of PRT for other disease sites [41].
In addition to clinician-rated adverse events, this study also provides insight into PROs associated with PRT. PRO measurements are critical to toxicity comparisons between IMRT and PRT: they can reveal aspects of the patient experience that are not apparent in clinician-based assessments, and they can vary by RT technique [42,43]. With PRT, the impact of treatment on PRO quality measures is greatest toward the end of treatment, gradually lessens, and plateaus by 12 months after treatment. These kinetics are similar to those reported in studies of patients treated with IMRT [44,45].
While we could not quantitatively compare PROs between PRT and IMRT, the finding that xerostomia was numerically lower with PRT is not surprising: these symptoms are commonly reported across multiple instruments [46,47], and prior studies have demonstrated that more conformal RT techniques can improve patient-reported xerostomia [48]. The heterogeneity of PRO measures used in these studies highlights the need for the standardization of these measures to improve the interpretability and generalizability of these measures across future studies.
Outcomes reported in this study provide additional insight into the ongoing randomized trials of PRT versus IMRT for patients with OPCs. For example, the primary outcome of the phase III trial sponsored by MD Anderson Cancer Center (NCT01893307) compares PRT and IMRT on the basis of three-year PFS [7]. In this trial, IMRT is assumed to have a three-year PFS of 80%, and PRT will be considered non-inferior if the three-year PFS is within 9 percentage points (hazard ratio (HR) 1.535). Initial results of this trial found that compared to IMRT, PRT was associated with a non-inferior PFS (HR 0.87 on intention-to-treat analysis) and reduced rates of feeding tube dependence (42% versus 28%, respectively) [36]. While our analysis supports both of these findings, the absolute difference in acute feeding tube use between IMRT and PRT was lower in our study (9.6%) compared to this trial (14%).
Since non-inferiority of efficacy may not justify the widespread use of PRT for OPC, an additional understanding of its potential benefit on acute and late RT toxicities is required. The TORPEdO trial (ISRCTN 16424014) compares PRT and IMRT on the basis of patient- and clinician-rated late toxicities [8]. In this study, the co-primary endpoints are the following: (1) the physical composite score of the University of Washington Quality of Life Questionnaire (UW-QoL v4.0), which assesses patients' perceptions on chewing, swallowing, speech, taste, saliva, and appearance, and (2) rates of feeding tube use or CTCAE grade 3 weight loss at 12 months post-RT [8]. The trial is powered to detect an 8-point difference in UW-QoL physical composite score and an 18% difference in late feeding tube use or grade 3 weight loss (25% with IMRT versus 7% with PRT). Studies included in our analysis found that PRT was associated with improved patient-reported dry mouth and xerostomia at 12 months, but not taste, chewing, or swallowing [14,17,24]. Furthermore, although our study did not include weight loss outcomes, PRT and IMRT were associated with similar rates of late feeding tube use. Taken together, these findings suggest that the clinical benefit of PRT assumed by this trial may be smaller than anticipated.
Similar to TORPEdO, the Danish Head and Neck Cancer Group (DAHANCA) 35 (NCT04607694) trial consists of two companion trials (DAHANCA35D and DAHANCA35X) and examines late toxicities after PRT [35]. Patients are enrolled in either trial based on whether normal tissue complication probability (NTCP) models demonstrate at least a 5% improvement in dysphagia or xerostomia using PRT compared to IMRT. DAHANCA35D assesses the rate of clinician-rated dysphagia (grade 2 or more) at six months post-RT and is powered to detect a 12% reduction in dysphagia between PRT and IMRT. In this study, PRT is assumed to have a late dysphagia rate of 16%. This is similar to our study (pooled rate of late grade 2+ dysphagia with PRT, 11.8%) and is lower than the rate of late grade 2+ dysphagia seen on DAHANCA19 (28%). DAHANCA35X, on the other hand, assesses late xerostomia at six months post-RT using the European Organization for Research and Treatment of Cancer Quality of Life Questionnaire-Head and Neck 35 (EORTC QLQ-HN35) instrument. It is designed to detect an 8% reduction in grade 4 xerostomia between IMRT and PRT (10% versus 2%, respectively). In our analysis, one study [17] compared PRT and IMRT using the same instrument and found that the differences in xerostomia or sticky saliva at six months post-treatment were not significant. When examining rates of clinician-rated xerostomia in our study and RTOG-1016, PRT and IMRT appear to have similar rates of late grade 3 xerostomia (1.1% and 1-2%, respectively) [37].
Overall, our study had several strengths. First, this is one of the largest analyses of outcomes following PRT for the upfront management of OPCs. Patients included in this study were treated at academic centers using modern PRT techniques. This analysis was designed prospectively and used appropriate statistics, and confounding due to overlapping patient populations was specifically addressed. This study does, however, have some limitations. Because it is a study-level meta-analysis, detailed comparisons between subgroups were not possible. As a result, we were not able to compare toxicity outcomes by radiation dose (e.g., 60 Gy versus 70 Gy) or by treatment intent (definitive versus adjuvant). Given that multiple studies came from the same institution, the total number of included patients likely overestimates the unique number of patients. Additionally, some outcomes (particularly PROs) were too heterogeneously reported for pooled statistical analyses. As a result, we were unable to assess the impact of different risk factors (e.g., HPV status) on outcomes, and direct comparisons between PRT and IMRT were limited. This highlights the need for consistent reporting standards in institutional series.
Ultimately, these data further inform the risk-benefit analysis radiation oncologist must make when selecting between radiation treatment modalities. These findings also allow for more comprehensive decision-making for patients, who must weigh the potential benefits of PRT against its potential financial costs and logistical/access barriers.
Conclusions
For patients with OPCs, PRT is associated with a favorable toxicity profile and high early rates of OS and PFS. Compared to IMRT, PRT is associated with lower rates of acute (but not late) feeding tube use. While awaiting the final results of ongoing randomized trials, this study provides additional evidence regarding the efficacy and toxicity of PRT for the treatment of OPC.
The reference list from the paper itself. Each links out to its DOI / PubMed record.
- 1Proton radiation therapy for head and neck cancer: a review of the clinical experience to date Int J Radiat Oncol Biol Phys Holliday EB Frank SJ 2923028920142483789010.1016/j.ijrobp.2014.02.029 · doi ↗ · pubmed ↗
- 2Proton beam radiation therapy for oropharyngeal squamous cell carcinoma Int J Part Ther Mendenhall WM Beitler JJ Saba NF 243252920233716900510.14338/IJPT-22-00030.1PMC 10166016 · doi ↗ · pubmed ↗
- 3Spot-scanning beam proton therapy vs intensity-modulated radiation therapy for ipsilateral head and neck malignancies: a treatment planning comparison Med Dosim Kandula S Zhu X Garden AS 3903943820132391688410.1016/j.meddos.2013.05.001 · doi ↗ · pubmed ↗
- 4Clinical outcomes and patterns of disease recurrence after intensity modulated proton therapy for oropharyngeal squamous carcinoma Int J Radiat Oncol Biol Phys Gunn GB Blanchard P Garden AS 3603679520162708465310.1016/j.ijrobp.2016.02.021PMC 5474303 · doi ↗ · pubmed ↗
- 5A prospective study of mucosal sparing radiation therapy in resected oropharyngeal cancer patients Int J Radiat Oncol Biol Phys Anderson JD De Wees TA Ma DJ 19220111520233630907710.1016/j.ijrobp.2022.06.057 · doi ↗ · pubmed ↗
- 6Osteoradionecrosis of the jaw following proton radiation therapy for patients with head and neck cancer JAMA Otolaryngol Head Neck Surg Singh A Kitpanit S Neal B 15115914920233654796810.1001/jamaoto.2022.4165 PMC 9912132 · doi ↗ · pubmed ↗
- 7Comparing intensity-modulated proton therapy with intensity-modulated photon therapy for oropharyngeal cancer: the journey from clinical trial concept to activation Semin Radiat Oncol Frank SJ Blanchard P Lee JJ 1081132820182973518610.1016/j.semradonc.2017.12.002PMC 5942581 · doi ↗ · pubmed ↗
- 8TORP Ed O: a phase III trial of intensity-modulated proton beam therapy versus intensity-modulated radiotherapy for multi-toxicity reduction in oropharyngeal cancer Clin Transl Radiat Oncol Thomson DJ Cruickshank C Baines H 1471543820233645243110.1016/j.ctro.2022.11.010PMC 9702982 · doi ↗ · pubmed ↗