Mycophenolic acid trough level assessment in patients with lupus nephritis; does it make a difference?
Ahmed E. Abdulgalil, Noha H. Elnagdy, Nehal M. Ramadan, Eman Hamza, Ayman Hammad, Mai S Korkor, Atef Elmougy, Ali Sobh, Marwa H Elnagdy

TL;DR
This study examines whether measuring mycophenolic acid levels in lupus nephritis patients helps predict outcomes and side effects in adults and children.
Contribution
It identifies a correlation between MPA trough levels and disease activity in adults, but not in children.
Findings
Low MPA levels in adults correlated with lupus flares and higher disease activity scores.
High MPA levels in adults were linked to increased gastritis risk.
No significant associations were found in pediatric patients.
Abstract
Mycophenolate Mofetil (MMF) has become one of the cornerstone treatments of lupus nephritis (LN). It is converted into mycophenolic acid (MPA), an active metabolite, that displays high inter- and intra-individual pharmacokinetic variability. However, the routine monitoring of MPA trough level is still debatable. The present study aims to evaluate the relationship between MPA trough levels and both clinical outcomes and drug-related adverse effects during the maintenance phase of LN in Egyptian patients. We included thirty-five adults and twenty-nine children with biopsy-proven class III and IV LN, who had been maintained on steroid and MMF as maintenance therapy for more than six months. Clinical and laboratory markers of lupus activity as well as MMF adverse events were reported. MPA trough levels were measured by High-Performance Liquid Chromatography (HPLC). There was a…
Genes, proteins, chemicals, diseases, species, mutations and cell lines named across the full text — each resolved to its canonical identifier and authoritative record.
Click any figure to enlarge with its caption.
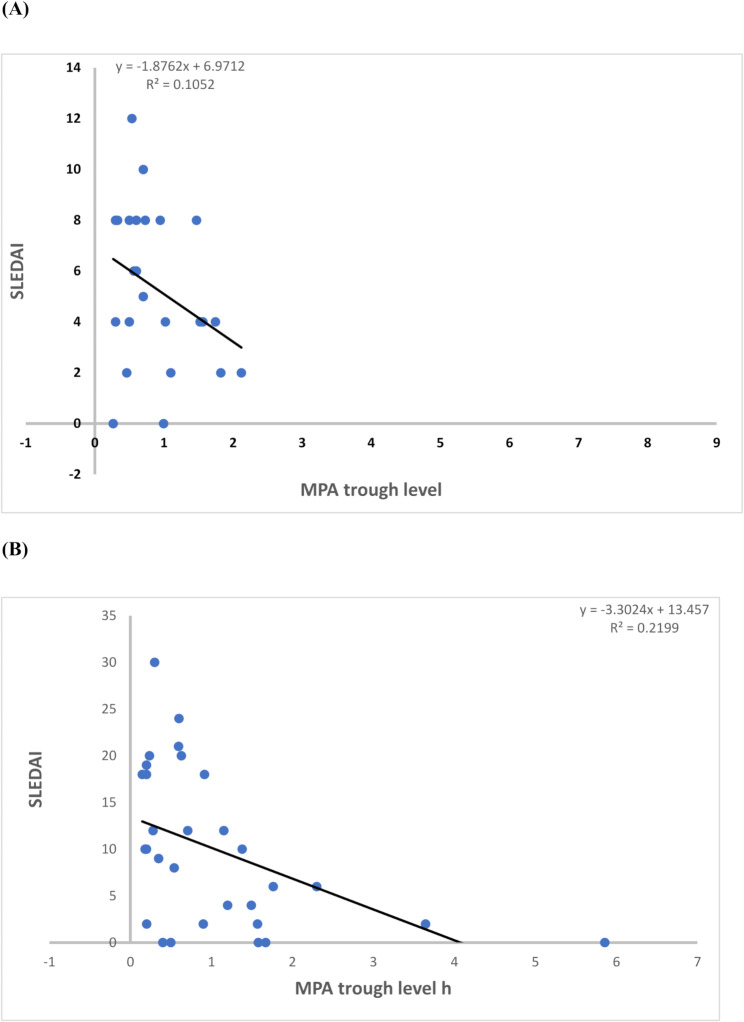 Figure 1
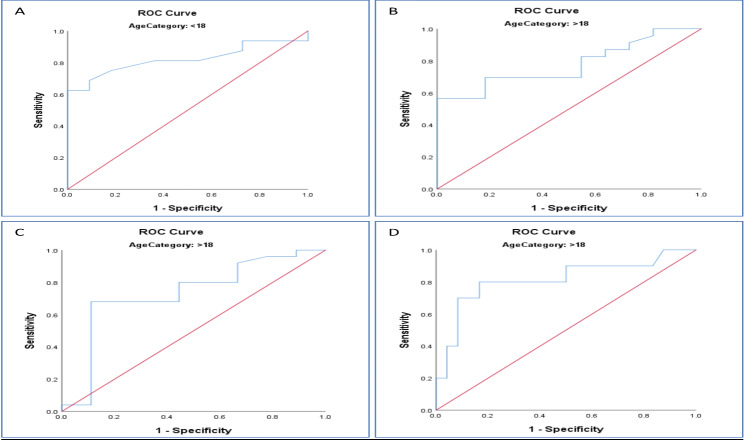 Figure 2
- —Mansoura University
Peer Reviews
No public reviews on file for this paper yet. If you reviewed it on a platform where reviews are public (OpenReview, ICLR, NeurIPS, ICML), you can paste yours below so the community can read it here.
Videos
No videos yet. Explain this paper in a talk, walkthrough, or lecture? Add one.
Taxonomy
TopicsSystemic Lupus Erythematosus Research · Renal Transplantation Outcomes and Treatments · Renal Diseases and Glomerulopathies
Background
Systemic lupus erythematosus (SLE) is a chronic autoimmune disease that can affect all body systems [1]. Lupus nephritis (LN) represents one of the most serious SLE manifestations that occur in more than 50% of patients [2] and can eventually end with renal failure [3].
Lupus nephritis can be presented with hematuria, impaired renal function, new-onset hypertension and, or proteinuria that varies from mild to marked or nephrotic range proteinuria and nephrotic syndrome presentation [4]. Moreover, Interstitial nephritis and thrombotic microangiopathy can be seen among LN patients [5]. Renal biopsy remains the gold standard for diagnosis and classification of LN lesions to guide the plan of therapy. LN can be classified into six classes according to International Society of Nephrology-Renal Pathology Society 2003 classification system [6].
Treatment of LN includes induction of remission with steroids with either cyclophosphamide pulses or Mycophenolate Mofetil (MMF) followed by maintenance therapy with steroids combined with MMF or azathioprine. MMF has been shown to be as effective as cyclophosphamide in induction and more effective than azathioprine in maintenance phase [7, 8]. Moreover, a meta-analysis concluded that MMF can induce remission in severe cases of LN with lower risk of adverse effects that occur with cyclophosphamide pulses [9].
Monitoring of trough level of mycophenolic acid (MPA) could be beneficial in optimizing MMF doses as there are wide interindividual differences in drug pharmacokinetics [10], and this has been extensively studied in solid organ transplantation [11]. However, this may be affected by the differences in the clinical status of LN patients and the concomitant use of other immunosuppressive drugs. Previous literature has suggested an association between the level of MPA exposure and achievement of remission in LN [12]. Moreover, several studies have highlighted that MPA trough levels are correlated to MPA area under concentration-time (AUC) [13, 14]. In contrast, the impact of MPA trough level on lupus activity and drug-related side effects in patients with LN needs further evaluation [15]. Furthermore, studies are very limited in juvenile onset lupus. Hence, we conducted the present study on two groups of SLE patients: adults and children to assess the relationship between MPA trough level, disease activity, and drug adverse effects during the maintenance phase of LN treatment.
Methods
Patients and study design
The current study is a cross-sectional study that was conducted between June 2022 and December 2022. Adult cases (aged above eighteen years) were recruited from the Nephrology unit and the Rheumatology department in Mansoura University Hospital, while pediatric cases (aged below 18 years) were recruited from Mansoura University Children’s Hospital. The study protocol was approved by the Institutional Review Board of Mansoura University (R.21.11.1503). Informed consents were obtained from all included patients, or their legal guardians before enrolling in the study.
Sample size calculation
The G*Power software (version 3.1.9.7) was used. Based on previous data available from, who reported a considerably large effect size (d = 1.000255) when comparing MPA trough value of two independent groups regarding acid-reflux symptoms [16]. A total sample size of 64 (distributed over the two groups in a ratio of 2.6) achieves 91% power to detect differences among the means using the Mann Whitney test with a 0.05 significance level.
Inclusion and exclusion criteria
SLE patients diagnosed with class III or IV LN based on histopathological findings of renal biopsy, who were maintained on MMF therapy for more than six months were enrolled in the study. We excluded patients who were maintained on calcineurin inhibitors or receiving any drugs that could interfere with MPA pharmacokinetics as cholestyramine, acyclovir, or rifampicin.
Study outcomes
The primary outcome was to assess the correlation between the MPA trough levels, clinical parameters of lupus activity, SLEDAI scores and MMF related adverse effects during follow up of the included lupus nephritis patients.
Clinical and laboratory assessment
All included patients were maintained on MMF therapy for more than six months before enrolling in the study. We started with a dose of 1 gm/day and titrated up to maximum of 2 gm/day according to lupus activity and SLEDAI scores.
Detailed history taking, and clinical examination were performed in all included cases with documentation of MMF related adverse effects as nausea, vomiting, diarrhea, or infections. Investigations were done for all included patients including CBC, CRP, ESR, serum creatinine, C3, C4, ANA, anti-dsDNA titers, urine analysis, 24-hour urinary protein collection, and MPA trough concentration. MPA trough levels between 2 and 4 µg/mL have been suggested to achieve maximum drug response with minimal side effects [17]. MPA trough concentration samples were obtained from patients on the same day as data collection and calculating activity scores. MPA trough levels samples were withdrawn 12 h after the last dose (C12). Patients were instructed to take MMF dosage every 12 h one month before taking samples. Activity scores were evaluated using Systemic Lupus Erythematosus Disease Activity Index 2000 (SLEDAI 2k) score (0 = no activity; 1 = mild activity with no therapeutic intervention; 2 = disease activity, but with improvement from previous visit; 3 = persistent activity/refractory to treatment; 4 = flare). Lupus flare means worsening of an already active system or a recent activity involving another system [18]. The most appropriate SLEDAI-2 K cut-off score to define lupus activity requiring drug adjustment is 3 or 4 [19].
Plasma MPA trough level measurement
Plasma MPA trough levels were measured using the Reversed Phase High Performance Liquid Chromatography with Ultraviolet detection (RP-based HPLC-UV), according to the method previously described by Rissling et al. [20].
Materials
MPA analytical standard (98.5% purity, 89287) was purchased from Sigma Aldrich, USA. Other chemicals and solvents were of HPLC purity grades and were purchased locally. Control samples were obtained from healthy volunteers.
Sample preparation
For measurement of MPA C0, lithium-heparin blood samples were withdrawn from all included patients. To ensure standardization of MPA results, samples were collected 12 h after the last evening MMF dose (MPA C0). Then, centrifugation of samples was done for 10 min, then the plasma was collected and stored at -80 C.
Instrument and HPLC method
The HPLC system consisted of a Waters 2690 Alliance HPLC system (Milford, USA) equipped with a Waters 996 photodiode array detector set on 214 nm, an autosampler tempered at RT, column oven at 55 C and compatible data processing software. The drug was separated by a C18 Inertsil ODS analytical column (150 mm×4.6 mm, particle size 5 μm; GL Sciences, Japan) equipped by a guard column of the same packing. The mobile phase was composed of acetonitrile– 50 mmol/L potassium dihydrogen phosphate, pH 2.4. (30:70; v/v) with a flow rate of 1.5 ml/min.
Standard preparation and assay procedure
A stock solution of 1.0 mg/mL MPA in acetonitrile was prepared, from which seven calibration standards were prepared. The drug-free human plasma was used for serial dilutions of MPA stock solutions to obtain concentrations of 0.7, 0.6, 0.5, 0.4, 0.3, 0.2, 0.1 µg/ml.
Using the method previously described, a 125µL acetonitrile was added to each aliquot of fifty µL calibration standards or plasma samples. The mixture was well-mixed for 15 s then centrifuged in 1.5mL polypropylene tubes at 1500 g for 5 min. Then supernatant volume of 75µL were mixed with 50µL 50 mmol potassium dihydrogen phosphate, pH 2.4. After being filtered through 0.22 μm Nylon syringe filter, a volume of 20µL was injected. MPA peak was extrapolated (retention time: MPA peak, 3.30 min). The calibration curve was obtained (range, 0.1–0.7 µg/L) (Supplementary Fig. 1).
Statistical analysis
We used SPSS version 25 software (Statistical Package for the Social Sciences) for tabulation and analysis of the data. Data were presented as mean and Standard Deviation (SD) or median and interquartile range (IQR) in quantitative data and number (N) and percent (%) in qualitative data. The Student T test and Mann Whitney Test (U test) were used to compare parametric quantitative variables and non-parametric variables, respectively. Spearman’s rank correlation analyses were performed to examine the unadjusted association between MPA C0 and other clinical variables with continuous data. Receiver-operated characteristic (ROC) curves were generated to determine the cut-off level of estimated MPA C0 related to different clinical outcomes. P-value < 0.05 is considered statistically significant.
Results
The preset study included sixty-four patients with LN; thirty-five were adults (mean age of 30.53 years) and twenty-nine of them were children (mean age of 14.93 years). Patient characteristics, clinical findings, laboratory parameters, treatments, and MMF-related side effects are illustrated (Table 1). There was a female predominance in both age groups with a median SLEDAI of 5 in pediatrics (0–22) and nine in adults (0–30). All patients were maintained on steroids and MMF. MMF related side effects included gastritis, leucopenia, and infection. Gastritis was the most frequent one observed in 27.6% and 28.6% in pediatric and adult groups, respectively.
Table 1. Demographics, clinical findings, laboratory results, treatments and side effects observed in the study groupsPediatric group (n = 29)Adult group (n = 35)Age (years) mean ± SD14.93 ± 1.7930.54 ± 9.01Sex:MaleFemaleBMI median (min-max)Disease duration in month median (min-max)8 (27.6%)21 (72.6%)22. 27 (14.22–45.2)12 (6–30)4 (11.4%)31 (88.6%)25.42 (18.61–33.06)24 (6–84)Clinical findings N (%)HypertensionMalar rashOral ulcerAlopeciaPhotosensitivityArthritisMyalgiaPleurisyNeurological symptomsCarditisLN class IIILN class IVFlare5 (17.2%)7 (24.1%)7 (24.1%)7 (24.1%)1 (3.4%)1 (3.4%)0 (0%)0 (0%)0 (0%)0 (0%)13(44.8%)16 (55.2%)13 (44.8%)11 (31.4%)10 (28.6%)3 (8.6%)14 (40%)7 (20%)10 (28.6%)2 (5.7%)3 (8.6%)1 (2.9%)3 (8.6%)15 (42.9%)20 (57.1%)12 (34.3%)InvestigationsHemoglobin (g/dl)WBCs (10^3^/L)CRP (mg/dl)ESR (mm/hr)Creatinine (mg/dl)C3 (mg/dl)C4 (mg/dl)ANAdsDNA titers24 h. urine protein (mg/day)Hematuria (cells/HPF)11.6 (7.5–13.5)8 (3.8–12)2 (0–45)35 (20–75)0.6 (0.3–1.2)90 (51–204)10 (8–20)5.5 (0–15)1.1 (0–4)350 (150–2700)3 (1–60)11 (7.2–14)5 (3.1–12)3(0–80)35 (7-119)0.8 (0.4–2.2)100 (40–140)12 (6–28)2 (0-10.7)1 (0–8)540 (58-6500)5 (0–20)TreatmentSteroid dose mg/d median(min-max)20 (5–45)20 (2.5–60)HCQ no (%)Dose: 200 mg/d400 mg/d29 (100%)29 (100%)31 (88.6%)5 (16.1%)26 (83.9%)MMF dose1000 mg/d1250 mg/d1500 mg/d2000 mg/d25 (86.2%)0 (0%)1 (3.4%)3 (10.3%)9 (25.7%)1 (2.9%)8 (22.9%)17 (48.5%)MPA trough level (µg/mL)0.7 (0.27–8.79)0.83 (0.15–5.86)MMF side effects N (%)GastritisLeucopeniaInfection8 (27.6%)1 (3.4%)1 (3.4%)10 (28.6%)6 (17.1%)4 (11.4%)SLEDAI median (min-max)5 (0–22)9 (0–30)Quantitative data are presented as median ± range, unless otherwise stated. Categorical variables and adverse event data were presented as N and percentage (%), N: number, BMI: body mass index, LN: lupus nephritis, CRP: C reactive protein, ESR: erythrocyte sedimentation rate, C3: complement C3, dDNA: double stranded DNA, HCQ: hydroxy chloroquine, MMF: mycophenolate mofetil, MPA: mycophenolic acid, SLEDAI: SLE Disease Activity Index
Regarding the correlation between the MPA trough levels and the clinical outcomes, significantly lower MPA trough levels were observed in the adult patients with lupus flare, compared to those in remission (P = 0.027) (Table 2). A significant, yet weak, negative correlation was also observed between MPA trough levels and SLEDAI in the adult group (P = 0.019) (Fig. 1). In addition, significantly higher MPA trough levels were observed in adult patients with gastritis compared to those without gastritis (P = 0.007). However, in the pediatric group, no significant association was found between MMF trough levels and any of the parameters studied (Table 3).
Table 2. Comparison between MPA trough levels (µg/mL) and clinical findings/MMF-related side effects in both study groupsPediatric group (n = 29)Adult group (n = 35) №
MPA trough level
P-value
№
MPA trough level
P-value mean ± SDmean ± SDClinical findingsMalar rash:Present71.45 ± 2.440.221101.03 ± 1.40.112Absent221.43 ± 1.8251.47 ± 1.4Oral ulcer:Present71.59 ± 2.40.68332.52 ± 1.980.316Absent221.38 ± 1.81321.24 ± 1.31AlopeciaPresent71.59 ± 2.40.683141.26 ± 1.370.533Absent221.38 ± 1.81211.41 ± 1.44PhotosensitivityPresent11.470.47371.69 ± 1.480.248Absent281.43 ± 1.96281.26 ± 1.39ArthritisPresent16.980.12101.05 ± 1.360.139Absent281.24 ± 1.63251.47 ± 1.42MayalgiaPresent0--22.07 ± 2.50.619Absent291.43 ± 1.93331.3 ± 1.35PleurisyPresent0--30.37 ± 0.210.133Absent291.43 ± 1.93321.44 ± 1.42CerebritisPresent0--10.60.8Absent291.43 ± 1.93341.37 ± 1.41CarditisPresent0--30.37 ± 0.210.118Absent291.43 ± 1.93321.44 ± 1.42FlarePresent131.25 ± 1.90.062120.75 ± 0.92 *0.027 Absent161.59 ± 1.997231.66 ± 1.51Side effectsGastritisPresent81.65 ± 2.250.769102.42 ± 1.76 *0.007 Absent211.35 ± 1.84250.92 ± 0.96LeucopeniaPresent11.820.23161.41 ± 1.690.526Absent281.42 ± 1.96291.34 ± 1.36InfectionPresent10.50.33841.84 ± 1.390.213Absent281.47 ± 1.95311.28 ± 1.4MMF trough levels are presented as mean ± SD and compared by Mann Whitney U-test. №: number, MPA: mycophenolic acid
Fig. 1. Spearman’s rank correlation between MPA trough concentrations (µg/mL) and SLEDAI in the pediatric (A) and Adult (B) groups
Table 3. Correlations of MPA trough concentrations with laboratory findings and SLEDAI in study groupsPediatric group (n = 29)Adult group (n = 35) Correlation Coefficient
Sig. (2-tailed)
Correlation Coefficient
Sig. (2-tailed) MMF dose0.2110.2720.2830.099Hemoglobin-0.0430.825-0.0790.651Leucocytes-0.2160.2610.0930.594CRP-0.2950.1210.2780.106ESR0.0590.761-0.0260.884Proteinuria-0.1540.425-0.0160.926Hematuria0.0070.971-0.2060.234Creatinine0.3940.0350.10.566C3-0.0360.8540.1960.227C40.2040.216ANA-0.0190.921-0.1410.42dsDNA titre-0.1040.591-0.1843870.289SLEDAI-0.2740.15-0.393 0.019 Spearman’s rank correlation analyses were used with a P-value of < 0.05 considered statistically significant. MMF: mycophenolic mofetil, CRP: C reactive protein, ESR: erythrocyte sedimentation rate, C3: complement C3, dDNA: double stranded D
Regarding the therapeutic response to MMF, ROC curves detected that the cut-off levels of MPA trough concentrations below which flare is increasingly encountered. In adults, MPA troughs lower than or equal to 0.67 µg/mL were proposed to be associated with higher risk of flares (70% sensitivity and 82% specificity, p value < 0.01). while in pediatric group, trough level below 0.716 µg/mL (69% sensitivity and 91% specificity, p value < 0.005). Moreover, in adults, malar rash was more frequent with MPA trough levels lower than 0.67 µg/mL (68% sensitivity and 93% specificity, p = 0.042). On the other hand, gastritis was increasingly seen with MPA trough levels equal to or greater than 1.29 µg/mL (80% sensitivity and 83% specificity, p value = 0.004) (Fig. 2 and supplementary Fig. 2).
Fig. 2. Receiver operating characteristic (ROC) curves of MPA trough concentration to predict therapeutic outcomes of MFF treatment. The fraction of true-positive (sensitivity) and that of false-positive results (1-specificity) for flare in pediatrics (A), flare in adults (B), malar rash in adults (C), gastritis in adults (D). For area under the curve of ROC curves and 95% confidence intervals, please refer to supplementary Fig. 2. A value of 0.5 (reference red line) is no better than by chance and a value of 1.0 reflects a perfect indicator
Discussion
Although MMF represents a cornerstone treatment for LN, the optimal dose of MMF and target MPA level to maximize efficacy and minimize toxicity is still debatable [3]. MMF under dosage may lead to uncontrolled disease activity, however MPA over exposure is costly and can lead to serious complications such as recurrent infections and bone marrow depression [15]. Additionally, there is wide inter-patient variability in MPA pharmacokinetics, Hence, MPA therapeutic drug monitoring (TDM) is essential for appropriate MMF dosage [14, 21].
Inter-individual variability is less significant in patients suffering from autoimmune disease (AID) than those with kidney transplantation. This is due to less fluctuation in concomitant therapy in AID patients. Thus, a single MMF trough-level seems to be a worthwhile monitoring approach in those with AID [13].
The most widely used methods for TDM of MPA are either AUC or trough levels monitoring [21]. There have been trials to substitute the standard AUC measurement with single time-point MPA trough levels. Studies showed that MPA-AUC had significant positive correlations with both MPA trough levels and MMF therapeutic responses. Although C1, C2, and C12 MPA levels all correlate well with AUC0–12, MPA C12 trough level remains an attractive and practical tool to guide MMF therapy [13, 15].
The present study revealed that, in adult group, MPA trough levels had significant negative correlation with the occurrence of lupus flare and the level of disease activity as indicated by SLEDAI 2k score (P values 0.027 and 0.019, respectively). Similarly, Yap et al. concluded that lower MMF trough levels increased the risk of renal flares and higher trough levels increased incidence of anemia, decreased levels of immunoglobulin and increased risk of serious infections [15].
Moreover, other studies reported that lower MPA trough levels increased the risk of disease recurrence, whereas higher levels led to more MMF-related adverse effects such as gastrointestinal complaints (P = 0.007) [13], hematological complications and repeated infections [22].
In agreement with Yap et al. MPA trough levels did not correlate with the levels of anti-dsDNA or C3 [15]. This can be attributed to the effect of concomitant steroids and variable response of various components of the immune system.
The use of TDM to optimize the MMF treatment in children is not widely adopted except in solid organ transplantation [23]. There were only very few studies done on children with SLE [24]. Regarding pediatric patients, MPA trough levels did not correlate with either flare, disease activity or occurrence of MMF related-side effects. This may be explained by the fact that ideal dosing of MMF in children with LN is not yet well described and that weight- or body surface area-based MMF dosage does not predict MPA pharmacokinetics or dynamics [24].
The developmental changes (ontogeny) in physiological and biochemical parameters in children should be considered during TDM as they may influence the drug absorption, body fluid distribution, metabolism, and finally the clearance from the body. TDM should be used to improve therapeutic outcomes, by improving drug efficacy and/or decreasing adverse effects [25]. Data from the few studies performed on pediatric LN patients suggested that personalized MPA-AUC based MMF dosage might be safer and more cost-effective than the currently used body surface area-based approach [26].
However, MPA-AUC monitoring is laborious, not suitable in daily practice and demands multiple blood sampling. Thus, it is time and resource-consuming, and not well tolerated by children [25]. Additionally, data regarding its use in pediatrics is conflicting. Higher MPA-AUC was associated with increased risk of bone marrow depression, severe leukopenia [27] and recurrent infections [28]. Moreover, another study concluded that the clinical response six months after MMF initiation is highly dependent on the initial MPA-AUC values, and they found that MPA-AUC of 30 mg/l or higher led to better control of lupus activity [29]. In contrast, no significant associations were found between MPA-AUC and MMF related side effects in other studies [30, 31]. Indeed, yet there is no adequate evidence suggesting the best modality for cost-effective MMF dosage in children with lupus.
The limitations of the current study include the relatively small sample size and lack of MPA trough levels and AUC correlation. Future randomized controlled detailed pharmacokinetic trials with large sample size and prolonged follow up are needed to ascertain the correlation of MPA trough level and LN activity and/or MMF adverse effects. Also, further studies are still needed in LN pediatric patients to clarify the reasons for the missing correlation between MPA trough level, disease activity and MMF side effects.
Conclusion
MPA trough concentrations correlated with disease activity and gastritis in adult LN patients, and this may help to optimize MMF dosage without causing serious adverse effects. However, this MPA trough concentration-effect relationship was not evident in pediatric patients that requires more extensive evaluation in future studies.
Electronic supplementary material
Below is the link to the electronic supplementary material.
Supplementary Material 1
The reference list from the paper itself. Each links out to its DOI / PubMed record.
- 1Ameer MA, Chaudhry H, Mushtaq J, Khan OS, Babar M, Hashim T et al. An overview of systemic lupus erythematosus (SLE) pathogenesis, classification, and management. Cureus. 2022;14(10).10.7759/cureus.30330 PMC 966284836407159 · doi ↗ · pubmed ↗
- 2Sagcal-Gironella ACP, Fukuda T, Wiers K, Cox S, Nelson S, Dina B, et al. editors. Pharmacokinetics and pharmacodynamics of mycophenolic acid and their relation to response to therapy of childhood-onset systemic lupus erythematosus 2011: Elsevier.10.1016/j.semarthrit.2010.05.007PMC 302177020655577 · doi ↗ · pubmed ↗