Function of lamp2 Gene Response to Vibrio vulnificus Infection and LPS Stimulation in the Half-Smooth Tongue Sole (Cynoglossus semilaevis)
Tian Han, Yufeng Liu, Mengchao Li, Yitong Zhang, Zhongwei He, Yuqin Ren, Wei Cao, Jiangong Ren, Yufen Wang, Guixing Wang, Chunguang Gong, Jilun Hou

TL;DR
This study explores how the lamp2 gene in half-smooth tongue sole responds to infection by Vibrio vulnificus and LPS stimulation, revealing its role in immune regulation.
Contribution
The study identifies lamp2's regulatory role in immune-related genes during infection in a teleost fish species.
Findings
The lamp2 gene is constitutively expressed in various tissues of the half-smooth tongue sole, with highest levels in blood.
lamp2 positively regulates lc3, rab7, vamp8, snap29, and stx17, and negatively regulates ctsd and ctsb in response to infection.
Ultrapathology analysis showed increased lysosomes and autophagosomal vesicles after V. vulnificus infection.
Abstract
Lysosome-associated membrane glycoproteins (LAMPs), including lysosomal membrane protein 1 (Lamp1) and lysosomal membrane protein 2 (Lamp2), are involved in phagocytosis, chaperone-mediated autophagy (CMA), and other pathways that interact with lysosomal activity. However, the role of Lamp2 in teleosts has not been clarified. In this study, we investigated the functions of lamp2 genes during Vibrio vulnificus infection. We achieved subcellular localization of the lamp2 gene at the cellular level and performed overexpression and RNA interference experiments followed by Lipopolysaccharides (LPS) stimulation to probe the expression changes of related genes. Ultrapathology analysis of the head-kidney revealed an increase in lysosomes and the formation of autophagosomal vesicles after V. vulnificus infection, suggesting that lysosomes bind to autophagosomes. The lamp2 gene, encoding 401…
Genes, proteins, chemicals, diseases, species, mutations and cell lines named across the full text — each resolved to its canonical identifier and authoritative record.
Click any figure to enlarge with its caption.
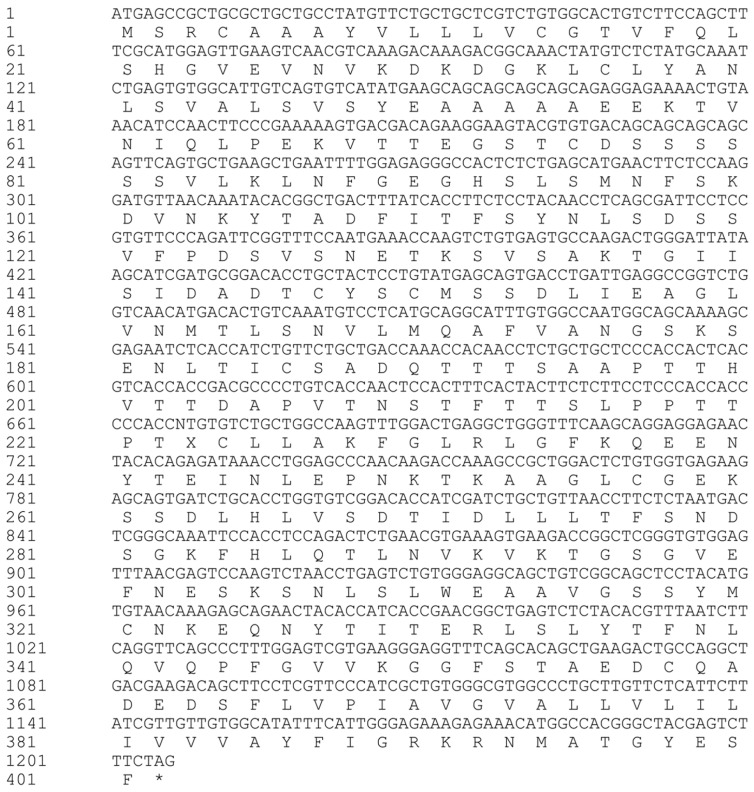 Figure 1
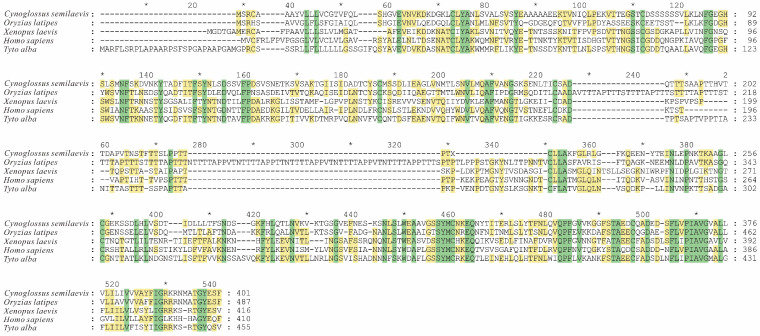 Figure 2
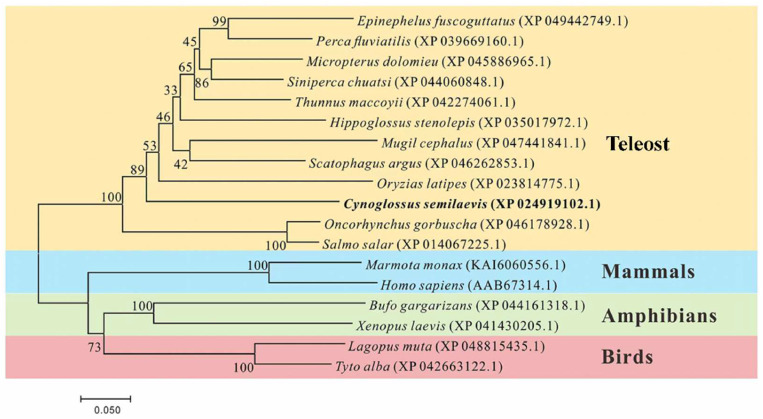 Figure 3
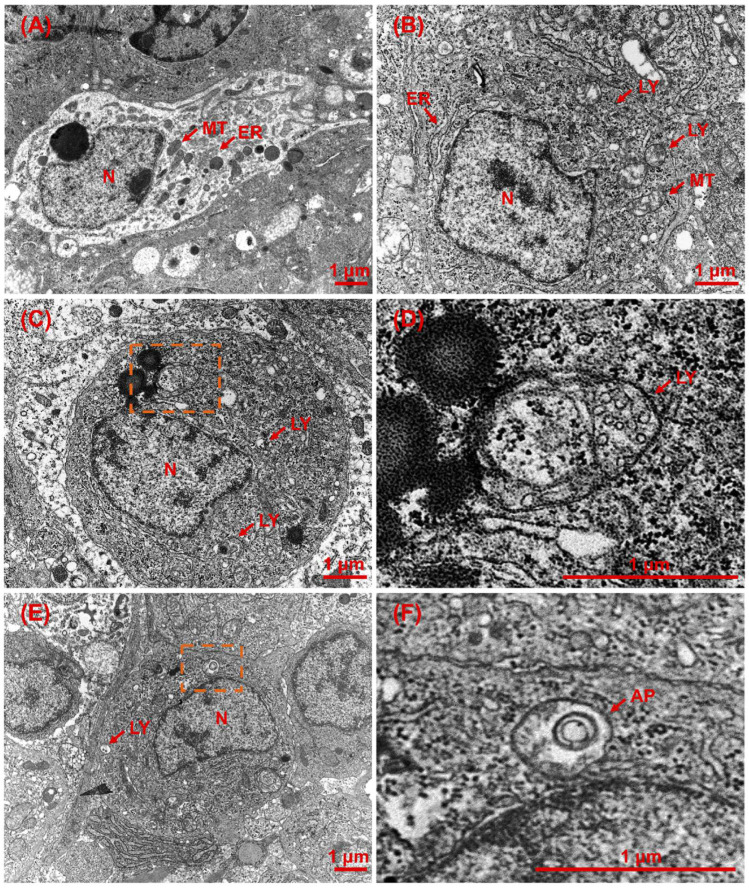 Figure 4
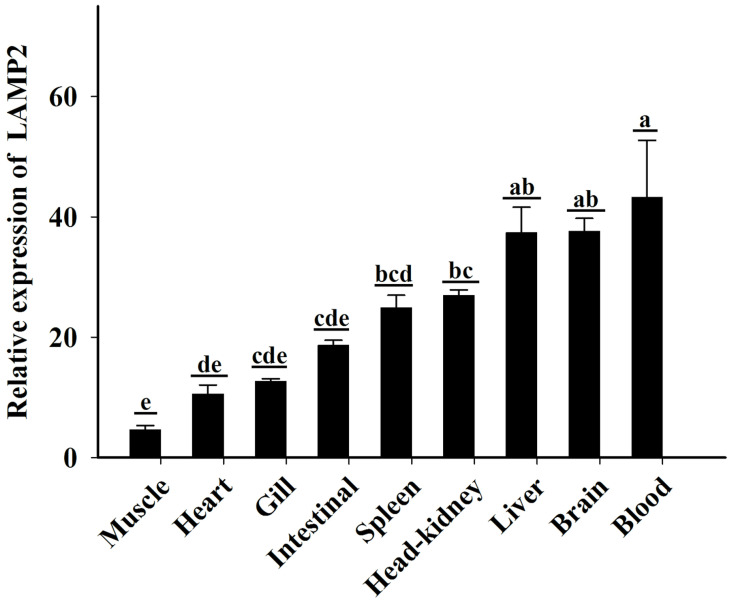 Figure 5
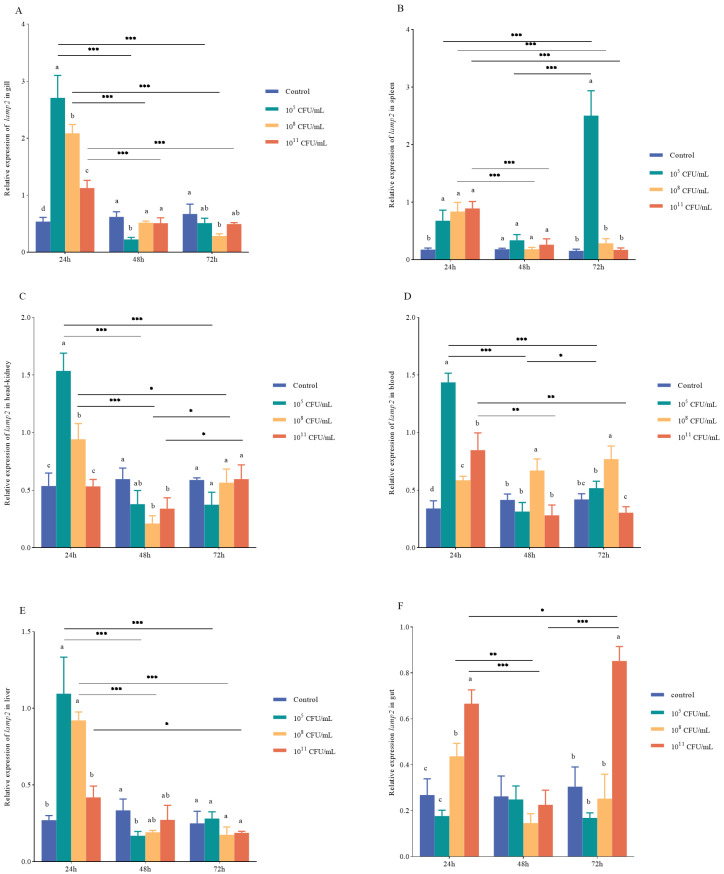 Figure 6
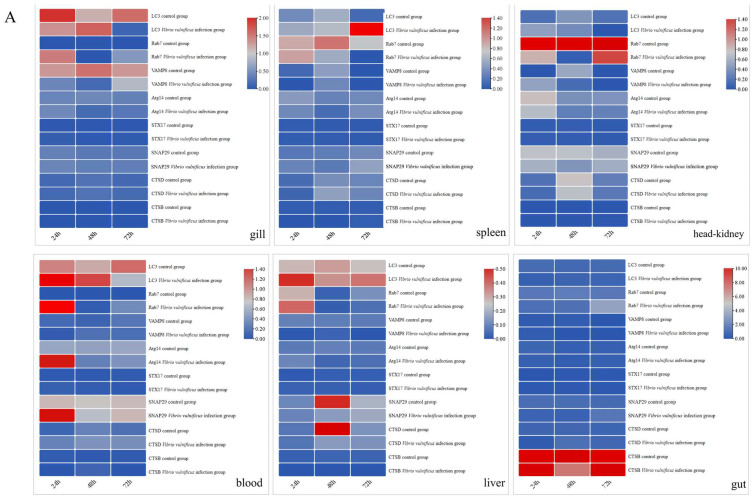 Figure 7
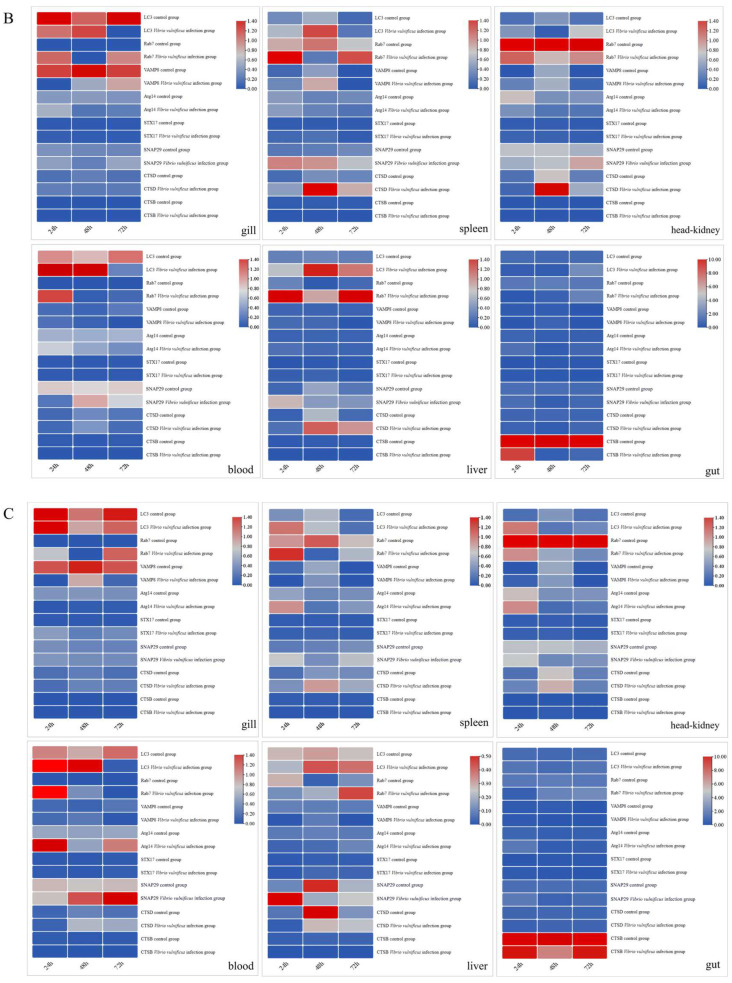 Figure 8
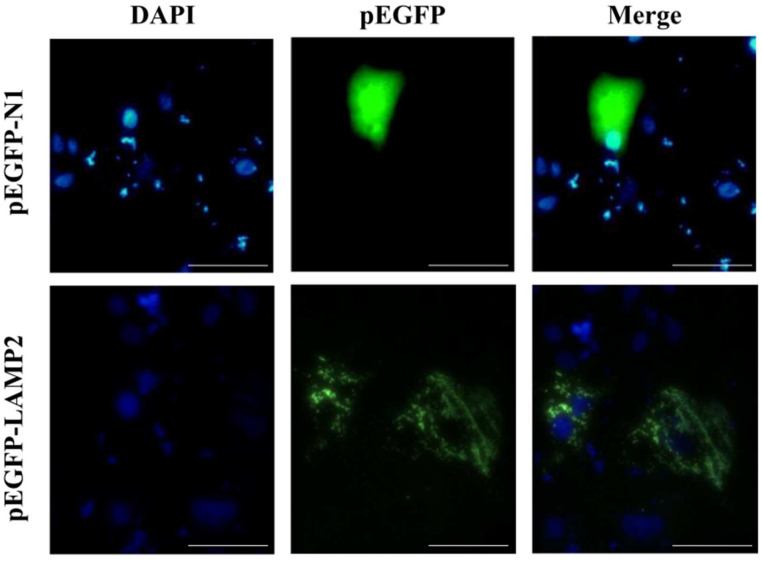 Figure 9
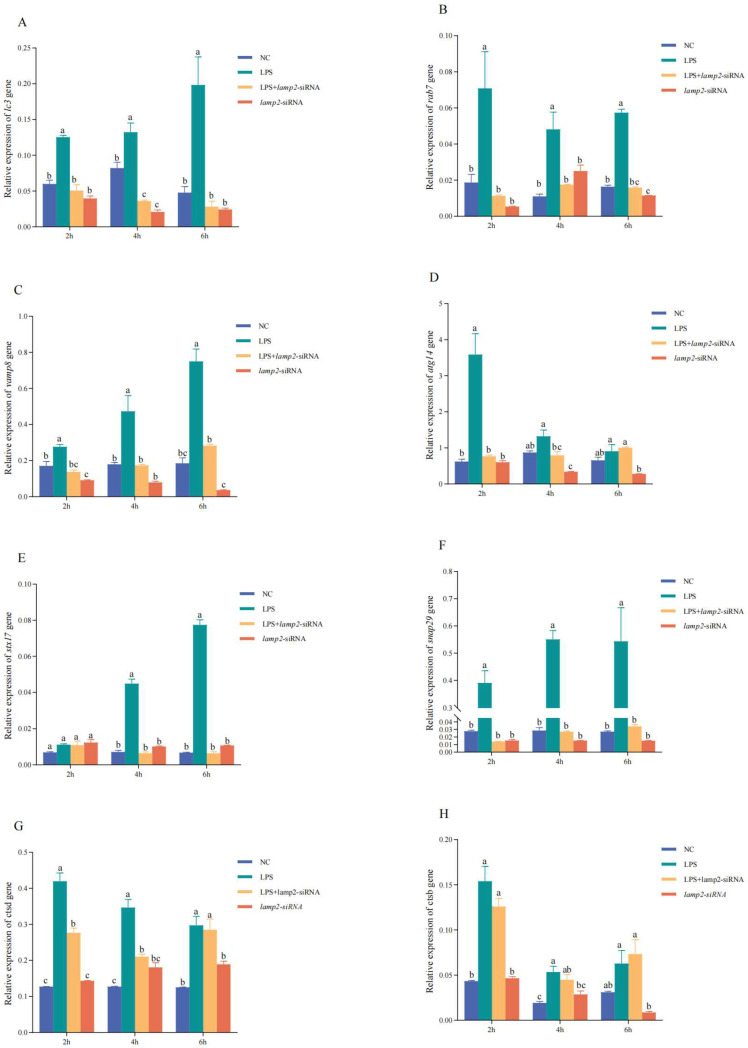 Figure 10
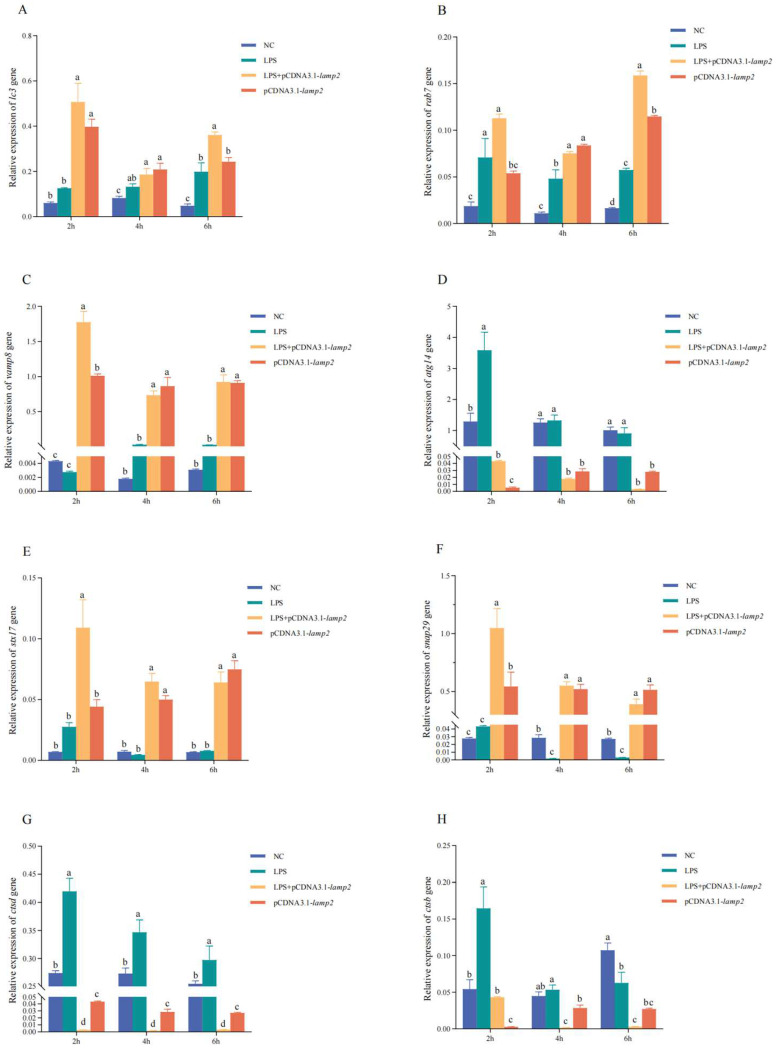 Figure 11
- —Central Public-Interest Scientific Institution Basal Research Fund, CAFS
- —Key R&D Program of Hebei Province, China
- —National Marine Genetic Resource Center
Peer Reviews
No public reviews on file for this paper yet. If you reviewed it on a platform where reviews are public (OpenReview, ICLR, NeurIPS, ICML), you can paste yours below so the community can read it here.
Videos
No videos yet. Explain this paper in a talk, walkthrough, or lecture? Add one.
Taxonomy
TopicsAquaculture disease management and microbiota · Toxoplasma gondii Research Studies · RNA Interference and Gene Delivery
1. Introduction
Lysosomes are organelles found in animal cells that contain enzymes capable of breaking down various biomolecules, including proteins, nucleic acids, and carbohydrates [1]. They play a crucial role in cellular digestion and waste removal. Lysosome-associated membrane glycoproteins (LAMPs), including lysosomal membrane protein 1 (Lamp1) and lysosomal membrane protein 2 (Lamp2), are involved in phagocytosis, chaperone-mediated autophagy (CMA) [2], and other pathways interacting with lysosomal activities. Bacterial infections can affect lysosomes in different ways. For instance, Mycobacterium tuberculosis and Staphylococcus aureus infections increase the host cellular lysosome levels compared with uninfected conditions, whereas Salmonella infection reduces the levels of lysosomal constituents, including lamp2 [3]. Innate immunity involves the internalization of pathogens, such as bacteria, through phagocytosis and targeting them to lysosomes for degradation [2]. Lysophagic clearance of damaged lysosomes generates lysosomal membrane protein complexes, which constitute small vesicles with the N-terminal protein chain facing the lumen of the vesicle [4]. Overall, lysosomes play a crucial role in degrading cellular waste and pathogens; bacterial infections can affect lysosomal constituents, including lamp2.
Recent studies have revealed that Lamp2 exists not only as a structural protein in membrane structures but also has many other functions [5]. For instance, Lamp2 is essential in regulating autoimmune diseases, autophagosome formation, endosomal fusion, cholesterol transport, thymus development, tumor invasion, and metastasis [6]. Lamp2 can be directly involved in neutrophil adhesion, autophagy, and antigen presentation. Several studies have shown that lysosomes and the spread of pathogens are closely linked to many complex biological processes [7].
While more research results are needed to provide a definitive conclusion on the effect of Lamp2 on bacterial infection, some studies have suggested that Lamp2 plays a role in lysosomal function and autophagic flux, which are essential for the degradation of cellular waste and pathogens [4,8]. Additionally, lamp2 deficiency has been shown to attenuate the neurodegeneration markers induced by HSV-1 infection [9]. Furthermore, Lamp2 has been associated with intracellular bacteria and Salmonella-containing vacuoles [10]. Overall, although the exact role of lamp2 in bacterial infection is unclear, it appears to be involved in lysosomal function and autophagic flux, which are important for pathogen degradation.
The half-smooth tongue sole (Cynoglossus semilaevis) is a vital marine fish species in China, particularly significant in aquaculture. However, diseases, especially those caused by bacterial infections, have led to substantial economic losses as the aquaculture industry has expanded [11]. Vibrio vulnificus, a zoonotic pathogen, poses a threat to both humans and fish, sometimes leading to sepsis and death. Understanding the interaction between the host and V. vulnificus is crucial for insights into the host’s bactericidal activity and the mechanisms of V. vulnificus clearance through lysosomal and phagosomal pathways [10,12,13,14,15,16]. In this study, we assessed the ultra-pathological changes associated with V. vulnificus infection in the half-smooth tongue sole, characterized the expression of lamp2, and analyzed the mRNA expression profiles in various tissues exposed to different concentrations of V. vulnificus at distinct time points. Additionally, we profiled the mRNA expression of lamp2 and its related genes in tissues subjected to Lipopolysaccharides (LPS) stimulation. Our findings offer new insights into the immune function of lamp2 in the half-smooth tongue sole.
2. Results
2.1. Sequencing Characterization of lamp2
The open reading frame of the half-smooth tongue sole lamp2 gene was 1206 bp in length (Figure 1), and encoded 401 amino acids with a predicted molecular weight of 42.91 kDa and a theoretical isoelectric point of 4.84; the probability of lamp2 having a signal peptide was 98.158%; the signal peptide type was SP (Sec/SPI) secretory signal peptide; the excision site was 23–24; the probability of the presence of a signal peptide was 95.28%; the signal peptide position was 1–23 aa; and the average hydrophobicity was 0.046, which is a hydrophobic protein. The prediction of the transmembrane region revealed that the transmembrane structural domain was located between 365 and 387 amino acids (Figure 2).
Phylogenetic analysis revealed that the lamp2 gene from the half-smooth tongue sole and other teleost fish clustered together, forming a distinct group separate from mammals, amphibians, and birds (Figure 3).
2.2. Effect of V. vulnificus on Head Kidney Ultramicroscopic Pathology
Under ultramicroscopic examination, the head kidney tissue of the healthy half-smooth tongue sole exhibited a uniform cytoplasmic distribution with round or oval nuclei centrally located within the cytoplasm. In these healthy fish, the nuclear membrane boundaries were visible, mitochondria were intact, and the cytoplasm contained numerous neatly arranged endoplasmic reticula (Figure 4A). In contrast, the ultrastructure of the head kidney tissues from infected fish displayed enlarged nuclei with distorted nuclear membrane boundaries. Some nuclei were extruded and displaced from the cell centre; mitochondria appeared swollen and partially lysed; and the endoplasmic reticulum was dilated and disorganized. Furthermore, there was an increase in lysosomes and the formation of autophagic vesicles that bind to lysosomes, as well as the fusion of autophagic vesicles (Figure 4B–F).
2.3. Expression of lamp2 in Different Tissues of Half-Smooth Tongue Sole
The expression of lamp2 in nine healthy tissues of half-smooth tongue sole was analyzed using qRT-PCR. The results indicated that lamp2 was expressed in the muscle, heart, gill, intestine, spleen, head kidney, liver, brain, and blood. As can be seen in Figure 5, the relative expression of the lamp2 gene was highest in blood and lowest in muscle (p < 0.01).
2.4. Expression of lamp2 in Tissues Stimulated with V. vulnificus
Following V. vulnificus injection, the differential expression of lamp2 in gill was observed. At 24 h post-injection, lamp2 expression was highest in the 10^5^ CFU/mL group, reaching 5.04 times that of the control group. Significant differences in lamp2 expression were also noted in the 10^8^ and 10^11^ CFU/mL groups compared to the control. At 48 h, significant differences in lamp2 expression were observed between all experimental groups and the control. At 72 h, a significant difference was found between the 10^8^ CFU/mL and the control. Furthermore, our analysis revealed significant downregulation of lamp2 expression between 24 and 48 h (p < 0.001) and between 24 and 72 h (p < 0.001) across all experimental groups (Figure 6A).
The relative expression level of lamp2 in the spleen following V. vulnificus injection demonstrated significant upregulation in the 10^5^ CFU/mL group at 24, 48, and 72 h, with fold changes of 3.86, 1.86, and 16.17, respectively, compared to the control group. At 48 and 72 h, the expression levels in the 10^8^ and 10^11^ CFU/mL groups were not significantly different from the control group (p > 0.05). Additionally, the relative expression level in the 10^5^ CFU/mL group was considerably upregulated at 72 h, increasing by 73% compared to the control group (p < 0.001). In contrast, the expression of the 10^8^ CFU/mL group was significantly downregulated at both 48 and 72 h (p < 0.01), with reductions of 78% at 48 h and 66% at 72 h compared to 24 h (p < 0.001). Similarly, the expression in the 10^11^ CFU/mL group was significantly downregulated at both 48 and 72 h, with decreases of 71% at 48 h and 80% at 72 h compared to 24 h (p < 0.001) (Figure 6B).
In the head kidney, significant differences in the expression level of lamp2 were observed among the groups at 24 and 48 h. However, the expression level of lamp2 was highly upregulated in the 10^5^ and 10^8^ CFU/mL groups at 24 h, with fold changes of 2.86 and 1.75, respectively, compared to the control group. Moreover, at 48 h, the expression levels of the 10^8^ and 10^11^ CFU/mL groups were significantly lower than that of the control group. The expression of lamp2 was significantly downregulated by 75% at 72 h and 76% at 48 h in the 10^5^ CFU/mL group compared with 24 h (p < 0.001) and by 78% at 48 h and 40% at 72 h in the 10^8^ CFU/mL group compared to 24 h (p < 0.001; p < 0.05). Conversely, in the 10^11^ CFU/mL group, the expression of lamp2 was significantly upregulated by 12% at 72 h compared with 48 h (p < 0.05) (Figure 6C).
The relative expression lamp2 in the blood following V. vulnificus injection indicated high upregulation in the 10^5^ CFU/mL group at 24 h, with levels 4.20 times higher than those in the control group. The expression of lamp2 across all experimental groups was significantly different from that of the control group. Notably, the 10^8^ CFU/mL group exhibited considerable differential expression of lamp2 at 48 and 72 h compared to the other groups. Relative to the 24 h result, the expression of lamp2 in the 10^5^ CFU/mL group was downregulated by 0.78-fold and 0.64-fold at 48 and 72 h, respectively (p < 0.001). At 72 h, the expression was significantly higher than at 48 h. In contrast, the 10^11^ CFU/mL group showed a downregulation of lamp2 by 0.67-fold and 0.64-fold at 48 and 72 h, respectively (p < 0.01; p < 0.001) (Figure 6D).
In the liver, the relative expression of lamp2 at 24 h was significantly different in the 10^5^ and 10^8^ CFU/mL groups compared with the control group. At 48 h, the relative expression levels in the 10^5^ CFU/mL group were significantly different from the control group. No significant difference was observed at 72 h. At 48 and 72 h, the expression of lamp2 was significantly downregulated in the 10^5^ CFU/mL group by 85% and 74%, respectively (p < 0.001), compared to 24 h, and in the 10^8^ CFU/mL group by 79% and 81%, respectively (p < 0.001), compared with 24 h. However, in the 10^11^ CFU/mL group, the expression of lamp2 was significantly downregulated by 55% at 72 h compared with 24 h (p < 0.01; p < 0.05) (Figure 6E).
In the gut, the relative expression of lamp2 at 24 h was significantly different in the 10^8^ and 10^11^ CFU/mL groups compared to the control group, while no significant difference was observed at 48 h. At 72 h, the relative expression level in the 10^11^ CFU/mL group was significantly different from the other groups. Compared to 24 h, the expression of lamp2 was markedly reduced in the 10^8^ CFU/mL group at 48 h (p < 0.01). In the 10^11^ CFU/mL group, lamp2 expression was significantly downregulated by 66% at 48 h (p < 0.001) but showed an upregulation of 28% at 72 h compared to 24 h (p < 0.05). Notably, the expression level was significantly increased by 2.76-fold at 72 h compared with 48 h (p < 0.001) (Figure 6F).
2.5. Expression of the lamp2-Related Genes in Tissues Stimulated with V. vulnificus
No notable distinction in the expression of lc3 was observed in the gills among all experimental groups injected with V. vulnificus at 24 and 48 h. In comparison, at 72 h, the expression of lc3 was markedly reduced in the 10^5^ CFU/mL group (p < 0.01) and the 10^8^ CFU/mL group (p < 0.05). Conversely, the expression of lc3 was significantly upregulated in the 10^11^ CFU/mL group at 72 h compared with the 10^5^ and 10^8^ CFU/mL groups (p < 0.05). The expression of rab7 was significantly upregulated in the 10^8^ CFU/mL group at 24 h (p < 0.05) and in the 10^11^ CFU/mL group at 72 h (p < 0.05). The expression of vamp8 was drastically decreased in the 10^11^ CFU/mL group at 24 h (p < 0.05), and it was significantly downregulated in the 10^8^ CFU/mL group at 24 h (p < 0.05). No significant differences were observed in the expression of atg14, stx17, snap29, ctsd, and ctsb genes (p ≥ 0.05) (Figure 7A–C).
In the spleen of the 10^5^ CFU/mL group, the expression of lc3 was significantly upregulated at 72 h compared with the control group and increased significantly at 72 h compared to 24 and 48 h (p < 0.01). However, in the 10^8^ CFU/mL group, the expression of lc3 was markedly increased at 48 h compared to 72 h and the control group (p < 0.01). In the 10^11^ CFU/mL group, lc3 expression was drastically decreased at 72 h compared to 24 h (p < 0.05) and significantly upregulated at 48 h (p < 0.05). In the 10^8^ CFU/mL group, the lc3 was substantially raised at 48 h (p < 0.05) and markedly reduced at 72 h in contrast with 24 h (p < 0.05). The expression of rab7 in the 10^8^ CFU/mL group was significantly downregulated (p < 0.05) at 48 h, while in the same group, it was substantially raised at 24 h and downregulated at 72 h. In the 10^11^ CFU/mL group, rab7 expression was drastically decreased at 48 h compared with the control group. The snap29 expression was substantially elevated in the 10^11^ CFU/mL group at 24 h in contrast with the control group. In the 10^11^ CFU/mL group, the expression of ctsd was significantly decreased at 48 h (p < 0.01), while there were no significant differences in the expressions of atg14, stx17, and ctsb (p ≥ 0.05) (Figure 7A–C).
In the head kidney, the expression of rab7 was markedly reduced in the 10^5^ CFU/mL group at 24 h (p < 0.05) and 48 h (p < 0.01) but significantly upregulated at 72 h compared with 24 and 48 h (p < 0.05). In the 10^8^ CFU/mL group, rab7 expression was significantly elevated at 48 and 72 h (p < 0.05). In the 10^11^ CFU /mL group, rab7 expression was significantly decreased at 72 h (p < 0.05). Meanwhile, ctsd expression was significantly upregulated at 48 h (p < 0.01) and markedly increased at 48 h compared with 24 h (p < 0.001). In all experimental groups, there were no significant differences in the expression of the lc3, vamp8, atg14, stx17, snap29, and ctsb genes (p ≥ 0.05) (Figure 7A–C).
In the blood, the expression of lc3 in the 10^5^ CFU/mL group was markedly increased at 24 h compared to the control group (p < 0.05). However, at 72 h, lc3 expression was significantly downregulated compared with 24 h (p < 0.01). Additionally, rab7, atg14, and snap29 were markedly increased at 24 h compared with the control group (p < 0.01) but were markedly reduced at 48 and 72 h relative to 24 h (p < 0.01). In the 10^8^ CFU/mL group, lc3 expression was significantly elevated at 24 and 48 h compared with the control group (p < 0.01), but was markedly reduced at 72 h compared to 24 and 48 h (p < 0.05). In the 10^8^ and 10^11^ CFU/mL groups, rab7 was greatly elevated at 24 h compared to the control group and was significantly downregulated at 48 and 72 h compared with 24 h (p < 0.001). In the 10^11^ CFU/mL group, lc3 expression was significantly increased at 24 and 48 h (p < 0.05) and substantially reduced at 72 h compared with 24 and 48 h (p < 0.001), atg14 expression was significantly upregulated at 24 h, and snap29 expression was markedly increased at 48 and 72 h compared to the control group (p < 0.05) and was consistently upregulated at 48 h and 72 h compared to 24 h (p < 0.01). In contrast, the expressions of vamp8, stx17, ctsd, and ctsb were not significantly different (p ≥ 0.05) (Figure 7A–C).
In the liver of the 10^5^ CFU/mL group, the expression of lc3 was significantly upregulated at 24 h in contrast with the control group (p < 0.05). The expression of rab7 was drastically decreased at 48 and 72 h compared with 24 h (p < 0.05). Snap29 and ctsd were considerably downregulated at 48 h (p < 0.01). In the 10^8^ CFU/mL group, the expression of lc3 was markedly increased at 48 h compared to the control group (p < 0.05), and rab7 expression was significantly upregulated at 24 h and 72 h (p < 0.05). In the 10^11^ CFU/mL group, the expression of lc3 was substantially raised at 48 h compared with the control (p < 0.05), rab7 expression was markedly increased at 72 h (p < 0.001), and Snap29 expression was greatly increased at 24 h but was significantly downregulated at 48 h. Ctsd expression was also significantly downregulated at 48 h. The expressions of vamp8, atg14, stx17, and ctsb were not significantly different (Figure 7A–C).
In the gut, ctsb expression was greatly decreased at 48 and 72 h in the 10^8^ CFU/mL group compared with the control group and was drastically lowered at 48 and 72 h compared with 24 h. No significant differences were observed for the expressions of lc3, rab7, vamp8, atg14, stx17, snap29, and ctsd (Figure 7A–C).
2.6. Subcellular Localization of lamp2 Gene
To determine the subcellular localization of lamp2 in vitro, pEGFP-N1 and pEGFP-lamp2 plasmids were transfected into Cynoglossus semilaevis brain cells (CSBCs) and the nuclei were counterstained with DAPI. As shown in Figure 8, green fluorescence was observed in the cytoplasm and nucleus of cells transfected with pEGFP-N1. In contrast, green fluorescence was detected exclusively in cells transfected with pEGFP-lamp2 cytoplasm. These results suggest that lamp2 is a cytoplasmic protein.
2.7. Expression of Relevant Genes in LPS-Stimulated Cells After lamp2 Overexpression and RNAi
2.7.1. Expression of Related Genes After lamp2 RNAi
The RNAi experiments yielded intriguing results regarding the expression patterns of autophagy-related genes in CSBCs across four distinct experimental groups (NC, LPS, LPS + lamp2-siRNA, and lamp2-siRNA) at 2, 4, and 6 h (Figure 9A–H). RT-qPCR analysis reveals that the expression levels of lc3, rab7, vamp8, atg14, snap29, stx17, ctsd, and ctsb were significantly upregulated at various times points in the LPS group compared to the NC group (p < 0.001). Conversely, in the lamp2-siRNA group, the expression of lc3, rab7, vamp8, atg14, and ctsd was significantly downregulated (p < 0.05). Furthermore, the gene expression levels of lc3, rab7, vamp8, snap29, and stx17 were notably downregulated (p < 0.05) at the 4 and 6 h in the LPS + lamp2-siRNA group relative to the LPS group. In contrast, atg14 and ctsd were significantly downregulated only at 4 h (p < 0.05). These findings underscore the dynamic interplay between LPS stimulation and lamp2 gene silencing in modulating autophagy-related gene expression.
2.7.2. Expression of Related Genes After lamp2 Overexpression
To investigate the impact of lamp2 on the expression of autophagy-related genes, including lc3, rab7, vamp8, atg14, snap29, stx17, ctsd, and ctsb. RT-qPCR analysis was conducted on samples from four distinct groups, as depicted in Figure 10A–D. Following transfection of CSBCs with the pcDNA3.1*-lamp2* plasmid, a significant upregulation in the expression levels of lc3, rab7, vamp8, snap29, and stx17 genes was observed in the pcDNA3.1-lamp2 group compared to the NC group (p < 0.01). In contrast, the expression of the atg14, ctsd, and ctsb genes was significantly downregulated (p < 0.01). In the LPS + pcDNA3.1-lamp2 group, the combination of LPS and pcDNA3.1-lamp2 resulted in a synergistic and significant increase in the expression of vamp8, snap29, and stx17 at 2, 4, and 6 h, lc3 at 2 h and 6 h, and rab7 at 4 h and 6 h. These increases surpassed the levels observed in both the NC and LPS groups (p < 0.05). Conversely, the expression of the atg14, ctsd, and ctsb genes was markedly downregulated under these conditions (p < 0.05). These findings underscore the complex regulatory role of lamp2 in modulating the expression of key autophagy genes in response to LPS stimulation.
3. Discussion
The expression of lamp2 in the inflamed human liver was associated with the body’s immune state [17]. In the current study, the expression of lamp2 was significantly upregulated after V. vulnificus infection, and the expression of its upstream and downstream genes also changed significantly. In the context of V. vulnificus infection, Rab7 is a protein that plays a crucial role in the endocytic pathway and is responsible for the uptake and processing of various molecules in cells. It is involved in transporting vesicles from early endosomes to late endosomes and lysosomes; studies have shown that the bacterium can manipulate the host cell’s endocytic pathway by interacting with Rab7 [18]. This interaction allows V. vulnificus to evade the host’s immune response and establish a successful infection. V. vulnificus infection of fish causes autophagy in the form of macroautophagy [19,20], which is mediated by double-membrane autophagosomes that enclose cytosolic cargoes, followed by fusion with late endosomes/lysosomes for degradation [21,22]. Stx17 localized to autophagosomes is essential for autophagosome–lysosome fusion as it interacts with Snap29 and Vamp8 localized to late endosomes/lysosomes. Atg14 localized to autophagosomes enhances autophagic fusion by interacting with the Stx17–Snap29 complex [23]. The upregulated expression of these genes indicates an increase in the number of lysosomes, which is consistent with the results of TEM. It can be hypothesized that the rise in the number of lysosomes in the cells of different tissues after V. vulnificus infection caused cellular autophagy and fused with intracellular autophagosomes to form autophagic lysosomes, which are digested and hydrolyzed by hydrolases in the lysosomes.
In our study, stimulation of CSBCs with LPS led to a marked increase in the expression of key autophagy-related genes, including lc3, rab7, vamp8, atg14, snap29, stx17, ctsd, and ctsb. In a transgenic rainbow trout model, lamp2 gene expression was significantly upregulated in the lysosomal/phagocytic pathway following the tapping assay [24]. Interestingly, treatment with LPS and lamp2-siRNA resulted in a significant downregulation of lc3, rab7, vamp8, atg14, snap29, and stx17, while ctsd and ctsb expression levels were notably upregulated. Conversely, LPS stimulation after lamp2 overexpression showed an upregulation of lc3, rab7, vamp8, atg14, snap29, and stx17, alongside a significant downregulation of ctsd and ctsb. These data indicate that lamp2 has a regulatory function in the expression among these genes. Lamp2 appears to act through the phosphorylation of vamp8 by mTORC1, which negatively regulates autophagy, particularly during the maturation phase of autophagosomes [25]. Vamp8, an R-SNARE protein localized in lysosomes, governs the fusion of autophagosomes with lysosomes. Under autophagy-inducing conditions, mTORC1-mediated phosphorylation of Vamp8 is significantly reduced, while the dephosphorylated form of vamp8 robustly promotes the formation of the Stx17–Snap29–Vamp8 complex [25]. Stx17, an autophagosome-localized Qa protein, along with Snap29 and Vamp8, facilitates the fusion of autophagosomes with lysosomes [26]. The acetylation of Stx17, controlled by HDAC2, influences autophagosome maturation. Furthermore, Stx17 promotes translocation from the Golgi to the pre-autophagic structure (mPAS) through TBK1 phosphorylation [27]. Snap29, a Qbc protein, together with Stx17 and Vamp8, forms a SNARE complex that enhances autophagosome–lysosome fusion, and its O-GlcNAcylation modulates interaction with Stx17 [28]. In a zebrafish model, the assembly and function of the Stx17–Snap29–Samp8 complex were closely associated with autophagy. The RUNDC1 protein was identified as an inhibitory regulator of this complex, impacting the fusion of autophagosomes with lysosomes and the fish’s response to nutrient deficiencies and pathogen infections [29]. The Stx17–Snap29–Vamp8 complex also plays a crucial role in fish immune responses, with bacterial infection activating the STING pathway, which regulates the assembly of Stx17 with the Snap29–Vamp8 complex, thereby affecting autophagic flux and immune responses. This mechanism may be pivotal in fish resistance to bacterial and viral infections [26,30,31]. A synergistic role between Lamp2 and the Stx17–Snap29–Vamp8 complex in autophagy has been proposed, with Lamp2, as a lysosomal membrane protein, being involved in the recognition and fusion process between autophagosomes and lysosomes along with the Stx17–Snap29–Vamp8 complex [32]. Given the significance of autophagy in the cellular clearance of pathogens and maintenance of cellular homeostasis, regulating the Stx17–Snap29–Vamp8 complex may offer new targets for controlling bacterial and viral diseases in fish.
During autophagy, Lamp2 regulates the immune response and both macroautophagy (MA) and molecular chaperone-mediated autophagy (CMA) [33]. As major lysosomal proteases, Ctsd and Ctsb are involved in protein degradation, and Lamp2 may indirectly regulate their activities by affecting lysosomal function [34,35,36]. Under steady-state conditions, Ctsb can cleave the calcium channel Mcoln1/Trpml1 in lysosomes, maintaining the inhibition of the transcription factor TFEB and reducing the expression of lysosomal and autophagy-associated proteins, thus controlling lysosome and autophagosome numbers. Since TFEB is a key transcription factor for lysosomal biogenesis and autophagy, Ctsb, by affecting TFEB activity, may subsequently influence Lamp2 expression and function [35]. Newcastle disease virus (NDV) utilizes the sialidase activity of its HN proteins to hydrolyze sialic acid residues on Lamp1 and Lamp2 glycan chains, leading to deglycosylation and degradation of Lamp1 and Lamp2 by Ctsb within the lysosomal lumen, triggering lysosomal membrane permeability (LMP) and apoptosis. This discovery reveals a direct role for Lamp2 in regulating Ctsd and Ctsb activity by preventing their aberrant release by maintaining lysosomal membrane integrity [37].
Therefore, we hypothesized that the lamp2 gene has earlier and higher expression in the gill, blood, kidney, and liver. In this experiment, we used V. vulnificus for intraperitoneal injection of fish, which causes an autophagic response, thus affecting the expression differences in the lamp2 gene and its upstream and downstream genes in the autophagic pathway. The results of lamp2 gene overexpression and RNA interference experiments hypothesized that lamp2 positively regulated lc3, rab7, vamp8, snap29, and stx17 and negatively regulated ctsd and ctsb.
4. Materials and Methods
4.1. Experimental Fish and Vibrio vulnificus
The half-smooth tongue sole fish were obtained from Tangshan Sheng Ru Aquaculture Company (Tangshan, Hebei, China). The fish were 67.0 ± 10.0 g in body weight and 22.0 ± 3.0 cm in length. Before the experiment, the fish were cultured in aquariums for 2 weeks. The water temperature before and during the experiment was maintained at 23–25 °C. A total of 360 fish were selected for this study, divided into three treatments groups and one control group, with three parallel fish in each group and 30 fish in each parallel group.
V. vulnificus (ATCC 27562) [38] was obtained from the Marine Culture Collection of China (Xiamen, Fujian, China). The culture of V. vulnificus was performed according to the previously described method [11,39].
4.2. V. vulnificus Injection
The concentrations of V. vulnificus injection were set as 1 × 10^5^ CFU/mL, 1 × 10^8^ CFU/mL, and 1 × 10^11^ CFU/mL according to the protocol of Liu et al. [11].
The control group was injected with 100 μL of 1× PBS. At 24, 48, and 72 h after injection, samples of the gill, spleen, head kidney, blood, liver, and gut were collected from each group and quickly frozen in liquid nitrogen for 48 h, then stored at −80 °C.
4.3. Sequence Clone and Analysis
Using the half-smooth tongue sole cDNA sequence sample, we cloned the CDS region of lamp2 using the conventional PCR method [40,41] and head kidney transcriptome. The primers utilized in this study are detailed in Table 1. Homology analysis of lamp2 was conducted using the BLAST program (2.13.0). The ExPASy translate tool (https://web.expasy.org/translate/ (accessed on 20 July 2022) was employed for amino acid sequence analysis, and molecular weights were determined using the Compute pI/Mw software (http://web.expasy.org/protparam/ (accessed on 20 July 2022). Protein structure prediction was performed using the NCBI Conserved Domain program (https://www.ncbi.nlm.nih.gov/Structure/cdd/cdd.shtml (accessed on 22 July 2022). Multiple sequence alignment was carried out using the ClustalX1.83 software, and the data were edited using the END script program. The phylogenetic tree (bootstrap 1000) was constructed using the Neighbor-Joining (NJ) method in the MEGA X software [42].
4.4. qRT-PCR
To understand the expression profile of lamp2 and its associated genes in the experiment, total RNA was extracted using Trizol reagent (Invitrogen, Carlsbad, CA, USA) following the manufacturer’s instructions. The RNA concentration was determined using a microspectrophotometer (Implen, Munich, Germany), and RNA quality was assessed by nucleic acid electrophoresis. The volume required for reverse transcription of 1 µg of RNA was calculated based on the measured RNA concentration. cDNA was synthesised using the PrimeScript™ RT reagent kit with gDNA Eraser (Perfect Real Time) (TAKARA, Kyoto, Japan), and subsequently diluted 5-fold with DEPC water. This was followed by qRT-PCR analysis conducted on the Novogene q225 platform, with primers designed using Primer 5 software at a concentration of 10 µM. Each time point included three replicates. The qRT-PCR reaction system and conditions were based on the study by Liu et al. [11], and the relative expression of the genes was evaluated using the 2^−ΔΔCt^ method [43].
4.5. Transmission Electron Microscopy
The TEM experimental method was adapted from the study of Liu et al. [11]. Head kidney samples from the 10^11^ CFU/mL and PBS groups were fixed overnight in an electron microscopy fixative solution (Servicebio, Wuhan, China) and protected from light exposure. Subsequently, the samples were sent to Servicebio Biotech (Wuhan, China) for observation under the transmission electron microscope.
4.6. Subcellular Localization
In reference to the research by Guo et al. [44], CSBCs were cultured in 12-well plates until they reached 70–90% confluence for subcellular localization studies. Plasmid–lipid complexes were prepared according to the protocol provided by GeticoFect 3000 Transfection Reagent (Genetic Biotech, Wuxi, China). Specifically, the plasmids pEGFP-N1 and pEGFP-lamp2, along with the Lipo3000 reagents, were each diluted with Opti-MEM serum-free medium (Gibco, Carlsbad, CA, USA). The two diluents were then combined and incubated at room temperature for 15 min. The mixture was distributed evenly among the cells, which were incubated at 23 °C for 4 h. After this incubation period, the medium was replaced, and the cells were further incubated for 24 h. Following this, the medium was discarded, and the cells were washed with PBS and fixed with 4% PFA for 30 min. The cells were then washed twice with PBS for 10 min each. Nuclei were stained with DAPI for 10 min and rinsed with PBS in the dark five times. Finally, the cells were examined using a fluorescent microscope (Leica, Vizla, Germany).
4.7. Cell Treatments
The medium was changed on the first day of cell culture, and CSBCs were subjected to LPS challenge. Referring to the research of Cheng et al. [45], the experiment consisted of seven groups, each with six replicates: negative control (NC); LPS; lamp2-small interfering RNA (siRNA); lamp2-siRNA + LPS; pcDNA3.1-lamp2 plasmid; and LPS + pcDNA3.1-lamp2. RNA extraction was performed at 2, 4, and 6 h post-treatment.
4.7.1. RNA Interference (RNAi) Experiments
The lamp2-siRNA interfering strand was synthesized by GENCEFE Biotech (Wuxi, China). The sequences of the interfering strands, designated as lamp2-siRNA-F and lamp2-siRNA-R, are presented in Table 1. Following the protocol provided by the GeticoFect 3000 Transfection Kit (Genetic Biotech, Shanghai, China), the lamp2-siRNA and control siRNA reagents were introduced into CSBCs as detailed below: In tube A, 125 μL of Opti-MEM serum-free medium (Gibco, Carlsbad, CA, USA) was mixed with 5 μL of siRNA. In tube B, 125 μL of Opti-MEM serum-free medium was combined with 7.5 μL of Lipo3000 and incubated at room temperature for 15 min. The contents of tube B were then added dropwise to tube A. After 4 h of incubation, the medium was replaced with a complete medium, and the cells were further incubated at 23 °C for 24 h. Subsequently, LPS was added at a concentration of 100 μg/mL to stimulate the cellular response.
4.7.2. Overexpression Experiments
The pcDNA3.1-lamp2 plasmid was synthesized by GENCEFE Biotech. The method described in Section 4.6 for the subcellular localization experiments was followed for the transfection of cell overexpression plasmid. After 4 h, the medium was changed to a complete medium, and 24 h later, LPS (100 μg/mL) was added to stimulate the cellular response. For subsequent studies, eight genes related to the expression of lamp2 were selected: lc3, rab7, vamp8, atg14, snap29, stx17, ctsd, and ctsb. The primer information for these genes is detailed in Table 1.
4.8. Statistical Analysis
We conducted a Shapiro–Wilk test to evaluate the normality of the data distribution, and the results confirmed that the data were normally distributed. Given these findings, we employed one-way ANOVA followed by Tukey’s post hoc test (p < 0.05) to compare the qRT-PCR data. The data are presented as the mean ± standard error of the mean (SEM). For statistical analyses, we utilized R software (version 4.4.0) with the stats package (4.4.0) [46].
5. Conclusions
The present study characterized lamp2 in teleost for the first time and investigated its function in response to V. vulnificus infection. Injection V. vulnificus caused a significant upregulation of lamp2 expression and an increase in the number of phagosomes and lysosomes. Our findings indicate that the abnormal expression of lamp2 in V. vulnificus-injected half-smooth tongue sole may be related to the immune response evoked by V. vulnificus, which affects the differential expression of autophagosome and lysosome fusion-associated proteins.
The reference list from the paper itself. Each links out to its DOI / PubMed record.
- 1Trivedi P.C. Bartlett J.J. Pulinilkunnil T. Lysosomal Biology and Function: Modern View of Cellular Debris Bin Cells 20209113110.3390/cells 905113132375321 PMC 7290337 · doi ↗ · pubmed ↗
- 2Zhang Z. Yue P. Lu T. Wang Y. Wei Y. Wei X. Role of lysosomes in physiological activities, diseases, and therapy J. Hematol. Oncol.2021147910.1186/s 13045-021-01087-133990205 PMC 8120021 · doi ↗ · pubmed ↗
- 3Sachdeva K. Sundaramurthy V. The Interplay of Host Lysoso mes and Intracellular Pathogens Front. Cell. Infect. Microbiol.20201059550210.3389/fcimb.2020.59550233330138 PMC 7714789 · doi ↗ · pubmed ↗
- 4Eriksson I. Wäster P. Öllinger K. Restoration of lysosomal function after damage is accompanied by recycling of lysosomal membrane proteins Cell Death Dis.20201137010.1038/s 41419-020-2527-832409651 PMC 7224388 · doi ↗ · pubmed ↗
- 5Yamamoto T. Nakayama J. Yamamoto Y. Kuroda M. Hattori Y. Ochiya T. SORT 1/LAMP 2-mediated extracellular vesicle secretion and cell adhesion are linked to lenalidomide resistance in multiple myeloma Blood Adv.202262480249510.1182/bloodadvances.202100577234979567 PMC 9043942 · doi ↗ · pubmed ↗
- 6Kain R. Matsui K. Exner M. Binder S. Schaffner G. Sommer E.M. Kerjaschki D. A novel class of autoantigens of anti-neutrophil cytoplasmic antibodies in necrotizing and crescentic glomerulonephritis: The lysosomal membrane glycoprotein h-lamp-2 in neutrophil granulocytes and a related membrane protein in glomerular endothelial Cells J. Exp. Med.199518158559710.1084/jem.181.2.5857836914 PMC 2191894 · doi ↗ · pubmed ↗
- 7Watts C. Lysosomes and lysosome-related organelles in immune responses FEBS Open Bio 20221267869310.1002/2211-5463.1338835220694 PMC 8972042 · doi ↗ · pubmed ↗
- 8Cui L. Zhao L.P. Ye J.Y. Yang L. Huang Y. Jiang X.P. Zhang Q. Jia J.Z. Zhang D.X. Huang Y. The lysosomal membrane protein Lamp 2 alleviates lysosomal cell death by promoting autophagic flux in ischemic cardiomyocytes Front. Cell Dev. Biol.202083110.3389/fcell.2020.0003132117965 PMC 7019187 · doi ↗ · pubmed ↗