Cranial morphology in flying squirrels: diet, shape, and size disparity across tropical and temperate biomes
Álvaro Quesada, Manuel Hernández Fernández, Iris Menéndez

TL;DR
The study examines how diet and biome type influence cranial shape and size in flying squirrels, finding diet-related variations but no significant disparity between tropical and temperate biomes.
Contribution
The study provides new insights into the relationship between diet, cranial morphology, and biome disparity in flying squirrels.
Findings
Diet significantly affects cranial shape and size in flying squirrels.
No statistical differences in shape and size disparity were found between tropical and temperate biomes.
Morphological disparity may be influenced more by extreme dietary niches than by niche quantity.
Abstract
Species richness increases gradually as latitude decreases, however, the explanation for this phenomenon remains unclear. Ecological hypotheses suggest that greater niche diversity in tropical biomes may facilitate the coexistence of a larger number of species. The close relationship between species morphology and ecology can lead to a greater morphological disparity in tropical biomes. In this study, we used 2D geometric morphometric techniques on the ventral view of the cranium of flying squirrels (Pteromyini, Sciuridae) to determine the relationship between diet and cranial morphology and to evaluate if morphological disparity is higher in tropical biomes. The results show that diet has a significant impact on cranial shape and size, with large, wide and robust crania in folivorous and generalist species, while frugivorous species tend towards smaller and narrower crania, and…
Genes, proteins, chemicals, diseases, species, mutations and cell lines named across the full text — each resolved to its canonical identifier and authoritative record.
Click any figure to enlarge with its caption.
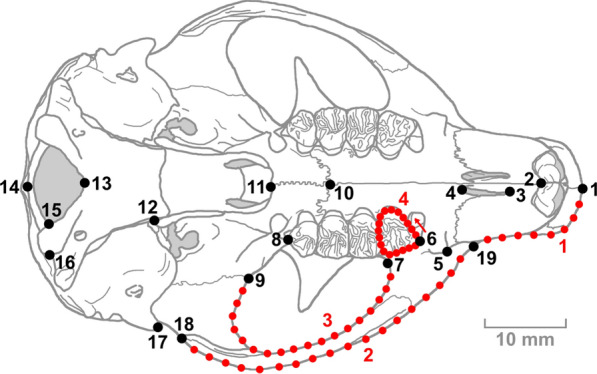 Figure 1
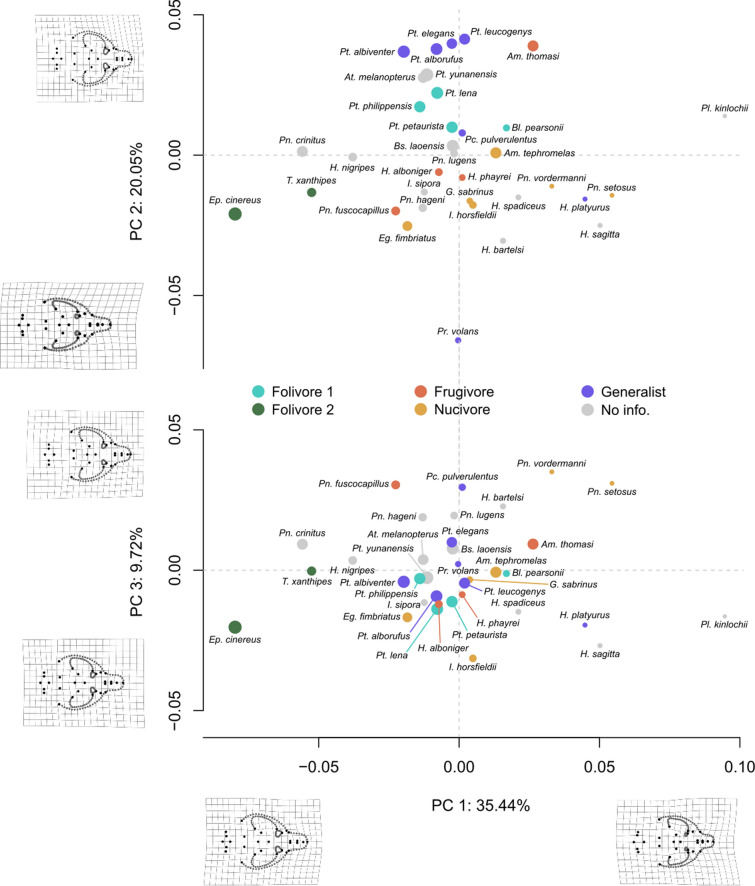 Figure 2
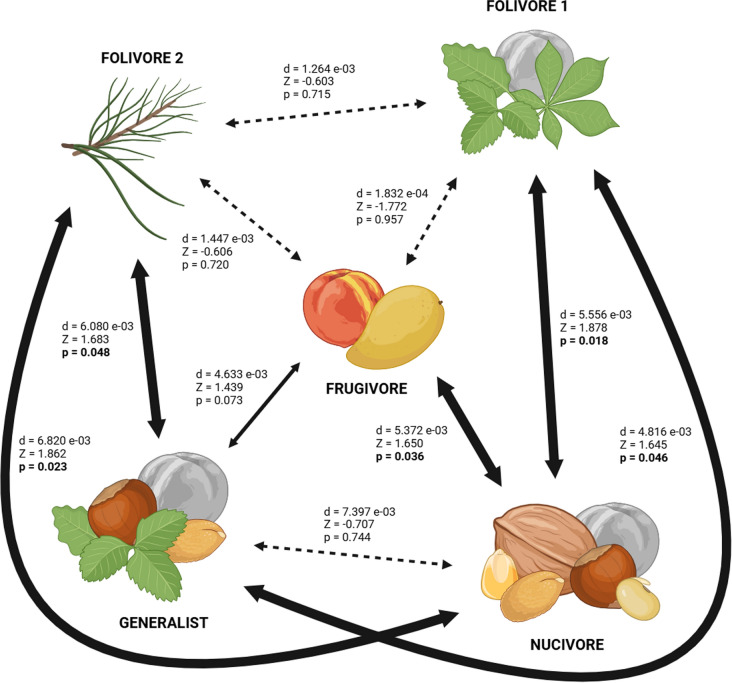 Figure 3
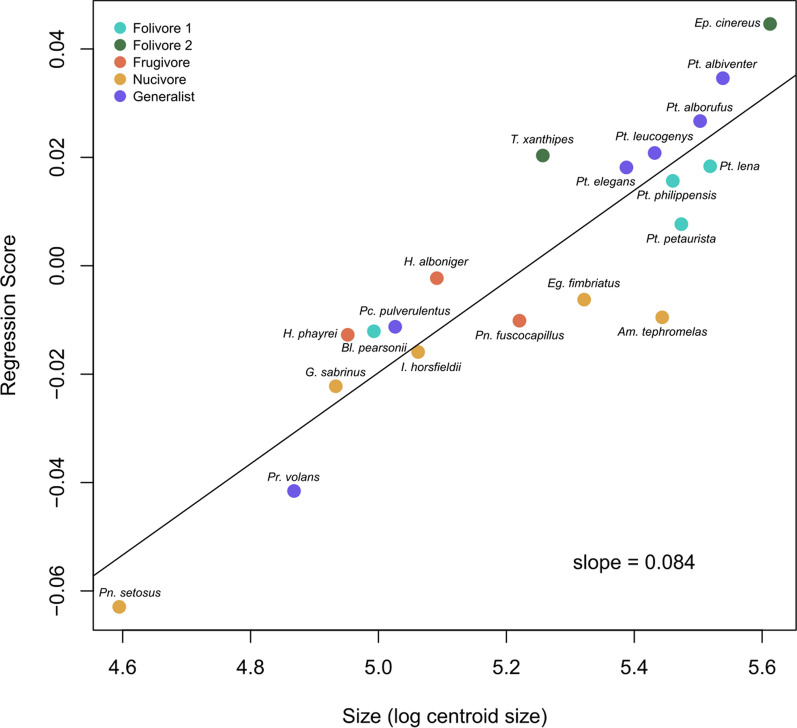 Figure 4
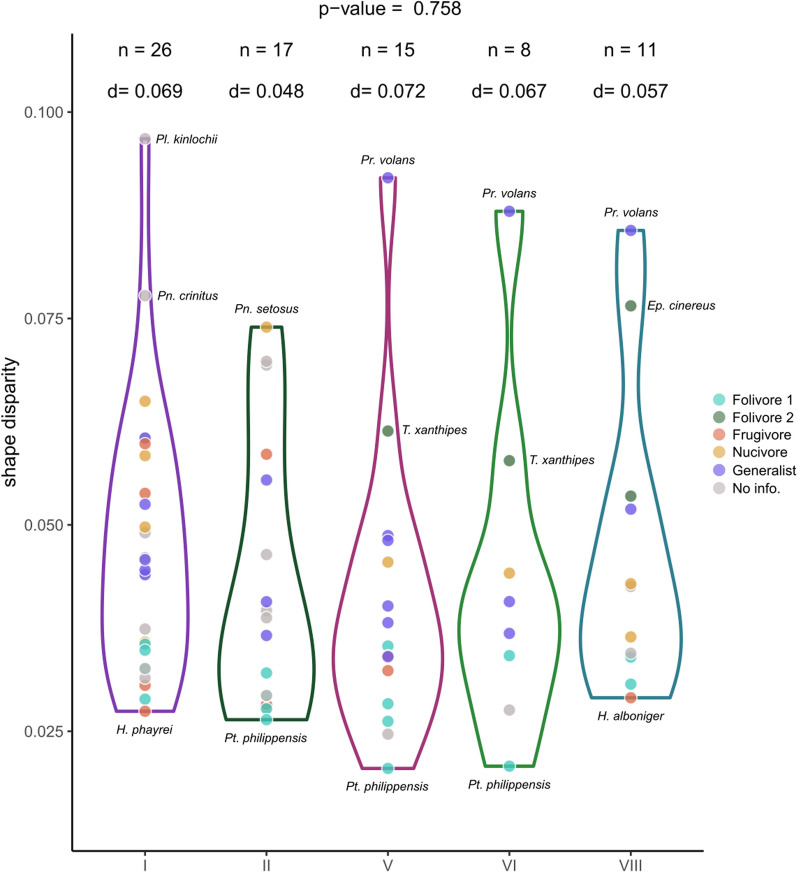 Figure 5
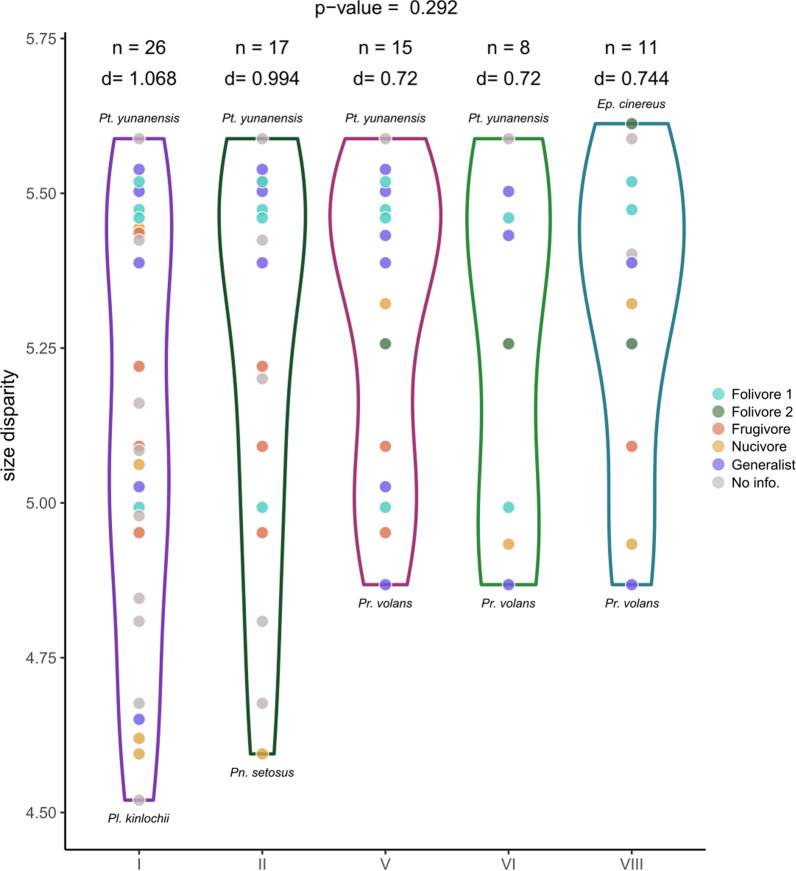 Figure 6
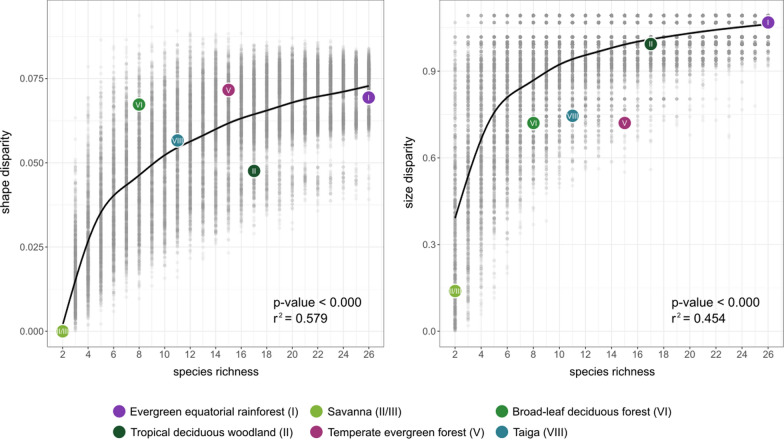 Figure 7
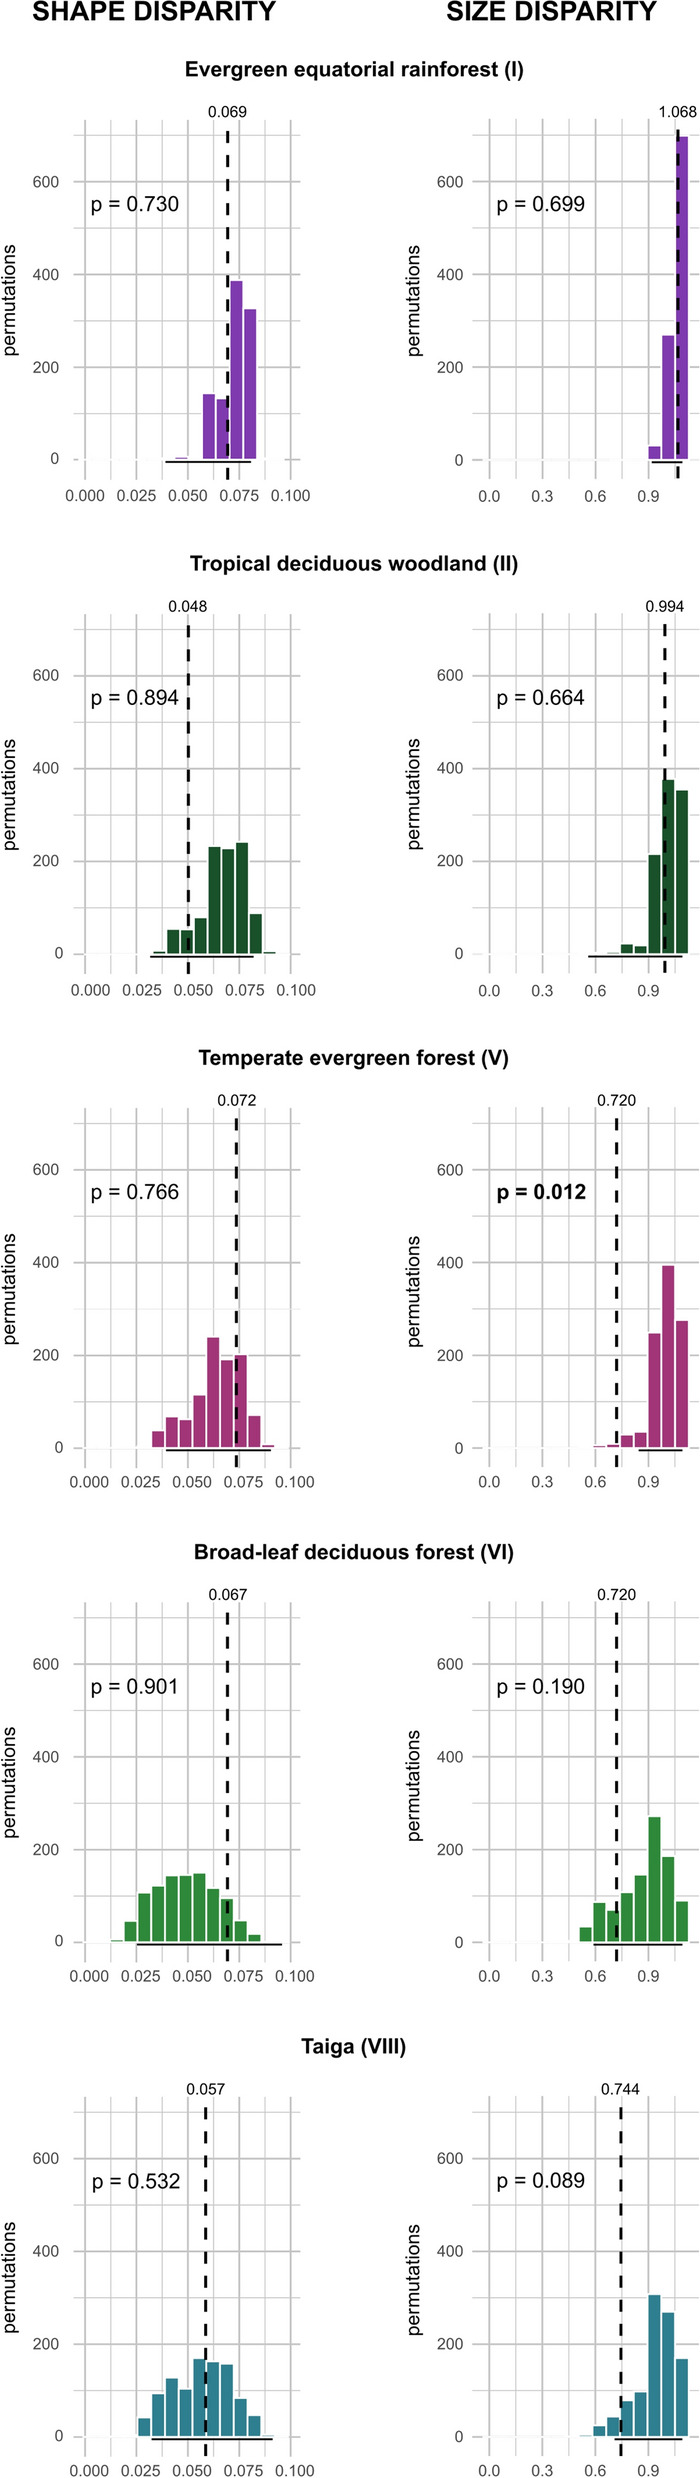 Figure 8
- —http://dx.doi.org/10.13039/100005156Alexander von Humboldt-Stiftung
- —http://dx.doi.org/10.13039/501100002911Universidad Complutense de Madrid
- —Museum für Naturkunde – Leibniz-Institut für Evolutions- und Biodiversitätsforschung (3498)
Peer Reviews
No public reviews on file for this paper yet. If you reviewed it on a platform where reviews are public (OpenReview, ICLR, NeurIPS, ICML), you can paste yours below so the community can read it here.
Videos
No videos yet. Explain this paper in a talk, walkthrough, or lecture? Add one.
Taxonomy
TopicsEvolution and Paleontology Studies · Morphological variations and asymmetry · Animal Ecology and Behavior Studies
Introduction
Biodiversity is not evenly distributed across the planet. Instead, there is a marked latitudinal gradient, with more species richness towards the equator than towards the poles [43, 95, 127]. Furthermore, this trend is recognisable in both hemispheres, in marine and terrestrial species, and in different taxa [60] such as mammals [17, 64], birds [55], insects [40], trees [69] or bacteria [45]. There has been extensive debate on which factors may explain this biogeographic pattern [60, 85]. The multiple proposed hypotheses to explain this phenomenon can be grouped into four types: evolutionary, historical, geographic, and ecological [30, 85]. The evolutionary hypotheses focus on speciation and extinction rates, while historical hypotheses focus on the extension and duration of tropical biomes throughout time. The geographic hypotheses focus on geometric constraints imposed on species ranges, and ecological hypotheses focus on the ecological factors that allow the coexistence of species and the maintenance of their diversity.
One influential ecological hypothesis suggests that tropical habitats offer a greater number of niches for species [75]. This idea proposes that niche packing enables more species to coexist [98, 126], thus increasing the potential for diversification in the tropics. Under this view, we might expect greater ecomorphological differentiation of species living in tropical areas, as species adapt to the exploitation of different resources, a pattern that has been observed in different taxa [24, 61, 70, 99, 109, 115, 120, 125].
Ecomorphological adaptations for the use of different resources can be reflected in bone morphology. For example, vertebrate cranial morphology is greatly related to the food consumed by species [33, 41, 50, 71, 104, 121], which varies in availability along the latitudinal gradient [109, 114]. Additionally, there is a relationship between body size and diet. For example, folivores generally tend to have large body sizes, as plant matter is hard and low in nutrients, this requires longer processing time and the ingestion of large amounts of food [18, 26], which in turn favours having a large gut capacity [27, 35]. Folivores also require more muscular strength for mastication of this hard and abrasive food, which is achieved by having robust masticatory muscles, involving large insertion areas in the jaw and cranium [106]. On the other hand, frugivores are associated with a less robust cranium, since they need less bite force [8]. In addition, some groups usually present small canines and cheek teeth, which contrast with a long incisor tooth row [8, 44], due to the importance of the anterior teeth in these species [44].
A greater diversity of available food resources and niche packing in tropical biomes could therefore generate communities that not only have a greater number of species but also show greater cranial morphology variance than temperate regions. Flying squirrels (Pteromyini, Sciuridae) are a good model to test this hypothesis, as they represent a monophyletic group consisting of 52 species and 14 genera [132] and are present in both tropical and temperate biomes. Most species are distributed in South and Southeast Asia although there are two species endemic to North America (Glaucomys sabrinus y Glaucomys volans) and another (Pteromys volans) which inhabits northern Eurasia [124]. The diet of flying squirrels is highly diverse, for example Eupetaurus cinereus feeds only on pine needles [135], Glaucomys volans is mainly nucivore [88], Glaucomys sabrinus eats lichens and fungi [79], and Iomys horsfieldii is mainly frugivore [54, 89]. Therefore, we expect that cranial shape displays differences depending on the species diet, size and the interaction between these two factors.
The main objective of this study was to assess whether the cranial morphological disparity of flying squirrels in tropical biomes, which offer a greater variety of dietary niches, is higher than what would be expected by chance. In order to do that, we first evaluated the relationship between cranial morphology and diet within the Pteromyini tribe. Once we confirmed this relationship, we assessed whether the observed levels of morphological disparity in each biome differed from the expected values based on their flying squirrel richness. For these purposes, we used geometric morphometrics to measure cranial morphology, which is able to transfer most of the morphological information on the studied taxa to quantitative variables [4, 81, 101, 136], and Monte Carlo simulations to generate aleatory models of the expected disparity for each biome [78].
Materials and methods
Samples
We photographed crania in ventral view of 151 specimens, belonging to 35 extant species of Pteromyini (67,31% of the total number of species), which represent all the 14 genera of the tribe (Table 1). We chose the ventral view because of the presence of the dental row, whose morphology is closely related to diet, and because of the greater availability of anatomical discrete points convenient for their selection for the geometric morphometric analysis with the adequate repeatability, homology, and shape coverage. Photographs were taken by I.M. to specimens from the American Museum of Natural History (AMNH) and from the National Museum of Natural History (USNM). Data of Biswamoyopterus laoensis and Eupetaurus cinereus were obtained from images in the literature with the same orientation [80, 105].Table 1. List of species sampled, number of specimens of each species (N), diet, and occupied biomes. Diet categories (Table 2): Folivore 1 (Fol_1.), Folivore 2 (Fol_2.), Frugivore (Frug.), Nucivore (Nuc.), Generalist (Gen.), no information available (No info.). Biomes follow Walter’s [128] classification: evergreen equatorial rainforest (I), tropical deciduous woodland (II), savanna (II/III), temperate evergreen forest (V), broad-leaf deciduous forest (VI), taiga (VIII). Biomes that do not include any flying squirrel species, such as subtropical desert (III), sclerophyllous woodland and shrubland (IV), steppe/cold desert (VII) and tundra (IX), were omittedSpecieNDietIIIII/IIIVVIVIIIAeretes melanopterus2No info–––––1Aeromys tephromelas4Nuc1–––––Aeromys thomasi1Frug1–––––Belomys pearsonii2Fol_111–11–Biswamoyopterus laoensis1No info–1––––Eoglaucomys fimbriatus8Nuc––11–1Eupetaurus cinereus1Fol_2–––––1Glaucomys sabrinus10Nuc––––11Hylopetes alboniger7Frug11–1–1Hylopetes bartelsi1No info1–––––Hylopetes nigripes4No info–1––––Hylopetes phayrei6Frug11––––Hylopetes platyurus7Gen1–––––Hylopetes sagitta8No info11––––Hylopetes spadiceus10No info11––––Iomys horsfieldii1Nuc1–––––Iomys sipora1No info1–––––Petaurillus kinlochii4No info1–––––Petaurista albiventer1Gen11–1––Petaurista alborufus5Gen11–11–Petaurista elegans3Gen11–1–1Petaurista lena3Fol_111–1–1Petaurista leucogenys6Gen–––11–Petaurista petaurista10Fol_111–1–1Petaurista philippensis5Fol_111111–Petaurista yunanensis5No info11–111Petinomys crinitus3No info11––––Petinomys fuscocapillus3Gen11––––Petinomys hageni2No info1–––––Petinomys lugens4No info1–––––Petinomys setosus4Nuc11––––Petinomys vordermanni6Nuc1–––––Pteromys volans6Gen–––111Pteromyscus pulverulentus5Gen1––1––Trogopterus xanthipes2Fol_2–––111 Total 1512617214811
Diet categorization
The most abundant food components in the flying squirrels’ diet are leaves, fruits, nuts and seeds. Depending on the presence or absence of these foods in the diet, we determined five diet categories (Table 2). Because both leaves and nuts/seeds are more abrasive than fruits, and food abrasiveness probably has a relevant incidence on cranial morphology, we defined folivorous, nucivorous and generalist diets by the presence or absence of these two more demanding food items, although they may also include fruits. Frugivores, on the contrary, were defined by the exclusive consumption of flesh fruits. Information about the diet of each squirrel species (Table 1) was obtained from Koprowski et al. [66] and has been completed with the literature listed in Table S1.Table 2. Description of the diet categories. The categories assigned to the sampled species can be seen in Table 1Diet categoriesDescriptionFolivore 1Diet that includes leaves and sprouts but not nuts and hard seedsFolivore 2Diet based mainly on very abrasive leaves (e.g. conifer needles) but not nuts and hard seedsFrugivoreDiet based mainly on flesh fruit but not nuts, seeds or leavesNucivoreDiet that includes hard seeds and/or nuts but not leavesGeneralistDiet that includes leaves, hard seeds and/or nutsNo infoNo information available
Biome occupancy
To determine the biome occupancy of each species, we used the biome classification of Walter [128], shown in Table 1. We used the species distribution collected in Koprowski et al. [66], and the biomes distribution mapped by Allué Andrade [6]. Following Hernández Fernández [57], if 15% or more of the species distribution was within a biome, we considered that that species inhabits that biome. Furthermore, if the species distribution occupied 50% or more of a climatic dominion, it was also considered to occupy the corresponding biome. Following Hernández Fernández [57], a climatic dominion is a continuous terrestrial area within one climate zone only. For instance, the equatorial rainforest biome present in Africa consists of two different climatic dominions, the central area of the Congo River Basin and the western coast of the Gulf of Guinea [37, 128]. Finally, we also considered the sequence of altitudinal vegetation belts in mountain areas, which is analogous to the latitudinal distribution of biomes [86].
Cranial shape and size
The placement of landmarks and semilandmarks was carried out using the StereoMorph package in the R environment [91, 97]. We selected 19 landmarks in the cranium and semilandmarks forming four curves (Fig. 1, Table 3) based on previous schemes [19, 20, 74, 93]. To accurately capture the morphology of these curves, we placed 8 semilandmarks for curve 1 and 18 for curves 2, 3 and 4. Curve 1 represents the contour of the premaxilla, which varies in some squirrels genera due to the insertion of the masseter muscles [123], and whose length has been related to the type of diet in other groups of herbivorous mammals [63, 87, 112, 121]. Curves 2 and 3 describe the internal and external curve of the zygomatic arch, where the masseter muscles (deep masseter and zygomaticomandibularis are inserted. These muscles are particularly relevant in mastication in squirrels, along with the superficial masseter, which is inserted in the masseter tubercle [10, 31, 32, 123]. Although the temporalis muscles cross through the zygomatic fossa to insert into the coronoid process, the space they occupy is very small [10, 123] and their role in mastication is mainly the stabilisation of the mandible [32]. Finally, curve 4 constitutes the outline of the fourth upper premolar (P4), which has the best orientation in the ventral view of the cranium, since the occlusal surfaces of the other teeth are slightly oblique. As the cranium is a bilaterally symmetrical structure, landmarks and curves were recorded only on one side of the cranium to avoid redundant information that could introduce error [65], and then we made a specular duplication of landmarks and semilandmarks to create the complete cranial structure. This avoids obtaining differences between species due to differences in the bilateral symmetry of the crania caused by measurement error or individual variation [65].Fig. 1. Landmarks (black points) and semilandmarks (red points) on a cranium of Petaurista lena in ventral view. See Table 3 for the definition of each of themTable 3Numeration and definition of the landmarks and the curves used in this work (Fig. 1)LandmarkDefinition of the landmark1Anterior (mid-sagittal) point of the premaxilla2Midpoint of the tooth sockets of the incisors3Anterior end of the incisor foramen4Posterior end of the incisor foramen5Tip of the masseter tubercle6Anterior end of the fourth upper premolar7Maximum curvature at the internal zygomatic arch8Posterior end of tooth row9Anterior end of the suture between the alisphenoid and the squamosal zygomatic process10Suture between maxilla and palatine in the mid-sagittal plane11Posterior end of the suture between right palatine and left palatine12Pterygoid apophysis13Anterior end of the edge of the foramen magnum14Posterior end of the edge of the foramen magnum15Point of crossing between the occipital condyle and the internal edge of the foramen magnum16Outermost point of the occipital condyle17Anterior tip of the external auditory meatus18Posterior tip of the zygomatic arch19Point of the rostrum furthest from the sagittal plane along the suture between the premaxilla and maxillaCurve 1Curve delimiting the snout, between landmarks 1 and 19 (8 semilandmarks)Curve 2Outer curve of the zygomatic arch, between landmarks 19 and 18 (18 semilandmarks)Curve 3Inner curve of the zygomatic arch, between landmarks 7 and 9 (18 semilandmarks)Curve 4Curve along the contour of the fourth upper premolar in a counterclockwise direction (18 semilandmarks)
To remove differences in position, scale, and orientation among the cranial configurations, we performed a Generalised Procrustes Analysis [15] sliding semilandmarks under the minimising bending energy criterion [48]. This analysis was carried out using the R package geomorph [3].
Centroid size was taken as the measure of the size of each cranium [14]. We log-transformed this variable so that it had a normal distribution. Finally, we calculate the mean shape and size of each species, which we used to carry out the statistical analysis.
In order to generate a morphospace of the cranium of flying squirrels, we performed a Principal Components Analysis (PCA) using the function “gm.prcomp” of the geomorph R package [3].
Statistical analysis of cranial morphology
To analyse the effects of diet and cranial size on cranial shape, we performed a phylogenetic least squares analysis (PGLS) adapted to Procrustes variables [1]. We first tested the effect of diet on cranial size and then examined the effects of diet and cranial size on cranial shape, including the interaction term only if the first test was significant. PGLS is a phylogenetic comparative method that considers the phylogenetic relationships between species when analysing multivariate linear relationships [119]. For this analysis, we used the most recent phylogenetic tree published for the group [83], pruned to include only the species with cranial shape data. Cranial shape was represented by landmarks and semilandmarks (Procrustes coordinates), as the use of the PCA scores is discouraged [1]. We used “procD.pgls” function from the R package geomorph [2, 3], which performs a PGLS adapted to shape variables (Procrustes variables). It uses the Procrustes distance (square root of the sum of the squares of the distances between landmarks) between the expected and the observed shape instead of the covariances between variables to establish the statistical parameters (Sum of squares, F-values, or R-squared) [1]. To address the assumption of PGLS that residuals follow a Brownian motion model (with a phylogenetic signal of 1), we adjusted our phylogeny whenever this condition was not met. Specifically, we calculated Pagel’s lambda [92] for the residuals from a non-phylogenetic general linear model using the “procD.lm” function in the geomorph package and the “transformPhylo.ML” function in the motmot package [96]. Based on the estimated lambda, we modified the phylogeny by rescaling branch lengths using the “rescale” function in the geiger package [53] and conducted the PGLS analysis with the rescaled tree.
To test differences in variances of cranial shape among dietary categories, we performed pairwise comparisons of the dispersion around mean shapes using the “pairwise” function of the R package RRPP [29]. Additionally, we performed a PGLS to explore the impact of size alone on cranial shape, and then projected the PGLS shape regression scores on log centroid size to study the allometric variation of cranial shape.
Disparity of shape and size within biomes
We estimated cranial shape disparity of species in each biome, defined as the Procrustes variance (Procrustes distance between the species and the biome mean shape). To do that, we used the function ShapeDist from the package Evomorph which uses Procrustes method for measuring distances between a group of shapes and a reference.
To identify the expected relationship between species richness and both shape and size disparity, we randomly drew 1,000 samples of flying squirrels varying in species richness from two to the maximum richness observed in the biomes (n = 26). Subsequently, we performed a regression analysis to examine whether disparity is dependent on species richness and determine whether the observed disparity in each biome significantly deviated from the expected distribution while maintaining consistent species numbers (i.e., the observed value was outside of the 95% of the expected distribution). For tropical biomes, evergreen equatorial rainforest (biome I) and tropical deciduous woodland (biome II), we tested if the observed disparity was higher than the expected, while for temperate and boreal biomes (biomes V, VI and VIII) we tested if the observed disparity was lower than the expected. Additionally, we conducted a reverse test to rule out the opposite hypothesis. We did this for both shape and size disparity.
All analyses were performed using the R programming language [97] with the aid of the previously cited packages and the ggplot2 package for the generation of all plots [130], all analyses can be found in the supplementary material.
Results
Variations in cranial morphology of the flying squirrels
The three first principal components (PCs) of the PCA defining the cranial morphospace of the flying squirrels explain 65.21% of the variation in cranial shape of the sampled squirrels (Fig. 2). PC1 accounts for 35.44% of this variation. Crania at the negative end of the axis are wide and elongated, with protruding and rounded zygomatic arches that frame a wide zygomatic fossa, an elongated snout, a wide P4, a long tooth row, and a very prominent masseter tubercle (Fig. 2). In contrast, crania at the positive end of the axis have a reduced P4, a shortened tooth row, a shortened snout and less protruding zygomatic arches. As a result, these crania have smaller zygomatic fossa (Fig. 2). Folivorous (type 2) species are situated towards the negative end of PC1 (Fig. 2) and nucivores towards the positive end. Eupetaurus cinereus, which feeds on acicular pine leaves [135], is located at the negative end of the PC1 axis, very close to Trogopterus xanthipes, a folivorous species that mainly feeds on oak and conifer leaves [129]. On the other hand, Petinomys setosus, which feeds on nuts and fruits [28, 89], is the species with a known diet closest to the positive end of the same axis.Fig. 2. Cranial morphospace of the sampled species of the tribe Pteromyini (PC1 x PC2 shown above and PC1 x PC3 shown below). Dot size represents centroid size, and colour represents diet category (Table 2). Grids represent variations in cranial shape associated with the maximum and minimum values of each PC. Generas: Aeretes (At.), Aeromys (Am.), Belomys (Bl.), Biswamoyopterus (Bs.), Eoglaucomys (Eg.), Eupetaurus (Ep.), Glaucomys (G.), Hylopetes (H.), Iomys (I.), Petaurillus (Pl.), Petaurista (Pt.), Petinomys (Pn.), Pteromys (Pr.), Pteromyscus (Pc.), Trogopterus (T.)
PC2 accounts for 20.05% of the variation of the cranial shape (Fig. 2). At the positive end of the axis, species have short and rounded crania, with a very broad snout, large teeth, prominent masseter tubercle, rounded and protruding zygomatic arches, and a wide zygomatic fossa. In contrast, species at the negative end have elongated crania, with sharp snouts, small teeth, less protruding zygomatic arches and with a narrow and elongated zygomatic fossa. The positive section of the PC2 is occupied mainly by generalist and folivorous (type 1) species while other diets are located mainly towards negative values (Fig. 2). One notable exception is Pteromys volans, a generalist species that feeds mainly on leaves, nuts, and seeds [5], which displays a large divergence from the other negative-end species. PC3, in contrast, accounts for a small proportion of the sample’s morphological variation (9.72%). This axis separates crania with subtle differences in dentition size and snout roundness, with larger teeth and more rectangular shapes at the negative end (Fig. 2). In this axis, folivorous (type 1) and generalist squirrels are clustered around the centre of this axis, while nucivorous species diverge towards both ends.
Influence of diet and size on cranial shape
The impact of diet and cranial size on cranial shape is statistically significant, explaining 29.5% and 12.8% of the variation in cranial shape respectively (Table 4). Pairwise comparisons between diets show that, despite their placement in different areas of the cranial morphospace (Fig. 2), both folivore diets do not show statistical differences in cranial shape between them, but they are significantly different from all the other diets, except frugivores, which, in turn, are only distinguishable from nucivores. Finally, there are no significant differences between nucivores and generalists either (Fig. 3).Table 4. Results of Procrustes ANOVA/Procrustes PGLS analyses on the cranial morphology of squirrels of the tribe Pteromyini. Upper table: effect of diet on cranial size (centroid size). Middle table: effect of diet and cranial size (centroid size) on cranial shape. Lower table: effect of cranial size (centroid size) on cranial shape. Df, degrees of freedom; SS, sum of squares, MS, mean sum of squares; r^2^, coefficient of determination; p, significance value (significant p-values are indicated in bold)Size ~ DietDfSSMSr^2^FZpDiet40.0092.2363 e-030.1800.825−0.0660.528Residuals150.0412.7106 e-030.820Total190.050Shape ~ Diet x SizeDiet40.0011.5399 e-040.2952.0322.3830.010Size10.0002.6678 e-040.1283.5212.8170.002Residuals140.0017.58 e-050.507Total190.002Shape ~ SizeSize10.0004.0314 e-040.1934.2983.0550.001Residuals180.0029.379 e-050.807Total190.002Fig. 3Pairwise comparisons of the variances of PGLS values for each diet. d, distance between variances; Z, effect size; p, significance value (significant differences are indicated in bold). Wide solid arrows connect diets that show significant differences, narrow solid arrows connect diets that show marginally significant differences, and narrow dashed arrows connect diets that do not show significant differences between them. Fruits shaded in gray indicate the possibility of being included in the diet despite not being considered in the categorization, as indicated in Table 2
Regarding the impact of cranial size on cranial shape, PGLS regression of cranial shape on log-transformed centroid size is significant (Table 4), indicating the existence of allometric variation (Fig. 4). Folivorous and generalist species, which have the widest snouts, large teeth in a long tooth row, and a very prominent masseter tubercle (Fig. 2), have the largest crania (Fig. 4). The species with medium cranium size feed mainly on fruits and nuts (Fig. 4), and they have shorter and wider crania, with protruding zygomatic arches, a relatively wide zygomatic fossa, and small teeth in a short tooth row (Fig. 2). However, nucivorous species have a wide range of sizes (Fig. 4). The species with the smallest crania are Petinomys setosus and Pteromys volans (Fig. 4), a nucivore and generalist species, respectively, with extreme cranial shapes (Fig. 2).Fig. 4. Allometric relationship between cranial shape (PGLS regression scores) with cranial size of the sampled species of the tribe Pteromyini. Colours represent dietary categories (Fig. 2). Generas: Aeromys (Am.), Belomys (Bl.), Eoglaucomys (Eg.), Eupetaurus (Ep.), Glaucomys (G.), Hylopetes (H.), Iomys (I.), Petaurista (Pt.), Petinomys (Pn.), Pteromys (Pr.), Pteromyscus (Pc.), Trogopterus (T.)
Cranial shape and size disparity across biomes
Regarding shape disparity (Fig. 5), the biome with the greatest disparity is the temperate evergreen forest (V), followed by evergreen equatorial rainforest (I), broad-leaf deciduous forest (VI), taiga (VIII), and tropical deciduous woodland (II). However, we found no statistical differences in shape disparity among biomes (ANOVA, p = 0.758). On the other hand, regarding size disparity, the evergreen equatorial rainforest (I) is the biome with the greatest size disparity, followed by tropical deciduous woodland (II), taiga (VIII), and broad-leaf deciduous forest (VI) and temperate evergreen forest (V), with the same size disparity (Fig. 6). We also found no significant differences among biomes for size disparity (ANOVA, p = 0.292).Fig. 5. Shape disparity of species by biomes. Dots represent species present in each biome coloured by their diet. Y axis represent Procrustes distance to the biome mean. N is the number of species present in each biome. D is the total disparity for each biome. Biomes: evergreen equatorial rainforest (I), tropical deciduous woodland (II), temperate evergreen forest (V), broad-leaf deciduous forest (VI), taiga (VIII). Genus: Eupetaurus (Ep.), Hylopetes (H.), Petaurillus (Pl.), Petaurista (Pt.), Petinomys (Pn.), Pteromys (Pr.), Trogopterus (T.)Fig. 6. Size disparity of species by biomes. Dots represent species present in each biome colored by their diet. Y axis represent Procrustes distance to the mean centroid size. N is the number of species present in each biome. D is the total disparity for each biome. Biomes: evergreen equatorial rainforest (I), tropical deciduous woodland (II), temperate evergreen forest (V), broad-leaf deciduous forest (VI), taiga (VIII). Genus: Eupetaurus (Ep.), Petaurillus (Pl.), Petaurista (Pt.), Petinomys (Pn.), Pteromys (Pr.)
Our simulations show the expected shape and size disparity increase with species richness (Fig. 7). When plotting the observed values of shape disparity of each biome in the simulated relationship we observe that evergreen equatorial rainforest (biome I), savannah (biome II/III), and taiga (biome VIII) have a disparity similar to the expected regression, while that tropical deciduous woodland (biome II) shows lower, and the temperate biomes (V, VI) show higher disparity. As for size disparity, tropical biomes show similar values to the expected regression, but temperate biomes and savannah have lower disparity. However, when tested, we did not find statistical differences of the observed shape and size disparity with the null distribution based on the simulations, except for biome V that showed a significantly lower size disparity than estimated for its species richness and biome VIII shows a marginal statistical significant effect (p = 0.089) in size disparity (Fig. 8). That is, in general the observed disparity is not different than expected for the species richness in each biome.Fig. 7. Regression of shape (left) and size (right) with species richness in 1000 permutations. Coloured dots indicate the observed values for each biomeFig. 8Observed and simulated shape (left) and size (right) disparity for the different biomes. Bars represent the simulated frequencies of shape and size disparity based on species richness in each biome. The horizontal black line shows the 95% confidence interval. The vertical dashed line represents the observed value. p, probability in each biome that the observed morphological disparity is different (higher or lower) than the estimated based on species richness
Discussion
Relationship between cranial shape, diet, and cranial size
Diet has an overall impact in cranial shape in flying squirrels, explaining 36% of the variation in cranial morphology (Table 4), as we can see in other rodents [22, 93, 104]. Additionally, although to a lesser extent, cranial shape also undergoes significant modifications as a function of cranial size (Table 4. These variations in cranial shape and size appear to be mostly associated to differences in the insertion and space requirements of the muscles involved in mastication (deep and superficial masseters as well as zygomaticomandibularis among species with different diets [32, 123].
For example, nucivorous species, which feed mainly on nuts and seeds, need for powerful jaw muscles to open nuts by gnawing with the incisors may be favouring the relative width of the cranium in certain cases, as for example in Petinomys setosus and Petinomys vordermanni (Fig. 2). On the other hand, frugivorous species do not seem to have any tendency towards certain cranial shapes, but have medium cranial shapes, since a fruit-based diet does not require such powerful jaw muscles. However, as has been seen in frugivorous marsupials, bats and primates, a differential preference of species for specific fruits with particular physical properties could determine cranial shape [13, 39]. For example, Hylopetes alboniger, which has medium cranial shape, feeds on different ripened fruits depending on the season, such as Psidium guajava, Neolamarckia cadamba and Ficus curtipes fruits, among others [68]. On the other hand, Petinomys fuscocapillus feeds on fruits from more than 10 different plant species but has a preference for Hydnocarpus pentandra fruits [23], which could condition its cranial shape somewhat further from the mean values of the morphospace. Finally, Aeromys thomasi has a larger, wider and more robust shape, more similar to the folivorous and generalist species (Fig. 2). This could be due to the limited ecological knowledge that exists about this species, since, although it has been described as mainly frugivorous [46] the most recent observations suggest that it could have a more generalist diet [34].
The robust and protruding zygomatic arches of folivorous species (type 1 and 2) allows for the insertion and passage of large and strong muscles, required for a diet based on hard and abrasive plant matter [104, 106]. They also have a prominent masseter tubercle, which provides a larger insertion point for the superficial masseter, one of the muscles that is most involved in mastication in squirrels [32]. The large insertion surface of the chewing muscles in folivorous species is consistent with previous studies in squirrel jaws, which showed that folivorous and herbivorous squirrel species have a mandible with deeper and longer angular process than other squirrels, as well as a reduced coronoid process [21, 118, 137]. This shape is associated with an increase in the relative bite force [118], since it increases the insertion area of the superficial and deep masseters. In addition, not only the diet determines the mandible shape but also the size, independently and jointly [137], as in the case of cranial shape.
Additionally, differences in cranial morphology among dietary groups are also associated to the dentition. For example, folivores exhibit a wide snout that houses a set of large teeth adapted to support this abrasive diet. Folivory generates high dental wear due to both the abrasive nature of cellulose and the low nutritional value of leaves, which require prolonged times of mastication [73, 137]. The necessary energy for a folivorous diet may be compensated through the increase in body size, decreasing their metabolic rate in relation to their body size [82, 107]. Modifications of cranial shape and size such as the ones observed here for the folivorous species of flying squirrels are even more pronounced in other folivorous groups of squirrels (e.g. marmots), whose diet includes grasses that are more abrasive than other types of leaves [131]. Type 2 folivores have a very abrasive diet. On the one hand, Eupetaurus cinereus has an extreme cranial morphology (Fig. 2), and the largest size of all the species analysed (Fig. 4). Additionally, it has developed hypsodont teeth [135] that are larger than expected for its body size [84]. These adaptations are likely related to the hardness and low nutritional value of a diet specialised on conifer needles [51], which requires consuming large amounts of them and causes rapid tooth wear. On the other hand, Trogopterus xanthipes also feeds on abundant conifer needles, although its diet also includes oak leaves [129]. The influence of hypsodonty in both species could also explain the differences in shape between them and type 1 folivores (Fig. 2). The development of hypsodonty in other groups of mammals is a well-known process, especially related to the consumption of grasses, which are also abrasive foods with low nutritional intake [76].
Finally, generalist species mostly have medium shapes in PC1 and PC3 but an extreme cranial shape in PC2 (Fig. 2), as well as large cranial sizes (Fig. 4), with the exception of Pteromyscus pulverulentus, which has medium shape and size. These extreme morphologies differ with the moderate morphological characters found in other omnivorous rodents (i.e. Rattus rattus), with intermediate shapes between herbivores and insectivores and carnivores [104]. Petaurista albiventer, P. alborufus, P. elegans and P. leucogenys have large, wide and rounded crania (Figs. 2 and 4), which could be explained by the predominance of leaves and nuts in their diet, since they need large and strong muscles not only for processing abrasive plant matter but also for opening nuts. A similar pattern has been observed in platyrrhine primates, with omnivorous species having relatively robust skulls and large teeth [8], in prairie dogs, which have extreme dental morphologies related to a diet that includes grass and dry fruits [84], and in ungulates, with omnivorous species having higher bite forces [94]. On the other hand, Hylopetes platyurus, that feeds on leaves, fruit, nuts and insects [47, 89], has one of the smallest and shortest cranium (Fig. 2). Regarding Pteromys volans, it has a small cranium (Fig. 4) and the narrowest and elongated one (Fig. 2), being the only species with these characteristics, associated with an insectivorous diet in other rodents [56, 77, 104]. Although some foods eaten by this flying squirrel are hard and abrasive (i.e. pine needles, nuts), P. volans tends to avoid the harder parts of foods, for example, eating only the mesophyll of the pine needles, buds instead of mature leaves, pine-seeds only at early stages of ripening, or avoiding leave veins [5], which could explain its narrow cranium.
Despite the observable differences in shape between diets (Fig. 2), pairwise comparisons between them show that nucivores and generalists are the only diet with a significantly different cranial shape from the other diets, but not from each other (Fig. 3). All generalist species included in this study feed on nuts, so this suggests that their presence in the diet would have a great impact on the cranial shape of flying squirrels.
Shape and size disparity by biomes
Under the hypothesis of greater disparity in biomes with more niches available we would expect higher disparity in tropical biomes. However, we found no statistical differences in shape disparity among tropical and temperate biomes. In fact, despite the fact that tropical biomes (biomes I and II) have a greater number of squirrel species than temperate biomes (Table 1), we found that the temperate evergreen forest (biome V) has slightly higher shape disparity. Also, although not statistically significant, temperate biomes showed relative high shape disparity above the regression line of the expected disparity for their species richness (Fig. 7), while evergreen equatorial rainforest showed a more similar value to the regression line. Therefore, it appears that tropical biomes have greater disparity in shape just because they have more species, as we did not find more disparity than expected based on their species richness. These results are not consistent with the hypothesis of greater disparity of shape adaptations due to niche packing in tropical biomes. The relatively high disparity in the temperate biomes is mostly produced by the presence of species that feed on pine needles and other harsh leaves, such as Eupetaurus cinereus, Trogopterus xanthipes and Pteromys volans [5, 129, 134, 135]. These species have extreme cranial shapes, related to the functional demands of their diets, which are extremely abrasive and low nutritional [51]. This suggests that the number of available niches might not be determinant in producing high morphological disparity, but the existence of extreme niches which require specific adaptations to exploit them (i.e., folivory) might be more important.
As for the cranial size, we found the opposite pattern, where temperate biomes showed relative lower size disparity compared to the regression line (Fig. 7). This greater disparity in size but not in shape in tropical biomes could be due to the fact that niche partitioning in tropical biomes would occur in size and not in shape, since it is more evolutionarily costly. However, the results also show no significant differences according to the simulations, except for the temperate evergreen forest (biome V), which shows values below the simulated distribution for their species richness (Fig. 8).
The low disparity in size in temperate biomes is mostly due to the absence of an important guild of small species like some species from Hylopetes, the dwarf flying squirrels (Petinomys), and the pygmy flying squirrels (Petaurillus). This could be explained by the relationship that have been observed between the body mass of flying squirrels and glide ratio and distance [36, 62], according to which, the larger their size, the greater the horizontal distance they reach and the greater the glide ratio they have [36, 134]. Furthermore, larger species may achieve higher speeds during gliding, which, coupled with longer glides, would result in less locomotor control during gliding [11, 133]. Because of this, larger species would be better adapted to more open forests, being able to glide longer distances, while smaller species would be better adapted to the middle forest strata (subcanopy and understory), performing shorter and more manoeuvrable glides [116, 117, 122]. This is consistent with a greater presence of small flying squirrels in tropical biomes, as these forests are dominated by trees, lianas and large shrubs, making the mid-upper forest strata (understory, subcanopy and canopy) more dense than in temperate forests [113]. In addition, tree growth in tropical biomes is more clumped, while a more random spatial pattern predominates in temperate forests [9], increasing the required glide horizontal distances.
Conclusions
Cranial shape of flying squirrels (tribe Pteromyini) is highly related with diet through the interaction between food properties and the structure of the masticatory muscular apparatus necessary to process it. A more abrasive and less nutritive diet, as is the case of the folivorous species, requires more powerful masticatory muscles. As a result, the cranium of these species is wider, with wide zygomatic arches, a wide zygomatic fossa, and a prominent masseter tubercle that allows the accommodation of larger muscles. Additionally, there is an allometric pattern, with cranial size independently influencing its shape. This relationship is likely due to the structural requirements (larger teeth) and energy demands (higher consumption and longer shewing time) involved in processing this type of food. Species with more nutritious diets, such as nucivorous or frugivorous, are associated with smaller crania and/or more gracile forms.
Considering that there is a relationship between cranial morphology and diet, we would expect that there would be more morphological disparity in those biomes with more different dietary niches. However, we did not find differences in cranial morphological disparity among tropical and temperate biomes. Tropical biomes appear to have more disparity due to a higher number of species, but this disparity is not greater than what would be expected based on species richness alone. This might indicate that the existence of extreme ecological niches that require specialised adaptations for their exploitation may be more important for generating high morphological disparity than only the number of available niches alone. Moreover, adaptation to different niches by changing body size instead of shape adaptations could also mitigate the amount of shape disparity in biomes with high number of available resources.
Electronic supplementary material
Below is the link to the electronic supplementary material.Supplementary file 1 (XLSX 140 kb)
The reference list from the paper itself. Each links out to its DOI / PubMed record.
- 1Clayton E. Petinomys setosus. The IUCN Red List of Threatened Species 2016. 2016;e.T 16739 A 22241609.
- 2Gerrie R, Kennerley R, Koprowski J. Aeromys thomasi (errata version published in 2017). The IUCN Red List of Threatened Species 2016. 2016;e.T 557A 115050074.
- 3Gerrie R, Kennerley R, Koprowski J. Hylopetes platyurus. The IUCN Red List of Threatened Species 2019. 2019;e.T 136262 A 22244459.
- 4Mc Kenna MC. Eupetaurus and the living petauristine sciurids. Am Mus Novit. 1962;2104.