Diabetes mediates an inverted L-shaped association between cardiometabolic index and kidney stones: a cross-sectional study from NHANES 2007-2020
Jinghui Bi, Jianwei Du, Xiaoyi Yan, Rongxin Chen

TL;DR
Higher cardiometabolic index is linked to more kidney stones, with a stronger connection in people with diabetes.
Contribution
This study reveals a non-linear relationship between cardiometabolic index and kidney stones, modified by diabetes.
Findings
CMI was positively associated with kidney stone incidence (OR: 1.07, 95%CI: 1.02-1.12).
The highest CMI quartile had a 50% higher kidney stone incidence than the lowest quartile.
Diabetes history modified the CMI-kidney stone relationship (p < 0.05).
Abstract
Kidney stones are a chronic metabolic disorder. The cardiometabolic index (CMI) is a new and easily accessible measure used to assess metabolic status. However, the relationship between CMI and the incidence of kidney stones remains unclear. Data from the National Health and Nutrition Examination Survey (NHANES) was used in our cross-sectional study. A weighted multivariable logistic regression analysis was conducted to assess the relationship between CMI and kidney stone incidence. Subgroup and restricted cubic spline regression analyses were utilized to confirm robustness and assess the non-linearity of the association between CMI and kidney stone incidence. This study involved 18,043 individuals, of whom 9.89% were diagnosed with kidney stones. After controlling for all covariates, CMI showed a significant positive association with kidney stone incidence (OR: 1.07, 95%CI:…
Genes, proteins, chemicals, diseases, species, mutations and cell lines named across the full text — each resolved to its canonical identifier and authoritative record.
Click any figure to enlarge with its caption.
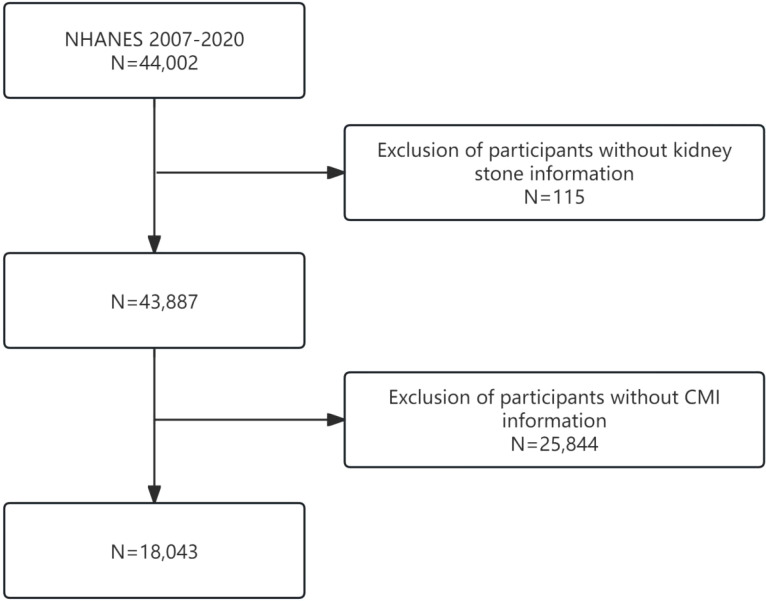 Figure 1
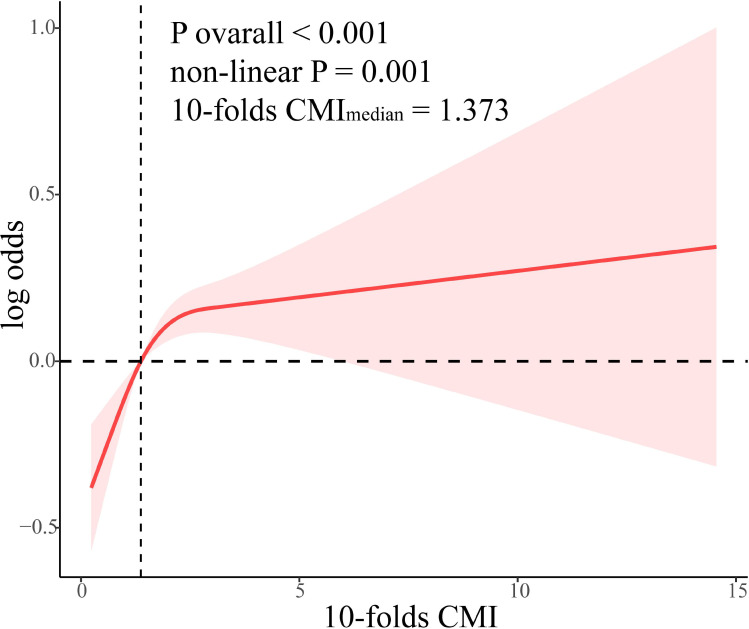 Figure 2
| Total | Q1 | Q2 | Q3 | Q4 | P | |
|---|---|---|---|---|---|---|
| Age, years | 47.73(0.24) | 43.75(0.43) | 47.32(0.37) | 48.90(0.31) | 51.16(0.34) | <0.001 |
| Sex, n (%) | <0.001 | |||||
| Female | 9295(51.50) | 2602(59.31) | 2358(52.08) | 2292(50.74) | 2043(43.51) | |
| Male | 8748(48.50) | 1862(40.69) | 2157(47.92) | 2249(49.26) | 2480(56.49) | |
| Race, n (%) | <0.001 | |||||
| Mexican American | 2682(8.72) | 373(5.34) | 619(8.36) | 805(10.34) | 885(11.06) | |
| Non-Hispanic Black | 3809(10.51) | 1407(15.73) | 1095(11.69) | 837(9.36) | 470(4.99) | |
| Non-Hispanic White | 7175(66.37) | 1601(64.35) | 1728(66.54) | 1772(64.71) | 2074(69.92) | |
| Other Hispanic | 1954(6.13) | 373(5.46) | 461(5.72) | 566(7.20) | 554(6.20) | |
| Other Race | 2423(8.26) | 710(9.12) | 612(7.68) | 561(8.40) | 540(7.83) | |
| PIR | 3.01(0.04) | 3.22(0.04) | 3.06(0.05) | 2.87(0.05) | 2.87(0.05) | <0.001 |
| Marriage, n (%) | <0.001 | |||||
| Never married | 3929(18.13) | 824(15.33) | 986(18.44) | 1055(19.39) | 1064(19.53) | |
| Married | 10840(64.11) | 2490(61.68) | 2691(63.73) | 2803(64.65) | 2856(66.59) | |
| Widowed | 3265(17.73) | 1148(22.99) | 836(17.83) | 683(15.96) | 598(13.88) | |
| Education, n (%) | <0.001 | |||||
| Less than high school | 1780(5.19) | 240(3.14) | 348(4.21) | 574(6.46) | 618(7.11) | |
| High school | 6586(33.35) | 1441(27.97) | 1638(32.07) | 1732(37.17) | 1775(36.59) | |
| More than high school | 9661(61.42) | 2779(68.89) | 2526(63.72) | 2230(56.36) | 2126(56.30) | |
| CMI | 0.17(0.00) | 0.07(0.00) | 0.11(0.00) | 0.17(0.00) | 0.33(0.00) | <0.001 |
| BMI, kg/m2 | 29.08(0.09) | 24.75(0.10) | 27.91(0.12) | 30.47(0.14) | 33.46(0.17) | <0.001 |
| Alcohol consumption, n (%) | <0.001 | |||||
| No | 4079(18.98) | 840(17.07) | 934(19.64) | 1069(22.71) | 1236(25.58) | |
| Moderate | 8262(51.36) | 2279(63.75) | 2159(57.91) | 2001(54.18) | 1823(53.03) | |
| Heavy | 3299(19.27) | 744(19.18) | 838(22.45) | 854(23.12) | 863(21.38) | |
| Smoking, n (%) | <0.001 | |||||
| Former | 4373(25.55) | 874(22.16) | 998(23.79) | 1139(25.81) | 1362(30.68) | |
| Never | 10081(55.45) | 2815(61.96) | 2586(56.87) | 2478(53.47) | 2202(49.23) | |
| Now | 3575(18.96) | 773(15.88) | 923(19.34) | 921(20.72) | 958(20.10) | |
| Diabetes, n (%) | <0.001 | |||||
| No | 13948(82.71) | 4101(95.15) | 3809(90.42) | 3383(82.31) | 2655(65.47) | |
| Yes | 3921(16.31) | 324(4.85) | 667(9.58) | 1104(17.69) | 1826(34.53) | |
| Hypertension, n (%) | <0.001 | |||||
| No | 10545(63.02) | 3283(78.45) | 2779(66.72) | 2475(59.26) | 2008(46.86) | |
| Yes | 7494(36.96) | 1180(21.55) | 1735(33.28) | 2064(40.74) | 2515(53.14) | |
| Kidney stone, n (%) | <0.001 | |||||
| No | 16318(90.11) | 4188(93.46) | 4129(90.90) | 4062(89.26) | 3939(86.63) | |
| Yes | 1725(9.89) | 276(6.54) | 386(9.10) | 479(10.74) | 584(13.37) | |
| Activity, n (%) | <0.001 | |||||
| Sedentary | 9445(46.04) | 1906(35.37) | 2234(43.96) | 2556(50.31) | 2749(55.12) | |
| Moderate | 4645(28.32) | 1096(26.00) | 1220(29.00) | 1162(28.91) | 1167(29.49) | |
| Vigorous | 3953(25.64) | 1462(38.63) | 1061(27.05) | 823(20.78) | 607(15.39) |
| Total | Non-kidney stone | Kidney stone | P | |
|---|---|---|---|---|
| Age, years | 47.73(0.24) | 47.12(0.24) | 53.28(0.47) | <0.001 |
| Sex, n (%) | <0.001 | |||
| Female | 9295(51.50) | 8515(52.08) | 780(46.26) | |
| Male | 8748(48.50) | 7803(47.92) | 945(53.74) | |
| Race, n (%) | <0.001 | |||
| Mexican American | 2682(8.72) | 2463(8.96) | 219(6.58) | |
| Non-Hispanic Black | 3809(10.51) | 3598(11.10) | 211(5.14) | |
| Non-Hispanic White | 7175(66.37) | 6278(65.43) | 897(74.93) | |
| Other Hispanic | 1954(6.13) | 1748(6.16) | 206(5.87) | |
| Other Race | 2423(8.26) | 2231(8.35) | 192(7.48) | |
| PIR | 3.01(0.04) | 3.01(0.04) | 3.01(0.06) | 0.991 |
| Marriage, n (%) | <0.001 | |||
| Never married | 3929(18.13) | 3477(17.81) | 452(21.09) | |
| Married | 10840(64.11) | 9751(63.67) | 1089(68.31) | |
| Widowed | 3265(17.73) | 3082(18.52) | 183(10.60) | |
| Education, n (%) | 0.894 | |||
| Less than high school | 1780(5.19) | 1603(5.18) | 177(5.35) | |
| High school | 6586(33.35) | 5956(33.32) | 630(33.77) | |
| More than high school | 9661(61.42) | 8744(61.51) | 917(60.88) | |
| BMI, kg/m2 | 29.08(0.09) | 28.89(0.09) | 30.84(0.22) | <0.001 |
| CMI | 0.17(0.00) | 0.16(0.00) | 0.20(0.00) | <0.001 |
| Alcohol consumption, n (%) | 0.001 | |||
| No | 4079(18.98) | 3647(20.70) | 432(25.66) | |
| Moderate | 8262(51.36) | 7500(57.37) | 762(56.84) | |
| Heavy | 3299(19.27) | 3036(21.93) | 263(17.50) | |
| Smoking, n (%) | 0.010 | |||
| Former | 4373(25.55) | 3867(25.09) | 506(29.85) | |
| Never | 10081(55.45) | 9197(55.93) | 884(51.28) | |
| Now | 3575(18.96) | 3241(18.98) | 334(18.87) | |
| Diabetes, n (%) | <0.001 | |||
| No | 13948(82.71) | 12817(84.69) | 1131(73.08) | |
| Yes | 3921(16.31) | 3332(15.31) | 589(26.92) | |
| Hypertension, n (%) | <0.001 | |||
| No | 10545(63.02) | 9756(64.56) | 789(49.11) | |
| Yes | 7494(36.96) | 6558(35.44) | 936(50.89) | |
| Activity, n (%) | <0.001 | |||
| Sedentary | 9445(46.04) | 8439(45.30) | 1006(52.73) | |
| Moderate | 4645(28.32) | 4205(28.24) | 440(29.08) | |
| Vigorous | 3953(25.64) | 3674(26.46) | 279(18.19) |
| Model 1 | Model 2 | Model 3 | ||||
|---|---|---|---|---|---|---|
| OR (95%CI) | P | OR (95%CI) | P | OR (95%CI) | P | |
| 10-folds CMI | 1.17(1.12,1.21) | <0.001 | 1.12(1.08,1.17) | <0.001 | 1.07(1.02,1.12) | 0.006 |
| CMI quartiles | ||||||
| Q1 | ref | ref | ref | |||
| Q2 | 1.43(1.15,1.79) | 0.002 | 1.33(1.06,1.68) | 0.015 | 1.32(1.01,1.73) | 0.042 |
| Q3 | 1.72(1.41,2.10) | <0.001 | 1.50(1.22,1.85) | <0.001 | 1.44(1.13,1.82) | 0.003 |
| Q4 | 2.21(1.82,2.67) | <0.001 | 1.82(1.49,2.23) | <0.001 | 1.50(1.18,1.92) | 0.001 |
| P for trend | <0.001 | <0.001 | 0.001 | |||
| CMI < 1.373 | CMI ≥ 1.373 | P | P for interaction | |
|---|---|---|---|---|
| Age | 0.790 | |||
| <60 | ref | 0.99(0.76,1.28) | 0.923 | |
| ≥60 | ref | 1.27(0.91,1.76) | 0.163 | |
| Sex | 0.999 | |||
| male | ref | 1.07(0.77,1.48) | 0.682 | |
| female | ref | 1.07(0.80,1.43) | 0.636 | |
| BMI | 0.147 | |||
| normal | ref | 1.45(0.92,2.27) | 0.107 | |
| overweight | ref | 0.97(0.70,1.36) | 0.869 | |
| obese | ref | 0.95(0.68,1.33) | 0.779 | |
| Smoking | 0.516 | |||
| never | ref | 1.11(0.84,1.47) | 0.475 | |
| former | ref | 0.93(0.67,1.29) | 0.666 | |
| now | ref | 1.111(0.745,1.657) | 0.601 | |
| Alcohol consumption | 0.092 | |||
| no | ref | 1.00(0.71,1.42) | 0.996 | |
| moderate | ref | 0.98(0.77,1.26) | 0.897 | |
| heavy | ref | 1.49(0.95,2.33) | 0.084 | |
| Diabetes | 0.001 | |||
| no | ref | 0.95(0.76,1.18) | 0.627 | |
| yes | ref | 1.88(1.29,2.74) | 0.001 |
Peer Reviews
No public reviews on file for this paper yet. If you reviewed it on a platform where reviews are public (OpenReview, ICLR, NeurIPS, ICML), you can paste yours below so the community can read it here.
Videos
No videos yet. Explain this paper in a talk, walkthrough, or lecture? Add one.
Taxonomy
TopicsKidney Stones and Urolithiasis Treatments · Pediatric Urology and Nephrology Studies · Renal function and acid-base balance
Introduction
1
Kidney stones, a chronic metabolic disorder, are predominantly characterized by the dysregulation of salt dissolution and precipitation within urine (1, 2). Empirical research has delineated obesity, diabetes, and hypertension as the principal risk factors contributing to stone formation (3). Over the last 50 years, there has been a notable rise in the occurrence of kidney stones. The National Health and Nutrition Examination Survey (NHANES) indicates that the rate of self-reported kidney stones in the U.S. has almost tripled over three decades, increasing from 3.2% between 1976 and 1980 to 8.8% between 2007 and 2010 (4, 5). Similarly, in the United Kingdom, a 63% increase in kidney stone prevalence was observed over a decade, rising from 7.14% in 2000 to 11.62% in 2010 (6). The recurrence rate of kidney stones is notably high, with estimates suggesting a 5-year recurrence rate of up to 50% (7). Furthermore, the economic burden of kidney stones is substantial, with forecasts suggesting that the annual expenditure on kidney stone treatment in the US could surpass $4 billion by 2030 (8). The diagnosis of kidney stones is often elusive and can only be ascertained upon the expulsion, extraction, or radiographic detection of stones within the urinary tract (2). Given the subtle onset and high recurrence rate of kidney stones, the identification of effective biomarkers is imperative for prevention and economic mitigation.
The Cardiometabolic Index (CMI), initially proposed by Ichiro Wakabayashi in 2015 (9). is an innovative marker combining waist-to-height ratio (WHtR), high-density lipoprotein cholesterol (HDL-C), and triglycerides (TG), offering a strong indicator for cardiometabolic risk assessment (10). Further investigations have identified connections between CMI and a range of metabolic disorders, including diabetes, cardiovascular diseases like atherosclerosis and hypertension, and obesity, which are closely related to the formation of kidney stones (11–13). Nonetheless, the relationship between CMI and the occurrence of kidney stones is not well-studied and requires more research.
This research sought to examine the connection between the CMI and the frequency of kidney stones using data from NHANES. The goal is to offer an efficient and accessible biomarker for kidney stone prevention and treatment.
Methods
2
Study population
2.1
The research data is sourced from NHANES, a national cross-sectional study evaluating the nutritional and health status of Americans (14). Comprehensive information is available on the official NHANES website (https://www.cdc.gov/nchs/nhanes). All NHANES studies were approved by the NCHS Research Ethics Review Board, with participants giving written informed consent (15).
This study analyzes data from seven consecutive cycles of the NHANES conducted between 2007 and 2020. The data collection initially comprised 44,002 participants. However, after excluding individuals with missing information on kidney stones (n = 115), the CMI (n = 25,844), and other relevant covariates (n = 7,801), the final individuals consisted of 18,043 participants. A flow chart illustrating the participant inclusion criteria is presented in Figure 1.
Flowchart of our subjects.
Outcome and exposure
2.2
The study’s main outcome measure is the incidence of kidney stones, assessed through participants’ responses to the Kidney Status Questionnaire (KSQ) item, “are you ever had kidney stones?” (variable KIQ026). Participants who answered “yes” were classified as having a history of kidney stones.
The CMI is calculated using the following formula: CMI = TG (mmol/L)/HDL-C (mmol/L) × waist circumference (cm)/height (cm) (9).
Covariates
2.3
This study included several covariates: age, sex, race, poverty-income ratio (PIR), marital status, education level, body mass index (BMI), alcohol consumption, smoking, physical activity, diabetes, and hypertension. Sex was classified as either male or female. Race was categorized as Mexican American, other Hispanic, non-Hispanic white, non-Hispanic black, and other races. Education levels were categorized into three groups: less than high school, high school, and above high school. Marriage was categorized as married, never married, and widowed. Household income was evaluated using the PIR index, representing the ratio of household income to the poverty threshold, adjusted for household size (16). BMI was determined by dividing weight in kilograms by the square of height in meters. Smoking is categorized into three groups: former smokers, who have smoked over 100 cigarettes in their lifetime but do not currently smoke; never smokers, who have smoked fewer than 100 cigarettes; and current smokers, who are actively smoking (17). Alcohol consumption is categorized according to drinking habits: non-drinkers (never drank or quit in the past year), moderate drinkers (< 2 cups/day for men and < 1 cup/day for women), or heavy drinkers (≥ 2 cups/day for men and ≥ 1 cup/day for women) (18).
The 2024 American Diabetes Association (ADA) standards define diabetes through the following criteria: 1) self-reported diagnosis, 2) insulin or oral hypoglycemic medication use, 3) random blood glucose ≥ 11.1 mmol/L, 4) glycated hemoglobin ≥ 6.5%, 5) fasting blood glucose (FPG) ≥ 7.0 mmol/L, or 6) two-hour oral glucose tolerance test (OGTT) blood glucose ≥ 11.1 mmol/L (19). Participants were identified as having high blood pressure if they confirmed being diagnosed by a healthcare professional or reported current use of prescription medication for high blood pressure (20). The American Heart Association guidelines define high blood pressure by averaging systolic and diastolic blood pressure from three measurements taken at rest (21). Participants are classified as having high blood pressure if their systolic blood pressure (SBP) is 140 mmHg or higher and/or their diastolic blood pressure (DBP) is 90 mmHg or higher. The activity was classified into sedentary, moderate (exercising for at least 10 minutes in the past 30 days, causing light sweating or breathing), or vigorous (exercising for at least 10 minutes in the past 30 days, causing heavy sweating or an increased heart rate) (22).
Statistical analysis
2.4
The participants were divided into four groups according to CMI quartiles: Q1 < 0.091, 0.091 ≤ Q2 < 0.137, 0.137 ≤ Q3 < 0.210, and Q4 ≥ 0.210. Continuous variables are shown as averages with standard errors, and categorical variables are represented by frequencies and percentages. Differences in baseline characteristics were calculated using chi-square tests for categorical variables and t-tests or one-way ANOVAs for continuous variables. Three distinct multivariable logistic regression models were used to examine the relationship between CMI and kidney stone incidence. Model 1 did not include any covariate adjustments. Model 2 included adjustments for age, sex, race, and PIR. Model 3 included factors such as age, sex, PIR, race, education, marriage, hypertension, diabetes, alcohol consumption, smoking, and activity. Furthermore, to confirm the robustness and nonlinearity of the association between CMI and kidney stones, we conducted subgroup analyses and restricted cubic spline (RCS) regression analyses.
R software (version 4.3.3) was used for the analyses, with statistical significance determined by a p-value of less than 0.05.
Results
3
Participant characteristics
3.1
Table 1 delineates the baseline characteristics of participants enrolled in the NHANES from 2007 to 2020, categorized by CMI quartiles. The study analyzed 18,034 individuals, with an average age of 47.73 ± 0.24 years. Females comprised 51.50% of the participants, and the prevalence of kidney stones was 9.89%. Participants in Q4 were generally older, predominantly male, non-Hispanic white, had lower income levels, and were more likely to be married compared to those in Q1. They also demonstrated higher educational levels and BMI. Additionally, this group exhibited moderate alcohol intake, non-smoking habits, decreased physical activity, and a higher occurrence of diabetes, hypertension, and kidney stones (p < 0.05).
Table 2 presents the baseline demographic characteristics of participants categorized by their history of kidney stones. Patients with a history of kidney stones tended to be older, male, Non-Hispanic White, married, and exhibited higher BMI and CMI. They also showed moderate alcohol consumption, were never smokers, had a history of hypertension, were non-diabetic, and engaged in reduced physical activity (p < 0.05).
Correlation between CMI and kidney stones
3.2
Table 3 shows the relationship between CMI and kidney stone incidence. Treating CMI as a continuous variable revealed a significant positive correlation with kidney stone incidence in Model 1 (OR: 1.17; 95%CI: 1.12-1.21, p < 0.001). This association remained statistically significant after adjusting for confounding factors (OR: 1.07; 95%CI: 1.02-1.12, p = 0.006). Additionally, when CMI was categorized into quartiles, the results indicated that in Model 3, as CMI levels increased, the ORs of kidney stones were 1.32, 1.44, and 1.50, respectively. This finding suggests that higher CMI levels correspond to an increased incidence of kidney stones (p for trend = 0.001), confirming the statistical significance of this upward trend. Both Model 1 and Model 2 exhibited similar patterns (p for trend < 0.001).
RCS regression
3.3
A dose-response relationship between CMI and kidney stone prevalence was examined using an RCS analysis, revealing a notable nonlinear connection (p non-linear = 0.001). An increase in CMI significantly raises the prevalence of kidney stones. Specifically, the incidence of kidney stones initially rises quickly with increasing CMI levels, and then tends to remain somewhat constant, or increases at a much slower rate once the CMI exceeds 1.373 (Figure 2).
Dose-relationship between CMI and kidney stone.
Subgroup analyses
3.4
Additional subgroup analyses were conducted to assess the impact of different factors on the association between CMI and kidney stone incidence. The factors considered were age, sex, BMI, smoking, alcohol consumption, and diabetes. The findings indicated that significant interactions were only observed for diabetes, with no other interactions reaching significance (p for interaction > 0.05). Age, gender, BMI, smoking, and alcohol consumption did not significantly influence the positive correlation between CMI and kidney stones (p > 0.05). A significant positive association was found in the diabetes subgroup (OR: 1.88, 95%CI: 1.29-2.74, p = 0.001), whereas the non-diabetes subgroup showed no significant association (p > 0.05) (Table 4).
Discussion
4
This research uniquely explores the link between CMI and kidney stone incidence utilizing NHANES data from 2007 to 2020. The findings demonstrate that individuals with kidney stones had elevated CMI levels relative to those without. A significant positive correlation between CMI and kidney stone incidence was observed after adjusting for confounding factors. Additionally, smooth curve fitting analysis revealed the nonlinear relationship between CMI and kidney stones, with an overall upward trend. This finding indicates that CMI could be a useful marker for evaluating kidney stone risk. Finally, subgroup analyses showed that diabetes mediated this positive association.
The CMI integrates obesity and blood lipid levels (WHtR, TG, and HDL-C), serving as a valuable new indicator for assessing diabetes risk (9). Prior studies have shown a correlation between CMI and multiple diseases. Yan et al. examined 2,996 participants, identifying a significant positive correlation between CMI and non-alcoholic fatty liver disease (NAFLD), with a predictive area under the curve of 0.762 (23). Liu et al. identified a significant correlation between body adiposity index (BAI), conicity index (CI), body shape index (ABSI), body roundness index (BRI), visceral adipose index (VAI), and lipid accumulation products (LAP) after adjusting for confounding variables, with a stronger correlation observed between CMI and hyperuricemia (24). A similar study found a positive correlation between CMI and depression, indicating that each unit increase in CMI corresponded to a 36% higher risk of depressive symptoms in the fully adjusted model (10). Notably, patients in the highest CMI quartile exhibited a 62% higher risk of depression compared to participants in the lowest quartile. Likewise, CMI is associated with other conditions, including obstructive sleep apnea and stroke (25, 26). This study examines the link between kidney stone incidence and CMI level variations. The study indicates a significant positive correlation between CMI and kidney stone incidence, even after adjusting for confounding factors, whether CMI is considered a continuous or categorical variable. This study advances the comprehension of risk factors linked to kidney stone formation.
Recent research highlights metabolic disorders as key factors in kidney stone formation (27). These disorders, which encompass overweight/obesity, insulin resistance, diabetes, and dyslipidemia, are particularly associated with abnormalities in lipid metabolism that may facilitate kidney stone development (28–30). Several investigations have demonstrated that dysregulated lipid metabolism can promote stone formation by altering urinary levels of calcium and oxalate, as well as urinary PH (27, 31). This study employed the NHANES database to investigate the link between CMI and kidney stones, identifying a significant positive correlation with the incidence of kidney stones. However, subgroup analyses indicated notable dependence on diabetes and hypertension in this positive relationship, suggesting that the association is more pronounced in patients with these conditions. Torricelli et al. identified a link between dyslipidemia and a heightened risk of nephrolithiasis, independent of other metabolic syndrome factors such as diabetes and obesity (13).
Our study revealed that patients in the kidney stones group exhibited elevated CMI at baseline. To deepen our understanding of the link between lipid parameters and kidney stones and to strengthen the connection to clinical practice, we reviewed prior studies examining the associations between different lipid indices and kidney stones. The WHtR effectively accounts for abdominal obesity and body shape, serving as a low-cost, simple, and efficient measurement index (32). It outperforms BMI and waist circumference in assessing abdominal fat for screening cardiometabolic risk factors (33). Obesity is a recognized independent risk factor for kidney stones (34). Taylor et al. discovered that greater waist circumference and/or higher weight elevated the likelihood of developing kidney stones, with the heightened risk possibly being more significant in women compared to men (35). Furthermore, previous studies have indicated that obesity rates are rising more rapidly among female patients compared to their male counterparts, suggesting that changes in obesity may account for the gender differences observed in kidney stone prevalence (36). Our study found a higher prevalence of kidney stones in women than in men, possibly due to hormonal or lifestyle factors unique to women, contrasting with previous findings. It is recognized as a protective factor against coronary heart disease due to its role in facilitating the removal of excess cholesterol from atherosclerotic plaques and transporting it back to the liver for excretion (37). Gao et al. identified a correlation between low HDL-C levels and a heightened risk of kidney stones in US adults (38). This leads to the hypothesis that decreased HDL-C levels may influence renal blood flow and the calcification process, potentially promoting kidney stone formation. Notably, urinary stones are characterized by elevated levels of TG. Yao et al. utilized the NHANES database to demonstrate that higher TG levels are independently linked to an increased incidence of kidney stones (39). Therefore, enhancing health education for patients with obesity or lipid abnormalities, along with effective management of blood lipid levels, may help reduce the formation of kidney stones and improve overall health.
However, this study has several limitations. As a cross-sectional study, it cannot determine a causal link between CMI and kidney stone incidence. Second, while we have controlled for and eliminated many confounding factors, there may still be additional confounders that could influence the analysis. Furthermore, although this study was conducted on a nationwide scale, the data were primarily derived from America, which may impact the representativeness and generalizability of the findings due to potential sample selection bias. This study identifies potential biomarkers for clinicians by elucidating the link between CMI, lipid metabolism, obesity, and kidney stone risk. This insight can inform adjustments to treatment plans and interventions based on patients’ CMI levels; however, further prospective studies are required to validate these findings.
Conclusion
5
The research shows a notable non-linear connection between CMI and the occurrence of kidney stones, with higher CMI levels linked to more frequent kidney stone cases. Additionally, there is a more notable relationship between CMI and kidney stones in diabetic individuals.
The reference list from the paper itself. Each links out to its DOI / PubMed record.
- 1Gao H Lin J Xiong F Yu Z Pan S Huang Y. Urinary microbial and metabolomic profiles in kidney stone disease. Front Cell infection Microbiol. (2022) 12:953392. doi: 10.3389/fcimb.2022.953392 PMC 948432136132987 · doi ↗ · pubmed ↗
- 2Khan SR Pearle MS Robertson WG Gambaro G Canales BK Doizi S. Kidney stones. Nat Rev Dis Primers. (2016) 2:16008. doi: 10.1038/nrdp.2016.8 27188687 PMC 5685519 · doi ↗ · pubmed ↗
- 3Hao X Shao Z Zhang N Jiang M Cao X Li S. Integrative genome-wide analyses identify novel loci associated with kidney stones and provide insights into its genetic architecture. Nat Commun. (2023) 14:7498. doi: 10.1038/s 41467-023-43400-1 37980427 PMC 10657403 · doi ↗ · pubmed ↗
- 4Stamatelou KK Francis ME Jones CA Nyberg LM Curhan GC. Time trends in reported prevalence of kidney stones in the United States: 1976-1994. Kidney Int. (2003) 63:1817–23. doi: 10.1046/j.1523-1755.2003.00917.x 12675858 · doi ↗ · pubmed ↗
- 5Scales CD Jr.Smith AC Hanley JM Saigal CS. Urologic Diseases in America, Prevalence of kidney stones in the United States. Eur Urol. (2012) 62:160–5. doi: 10.1016/j.eururo.2012.03.052 PMC 336266522498635 · doi ↗ · pubmed ↗
- 6Turney BW Reynard JM Noble JG Keoghane SR. Trends in urological stone disease. BJU Int. (2012) 109:1082–7. doi: 10.1111/j.1464-410X.2011.10495.x 21883851 · doi ↗ · pubmed ↗
- 7Fink HA Wilt TJ Eidman KE Garimella PS Mac Donald R Rutks IR. Medical management to prevent recurrent nephrolithiasis in adults: a systematic review for an American College of Physicians Clinical Guideline. Ann Intern Med. (2013) 158:535–43. doi: 10.7326/0003-4819-158-7-201304020-00005 23546565 · doi ↗ · pubmed ↗
- 8Balawender KŁuszczki E Mazur A Wyszyńska J. The multidisciplinary approach in the management of patients with kidney stone disease-A state-of-the-art review. Nutrients. (2024) 16:1932. doi: 10.3390/nu 16121932 38931286 PMC 11206918 · doi ↗ · pubmed ↗