Annual Estimation of Seasonal Influenza Burden in 6 South American Countries: A Retrospective Analysis of SARInet Surveillance Data to Inform Policies
Miguel Angel Descalzo, Francisco José de Paula Júnior, Natalia Vergara Mallegas, Elena Penayo, Carla Voto, Natalia Goñi, Alfredo Bruno, Walquiria Aparecida Ferreira da Almeida, Greice Madeleine Ikeda do Carmo, María Fernanda Olivares Barraza, Rodrigo Fasce, Jorge Pacheco

TL;DR
This study estimates the annual impact of seasonal influenza in six South American countries from 2015 to 2019, showing millions of illnesses, hospitalizations, and deaths.
Contribution
The study provides the first comprehensive influenza burden estimates for six South American countries using a multiplier method and surveillance data.
Findings
Influenza caused 51 to 78 million mild-to-moderate illnesses annually in the six countries.
Hospitalizations ranged from 323,379 to 490,049 per year.
Annual deaths ranged from 22,662 to 46,971 due to influenza.
Abstract
We estimate annual viral influenza-associated mild-to-moderate illness, hospitalizations, and deaths in 6 South American countries (Argentina, Brazil, Chile, Ecuador, Paraguay, and Uruguay) during the 2015–2019 influenza seasons as a first step in evaluating the full value of influenza vaccination in the subregion. We applied a multiplier method using monthly hospital discharge and vital statistics death records, influenza surveillance data, and population projections to estimate mild-to-moderate influenza-associated illness, hospitalizations, and deaths. We estimated the uncertainty bounds based on the 2.5th and 97.5th percentiles of the Monte Carlo simulated distributions for the number of cases and obtained the ranges from the minimum value of the 2.5th and the maximum value of the 97.5th percentile. In selected countries with a total population of 307 million people, the yearly…
Genes, proteins, chemicals, diseases, species, mutations and cell lines named across the full text — each resolved to its canonical identifier and authoritative record.
Click any figure to enlarge with its caption.
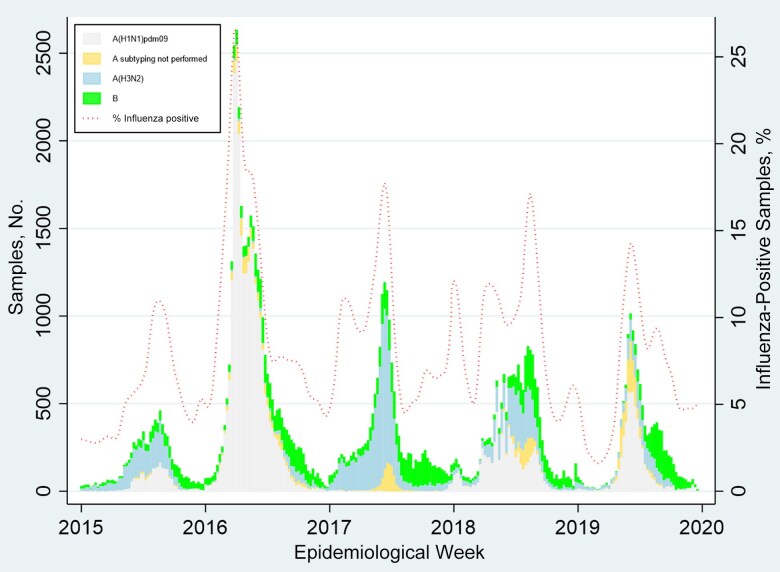 Figure 1
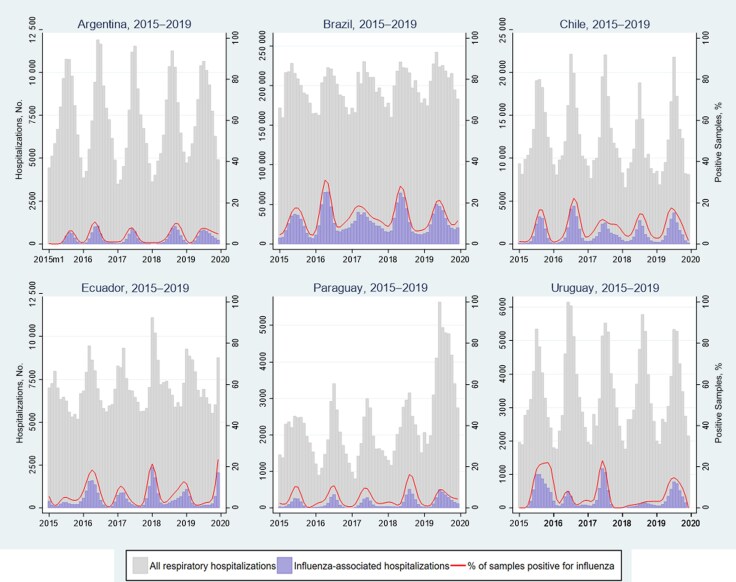 Figure 2
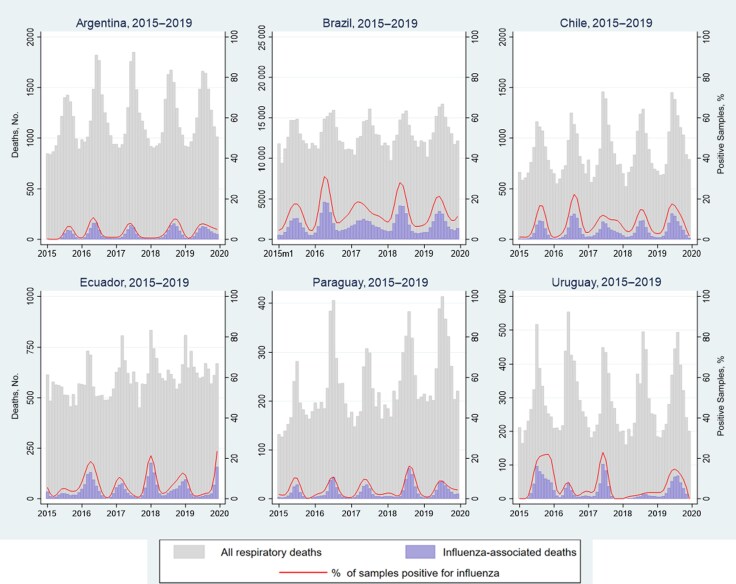 Figure 3
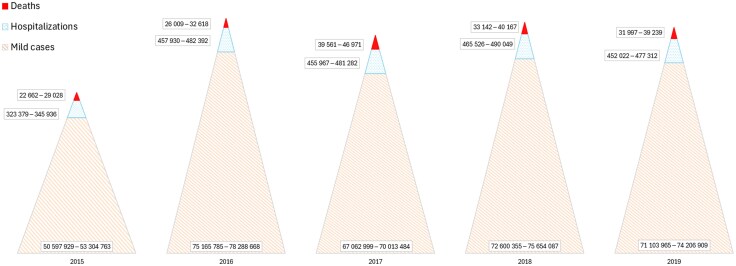 Figure 4
| Country | Influenza Transmission Zone | Total Population, Millions | Proportion of Population by Age Group, % | Source of Data | Diagnostics Used | Annual Value, Mean (SD) | |||||||||
|---|---|---|---|---|---|---|---|---|---|---|---|---|---|---|---|
| <5 y | 5–64 y | ≥65 y | Hospital Discharge Codes | Mortality Data | Virologic Data | Respiratory Samples Tested, No. | Proportion of Samples Positive for Influenza, % | Respiratory Hospitalizations, No. | Proportion of Respiratory Hospitalizations | Deaths, No. | Proportion of Respiratory Deaths, % | ||||
| Argentina | Temperate South America | 45.6 | 8.8 | 81.4 | 9.8 | All hospitals; catchment area 100% of population | Directorate of Health Statistics and Information–Vital Statistics | Inpatient and outpatient specimens | RT-PCR and immunofluorescence assay | 24 180 (4291) | 5.4 (1.2) | 782 389 (37 456) | 11.2 (0.5) | 92 299 (2207) | 15.6 (0.5) |
| Brazil | Tropical South America | 214.0 | 7.1 | 83.4 | 9.5 | All federally supported hospitals; catchment area 75% of population; primary discharge diagnoses considered | Mortality Information System | Inpatient specimens | RT-PCR and immunofluorescence assay; 10% of negative samples by immunofluorescence assay are retested with RT-PCR | 48 402 (19 500) | 16.5 (3.9) | 12 901 422 (402 354) | 18.5 (0.1) | 1 307 715 (30 881) | 11.9 (0.1) |
| Chile | Temperate South America | 19.2 | 6.3 | 81.9 | 11.8 | All public and private hospitals; catchment area 100% of population primary discharge diagnosis considered | Department of Health Statistics and Information | Inpatient specimens | RT-PCR and immunofluorescence assay | 5314 (493) | 12.4 (1.4) | 1 656 450 (17 621) | 9.0 (0.8) | 104 415 (5422) | 10.1 (0.5) |
| Ecuador | Tropical South America | 17.9 | 9.6 | 83.1 | 7.3 | Catchment area 100% of population | National Institute of Statistics and Census | Inpatient specimens | RT-PCR | 3945 (645) | 10.2 (5.5) | 1 158 557 (25 232) | 7.3 (0.4) | 70 028 (3437) | 10.3 (0.4) |
| Paraguay | Temperate South America | 7.2 | 9.9 | 83.6 | 6.5 | All public and social security hospitals; catchment area 89% of population primary discharge diagnosis considered | General Directorate of Strategic Health Information | Inpatient specimens | RT-PCR and immunofluorescence assay | 6321 (1467) | 8.7 (1.3) | 251 068 (65 763) | 10.8 (0.7) | 30 486 (1611) | 9.1 (1.0) |
| Uruguay | Temperate South America | 3.5 | 6.5 | 79.1 | 14.4 | All hospitals; catchment area 100% of population | Ministry of Health–Vital Statistics | Inpatient and outpatient specimens | RT-PCR | 668 (204) | 13.3 (4.2) | 360 430 (7099) | 11.4 (0.3) | 33 870 (776) | 10.3 (0.5) |
| Measure by Country | All Respiratory Hospitalizations (Range | Influenza-Associated Hospitalizations (Range | ||||||
|---|---|---|---|---|---|---|---|---|
| Age <5 y | Age 5–64 y | Age ≥65 y | All Ages | Age <5 y | Age 5–64 y | Age ≥65 y | All Ages | |
| No. of hospitalizations | ||||||||
| Argentina | 36 858–41 978 | 28 244–32 159 | 16 150–17 084 | 81 822–90 586 | 1385–4615 | 6714–15 055 | 4485–10 517 | 16 138–28 228 |
| Brazil | 340 074–365 551 | 1 618 258–1 773 529 | 345 616–378 349 | 2 313 334–2 506 780 | 13 505–36 421 | 232 694–347 647 | 37 046–85 815 | 285 309–434 327 |
| Chile | 46 301–50 381 | 45 617–60 875 | 35 428–51 417 | 129 610–157 754 | 1400–3376 | 4199–9267 | 4730–9758 | 10 536–20 160 |
| Ecuador | 28 918–33 522 | 30 524–35 334 | 17 201–21 837 | 76 643–90 693 | 601–2648 | 1267–6634 | 857–3952 | 2725–13 234 |
| Paraguay | 9873–21 254 | 6521–13 097 | 4897–9172 | 21 432–43 523 | 219–789 | 472–1127 | 350–853 | 1084–3387 |
| Uruguay | 11 822–14 532 | 13 684–14 730 | 12 947–14 107 | 39 466–43 183 | 202–2128 | 188–2052 | 195–2135 | 585–6315 |
| Incidence per 100 000 population | ||||||||
| Argentina | 2967–3386 | 250–291 | 1168–1401 | 592–671 | 37–124 | 19–42 | 94–227 | 37–63 |
| Brazil | 2311–2491 | 943–1011 | 1944–2046 | 1128–1193 | 92–248 | 136–201 | 208–464 | 140–208 |
| Chile | 3787–4059 | 297–407 | 1567–2483 | 691–878 | 116–274 | 27–62 | 228–471 | 56–106 |
| Ecuador | 1720–2012 | 226–250 | 1551–1788 | 471–533 | 36–159 | 9–47 | 77–324 | 17–78 |
| Paraguay | 1406–3013 | 112–219 | 1139–1964 | 308–608 | 31–112 | 8–19 | 81–190 | 16–47 |
| Uruguay | 5195–6319 | 497–533 | 2673–2853 | 1122–1241 | 89–921 | 7–75 | 39–441 | 17–182 |
| Measure by Country | All Respiratory Deaths (Range | Influenza-Associated Deaths (Range | ||||||
|---|---|---|---|---|---|---|---|---|
| Age <5 y | Age 5–64 y | Age ≥65 y | All Ages | Age <5 y | Age 5–64 y | Age ≥65 y | All Ages | |
| No. of deaths | ||||||||
| Argentina | 181–276 | 2010–2513 | 10 797–12 447 | 13 013–15 002 | 0–85 | 270–1350 | 3268–7384 | 3918–8651 |
| Brazil | 2349–2689 | 30 291–34 869 | 116 084–127 087 | 149 333–161 884 | 43–403 | 4120–8270 | 12 143–27 970 | 16 306–34 444 |
| Chile | 39–58 | 1247–1699 | 8539–9837 | 9847–11 588 | 0–17 | 84–354 | 747–1935 | 852–2204 |
| Ecuador | 310–357 | 1143–1493 | 4936–6139 | 6395–7833 | 0–62 | 23–377 | 209–1128 | 232–1567 |
| Paraguay | 106–160 | 427–665 | 1573–2499 | 2136–3294 | 0–30 | 9–118 | 100–383 | 109–521 |
| Uruguay | 10–18 | 392–488 | 2897–3310 | 3302–3816 | 0–18 | 0–103 | 25–565 | 25–686 |
| Incidence per 100 000 population | ||||||||
| Argentina | 15–22 | 18–23 | 885–968 | 96–110 | 0–2 | 1–4 | 69–145 | 9–19 |
| Brazil | 16–18 | 17–20 | 635–678 | 73–77 | 0–3 | 2–5 | 71–151 | 8–17 |
| Chile | 3–5 | 8–11 | 412–459 | 54–61 | 0–1 | 1–2 | 39–93 | 5–12 |
| Ecuador | 18–21 | 8–11 | 445–486 | 39–45 | 0–4 | 0–3 | 19–92 | 1–9 |
| Paraguay | 15–23 | 8–11 | 396–535 | 32–46 | 0–4 | 0–2 | 25–86 | 2–7 |
| Uruguay | 4–8 | 14–18 | 586–677 | 95–110 | 0–8 | 0–4 | 5–117 | 1–20 |
- —Centers for Disease Control and Prevention10.13039/100000030
- —PAHO10.13039/100011893
- —WHO Pandemic Influenza Preparedness Framework
Peer Reviews
No public reviews on file for this paper yet. If you reviewed it on a platform where reviews are public (OpenReview, ICLR, NeurIPS, ICML), you can paste yours below so the community can read it here.
Videos
No videos yet. Explain this paper in a talk, walkthrough, or lecture? Add one.
Taxonomy
TopicsInfluenza Virus Research Studies · Respiratory viral infections research · Data-Driven Disease Surveillance
Estimates of viral influenza burden of disease (BoD) are useful to guide resources and policies for influenza epidemics and pandemic prevention and control [1, 2]. While challenging to accurately estimate, information about the BoD across the full spectrum of illness severity can guide comprehensive economic burden, vaccine impact, and cost-effectiveness evaluations [3]. Annual BoD estimates, combined with data about influenza vaccine effectiveness and coverage, can allow for rapid assessment of prevention and control measures [4]. In turn, such evaluations can help health authorities make evidence-based decisions and refine policies to optimize influenza mitigation.
In North America, influenza surveillance data have been used for years to estimate the BoD, but fewer data are published from Central and South America [5, 6]. Indeed, there is comparatively little information about the influenza BoD in Central and South America to guide investments in influenza mitigation. In the past, influenza BoD estimates from the Americas focused on hospitalization and associated deaths [7, 8], leaving gaps in understanding on BoD among those with milder but more common illnesses. To address this gap in knowledge, the Severe Acute Respiratory Infections network (SARInet) sought to leverage improved surveillance data and methods to estimate the influenza BoD in South America [9, 10].
In 2015, the World Health Organization (WHO) developed a manual for estimating the disease burden associated with seasonal influenza [11]. Since then, SARInet implemented regional and in-country trainings to enable countries to estimate influenza BoD using standardized approaches [7, 12–16]. As highlighted in the WHO manual [11], estimating the burden of mild to moderate nonhospitalized cases attributable to influenza is also important because of the large number of such cases occurring annually, their associated economic burden, and their adverse impact on healthcare systems and society [17]. Retrospective estimates of influenza BoD across multiple seasons enable health authorities to assess seasonal variation and optimize influenza prevention and control policies [4, 6]. In the current analysis, we estimated the annual burden of mild-to-moderate illness, hospitalizations, and deaths attributed to influenza in 6 South American countries during the 2015–2019 influenza seasons.
METHODS
Study Design and Data Sources
For this analysis, we obtained retrospective data from 6 countries that participate in the SARInet BoD working groups: Argentina, Brazil, Chile, Ecuador, Paraguay and Uruguay. The analysis included data from 1 January 2015 to 31 December 2019. We used monthly hospital discharge records and monthly deaths classified according to the International Classification of Diseases, Tenth Revision (ICD-10). Data about hospitalization first-listed discharge diagnoses were obtained from national electronic health information systems available through countries’ ministries of health. Data about first-listed cause of death were obtained from vital statistics departments or national institutes of statistics and census. We then identified all respiratory illness discharge diagnoses and cause of death (ICD-10 codes J00–J99) for our analysis. When hospitalization data were incomplete for some jurisdictions, we produced estimates for jurisdictions with available data and then extrapolated these to the rest of a country based on population size. Influenza surveillance data were obtained from each country's national influenza centers [15, 16, 18, 19]. We used the monthly number of respiratory samples tested for influenza and the monthly number that tested positive for influenza virus, to attribute respiratory hospitalizations and deaths to influenza illness by age groups (ie, <5, 5–64, or ≥65 years) [10]. We used data from national institutes of statistics by age group to estimate the population at risk of influenza illness each year.
Annual Estimates of Influenza-Associated Respiratory Hospitalizations and Deaths
To estimate the annual number of influenza-associated respiratory hospitalizations and deaths in each country, we used a multiplier method, which assumed that, every month, the number of all-respiratory hospitalizations or deaths attributable to influenza by age was proportional to the percentage of influenza-positive specimens identified at national influenza centers during same month. Methodologic analysis, calculations, and assumptions were similar to those in previous studies [7, 14, 15]. We first estimated the monthly percentage of virologic surveillance samples that tested positive for influenza by age group. Then, we estimated the monthly numbers of influenza-associated hospitalizations (or deaths) by multiplying the age-stratified number of respiratory hospitalizations (or deaths) in a month by the age-stratified influenza virus circulation in the same month. We then summed monthly age-stratified hospitalizations (or deaths) across each year to estimate the annual number of influenza-associated respiratory hospitalizations (or deaths). Surveillance data has been used only to determine the percentage of positive samples. Data on respiratory hospitalizations and deaths were used from national statistics to multiply by the percentage of influenza-positive samples. Thereafter, we used 100 000 Monte Carlo simulations to create a distribution of estimates by age group and country, assuming a Poisson distribution. We used the 2.5th and 97.5th percentiles of the simulated distributions by each age-specific group, year, and country to describe the uncertainty of our estimates, or the 95% credible intervals.
Annual Estimates of Mild-to-Moderate Influenza Illness
We used a web tool built from a systematic literature review and meta-analysis to estimate mild-to-moderate influenza-associated illness from our estimated influenza-associated hospitalizations and/or deaths [20]. The tool was developed by the Johns Hopkins Center for Health Security Bloomberg School of Public Health, in partnership with WHO, and has been used previously [21]. We estimated the uncertainty bounds based on the 2.5th and 97.5th percentiles for influenza-associated respiratory hospitalizations and deaths.
Statistical Analyses
We estimated incidence (per 100 000 population) of mild-to-moderate influenza illness, influenza-associated hospitalizations and influenza-associated deaths by age group and country. Incidence was computed dividing the estimated annual number of cases by the census population. We estimated the uncertainty bounds based on the 2.5th and 97.5th percentiles of the simulated distributions for the number of cases, from which we derived the ranges (from the minimum to the maximum value of such percentiles). All descriptive and statistical analyses were performed using Stata Statistical Software: Release 17 (StataCorp. 2023. College Station, TX: StataCorp LLC) [22].
Ethical Approval
We used aggregated deidentified records for this evaluation which was exempt from ethical review within the Pan American Health Organization (PAHO) and the countries. In addition, this analysis was reviewed by the Centers for Disease Control and Prevention (CDC) and conducted consistently with applicable federal law and CDC policy.
RESULTS
Influenza Surveillance in Study Population
Participating countries had 307.4 million inhabitants, of whom 7.4% were <5, 83.0% were 5–64, and 9.6% were >64 years old (Table 1). During the study period, countries tested an annual average of from 668 (Uruguay) to 48 402 (Brazil) respiratory samples for influenza. Four of 6 countries provided virologic surveillance data only from inpatient samples, and 2 provided data from both inpatient and outpatient samples. The most commonly identified subtypes were influenza A/(H3) in 2015 and 2017 and influenza A/(H1N1)pdm09 in 2016, 2018, and 2019 (Figure 1 and Supplementary Table 1). The years of highest influenza B circulation were 2017 and 2019.
Influenza circulation by epidemiological week in Argentina, Brazil, Chile, Ecuador, Paraguay, and Uruguay, 2015–2019.
Respiratory Hospitalizations, Attributable Fraction of Influenza, and Associated Incidence
The absolute number of respiratory hospitalizations varied substantially by country, age group, and year (Table 2). During 2015–2019, the lowest incidences of respiratory hospitalizations in children <5 years old were in Ecuador, Brazil, and Paraguay, whereas the highest were in Chile and Uruguay. In people aged 5–64 years, incidence rates were highest in Brazil and lowest in Paraguay. Among adults aged ≥65 years, the incidence of respiratory hospitalizations was similar in most countries. Influenza-associated respiratory hospitalizations among children <5 years old ranged from 219–789 (minimum value of the 2.5th percentile to maximum value of the 97.5th percentile) in Paraguay to 13 505–36 421 in populous Brazil (Table 2 and Figure 2). Among adults aged ≥65 years, influenza-associated respiratory hospitalizations also ranged from 350–853 in Paraguay to 37 046–85 815 in Brazil. Consequently, the lowest number of influenza hospitalizations among all age groups was in Paraguay (ie, 1084–3387) and the highest in Brazil (285 309–434 327). The annual incidence of influenza-associated hospitalizations ranged from 16–47/100 000 in Paraguay to 140–208/100 000 in Brazil. During 2015–2019 across all countries, the estimated number of influenza-associated hospitalizations ranged from 323 379 to 490 049 and varied substantially by country, age group, and year (Figure 4 and Supplementary Tables 2–4). For example, the number of influenza-associated hospitalizations ranged from 323 379–345 936 in 2015 to 465 526–490 049 in 2018.
All respiratory and influenza-associated hospitalizations by month and year and across all age groups in Argentina, Brazil, Chile, Ecuador, Paraguay, and Uruguay, 2015–2019.
All respiratory and influenza-associated deaths by month and year and across all age groups in Argentina, Brazil, Chile, Ecuador, Paraguay, and Uruguay, 2015–2019.
Estimated influenza burden of disease by year and across all age groups in Argentina, Brazil, Chile, Ecuador, Paraguay, and Uruguay, 2015–2019. The area inside the pyramid represents the total number of cases (midpoint of the range) of each type. Ranges were obtained from the minimum value of the 2.5th percentile and the maximum value of the 97.5th percentile in the Monte Carlo simulations.
Respiratory Deaths, Attributable Fraction of Influenza, and Associated Incidence
During 2015–2019, the absolute number and incidence of respiratory deaths per year in older adults (aged ≥65 years) were higher than in the other age groups for all countries (Table 3 and Figure 3). Among children aged <5 years, the numbers of influenza-associated respiratory deaths ranged from 0–17 in Chile to 43–403 in populous Brazil. Among adults aged ≥65 years, the numbers of influenza-associated respiratory deaths also ranged from 25–565 in Uruguay to 12 143–27 970 in Brazil. Consequently, the lowest number of influenza deaths among all age groups was in Paraguay (ie, 109–521), and the highest in Brazil (16 306–34 444). The annual incidence of influenza-associated deaths ranged from 2–7/100 000 in Paraguay to 9–19/100 000 in Argentina.
During 2015–2019 across all countries, the estimated number of influenza-associated deaths ranged from 22 662 to 46 971 (minimum to maximum value of the series) and also varied substantially by country, age group, and year (Figure 4 and Supplementary Tables 2–4). For example, the number of influenza-associated deaths ranged from 22 662–29 028 (minimum value of the 2.5th percentile to maximum value of the 97.5th percentile) in 2015 to 39 561–46 971 in 2018.
Mild-to-Moderate Influenza Illness Estimates Across All Countries
During 2015 to 2019, the estimated number of mild-to-moderate influenza illnesses ranged from 50.6 to 78.3 million (Figure 4 and Supplementary Tables 2–4). This represents an influenza illness attack rate of 16.5%–25.5% among 307 million people in Argentina, Brazil, Chile, Ecuador, Paraguay, and Uruguay. This number of mild-to-moderate influenza cases ranged from 50.6–53.3 million cases in 2015 to 75.2–78.3 million cases in 2016.
DISCUSSION
Our estimates suggest that vaccine-preventable viral influenza caused substantial disease and death every year in Argentina, Brazil, Chile, Ecuador, Paraguay, and Uruguay. During 2015–2019, influenza sickened >1 in 6 persons each epidemic period. Our estimated influenza hospitalizations and deaths were also similar to those of the United States, which has a population of 336 million, similar to that of Argentina, Brazil, Chile, Ecuador, Paraguay, and Uruguay combined (ie, 307 million people). During 2015–2019 the United States had similar influenza hospitalizations (ie, 270 000–710 000 vs our 323 000–490 000) and deaths (ie, 22 000–51 000 vs our 23 000–47 000) [23]. Only the US mild-to-moderate disease estimates seemed lower than those from our study countries (ie, 23–41 million vs our 51–78 million cases [23]). Our findings were also similar to previous influenza-associated hospitalizations estimates [7] and deaths [8] from Latin America.
In Latin America and the Caribbean, few studies have estimated the burden of mild-to-moderate disease. In a systematic review and meta-analysis by Savy et al [24], only 4 studies estimated rates of influenzalike illness. Those findings are not comparable to ours because they are derived using different methods to define mild illness. Estimating the complete spectrum severity is challenging, because few persons are tested for influenza, and the majority of those ill remain undiagnosed [25, 26]. Furthermore, influenza illness may present as nonrespiratory illness, especially among the extremes of age [27]. The inclusion of these additional outcomes would increase the BoD. PAHO and WHO are working with academic partners to improve analytic methods and better estimate the burden of nonrespiratory, non–medically attended influenza illness [28]. Such efforts are anticipated to help estimate the cost-benefit of influenza vaccination among target groups.
Our results also demonstrate how there is year-to-year variability in the influenza-associated burden. Several factors contribute to this variability, such as prior immunity among persons of different age, the predominance of circulating virus types and subtypes, the antigenic similarity between circulating viruses and vaccines, and vaccination coverage [29, 30]. Our evaluation demonstrates that South American countries can use surveillance, hospital records, and vital statistics to estimate the interim, or end-of-season, influenza burden as is commonly done in other countries each season [6]. Interim estimates help health authorities differentiate mild versus severe influenza seasons, guide risk communications, serve as inputs for vaccine averted illness models, and inform populations about the benefit of influenza vaccines and antivirals. End-of-season estimates can also be used as inputs for cost-effectiveness analyses, when countries are exploring an investment case for procuring vaccines and antivirals, guide next influenza season's procurement, and inform epidemic and pandemic preparedness planning (eg, when estimating hospital staff and bed surge capacity requirements) [31].
SARInet facilitates the exchange of surveillance information, helps countries estimate respiratory virus incidence, guides regional health policies, and helps mitigate influenza. In addition to SARInet, the Network for the Evaluation of Vaccine Effectiveness in Latin America and the Caribbean (REVELAC-i) estimates interim and end-of-season influenza vaccine effectiveness using influenza surveillance and vaccine registry data [32]. In 2019, for example, REVELAC-i demonstrated that countries could prevent more than a third of influenza-associated hospitalizations in young children and older adults by vaccinating everyone in these target groups [33]. SARInet BoD findings coupled with REVELAC-i vaccine effectiveness findings can also serve as inputs for vaccine averted illness models, which help inform providers and target groups about the benefits of influenza vaccination.
Our study has several limitations. First, we used 2 multiplier methods to estimate the burden of severe disease and mild-to-moderate illness. Multiplier methods can generate underestimates because, for example, they rely on specific case definitions (eg, influenza-associated respiratory hospitalizations) rather that incorporating all manifestation of influenza illness (eg, influenza-associated respiratory and circulatory hospitalizations) [34, 35]. Work is underway to refine and validate a novel multiplier method for future influenza BoD estimates, as our methodologic approach to mild disease was not yet validated and relied on data published in peer-reviewed literature, with data from other regions. Second, we could not properly adjust for the possible correlation between the data sets. For this reason, we presented the results in ranges, rather than confidence intervals, to increase the amplitude of the interval, so that the true value may be contained in our estimates. Third, our results may underestimate influenza-associated hospitalizations because national discharge datasets comprised mostly data from public hospitals and may have missed data from some private hospitals, especially in Paraguay; our hypothesis, however, is that this effect is not very high, since about 27% of the population is served in the private system, according to the National Institute of Statistics of Paraguay. Finally, testing schedules and regimens might vary between countries and therefore might have influenced the positivity in the different health care levels. Moreover, the different healthcare systems in the countries and related surveillance system set-ups might may an impact on the respective country data, and care seeking likely varied from year to year; however, we assumed that care seeking at hospitals was similar from year to year.
In conclusion, each year between 2015 and 2019, influenza caused millions of illnesses, hundreds of thousands of hospitalizations, and tens of thousands of deaths in 6 of the 12 countries in South America. Indeed, between 1 in 6 and a quarter of the population could become sick from influenza annually. Such findings are useful for decision makers. Awareness of influenza BoD and severity has been identified as one of the 5 pillars that support successful influenza vaccination programs and can inform future policies aiming to achieve and maintain better influenza control [36]. Influenza BoD data can be used to identify and target undervaccinated populations; communicate influenza risks to the public; guide research funding to areas with the greatest potential impact, such as new vaccines and antiviral drugs; guide epidemic and pandemic planning; and assess the cost-effectiveness of interventions.
Supplementary Data
Supplementary materials are available at The Journal of Infectious Diseases online (http://jid.oxfordjournals.org/). Supplementary materials consist of data provided by the author that are published to benefit the reader. The posted materials are not copyedited. The contents of all supplementary data are the sole responsibility of the authors. Questions or messages regarding errors should be addressed to the author.
Supplementary Material
jiaf037_Supplementary_Data
The reference list from the paper itself. Each links out to its DOI / PubMed record.
- 1World Health Organization . Pandemic influenza preparedness framework: partnership contribution high-level implementation plan III 2024-2030. 2023. https://iris.who.int/handle/10665/366981. Accessed 30 July 2024.
- 2World Health Organization . Global influenza strategy 2019–2030. 2019. https://iris.who.int/handle/10665/311184. Accessed 30 July 2024.
- 3Lee VJ, Ho ZJM, Goh EH, et al Advances in measuring influenza burden of disease. Influenza Other Respir Viruses 2018; 12:3–9.29460425 10.1111/irv.12533 PMC 5818353 · doi ↗ · pubmed ↗
- 4Chung JR, Rolfes MA, Flannery B, et al Effects of influenza vaccination in the United States during the 2018–2019 influenza season. Clin Infect Dis 2020; 71:e 368–76.31905401 10.1093/cid/ciz 1244 PMC 7643742 · doi ↗ · pubmed ↗
- 5Thompson WW, Comanor L, Shay DK. Epidemiology of seasonal influenza: use of surveillance data and statistical models to estimate the burden of disease. J Infect Dis 2006; 194(suppl 2):S 82–91.17163394 10.1086/507558 · doi ↗ · pubmed ↗
- 6Rolfes MA, Foppa IM, Garg S, et al Annual estimates of the burden of seasonal influenza in the United States: a tool for strengthening influenza surveillance and preparedness. Influenza Other Respir Viruses 2018; 12:132–7.29446233 10.1111/irv.12486 PMC 5818346 · doi ↗ · pubmed ↗
- 7Palekar RS, Rolfes MA, Arriola CS, et al Burden of influenza-associated respiratory hospitalizations in the Americas, 2010–2015. P Lo S One 2019; 14:e 0221479.31490961 10.1371/journal.pone.0221479 PMC 6730873 · doi ↗ · pubmed ↗
- 8Cheng PY, Palekar R, Azziz-Baumgartner E, et al Burden of influenza-associated deaths in the Americas, 2002–2008. Influenza Other Respir Viruses 2015; 9(suppl 1):13–21.26256291 10.1111/irv.12317 PMC 4549098 · doi ↗ · pubmed ↗