Correction: Clinical characterization of common pathogenic variants of SOD1-ALS in Germany
Maximilian Wiesenfarth, Yalda Forouhideh-Wiesenfarth, Zeynep Elmas, Özlem Parlak, Ulrike Weiland, Christine Herrmann, Joachim Schuster, Axel Freischmidt, Kathrin Müller, Reiner Siebert, Kornelia Günther, Elke Fröhlich, Antje Knehr, Tatiana Simak, Franziska Bachhuber

Abstract
Genes, proteins, chemicals, diseases, species, mutations and cell lines named across the full text — each resolved to its canonical identifier and authoritative record.
Click any figure to enlarge with its caption.
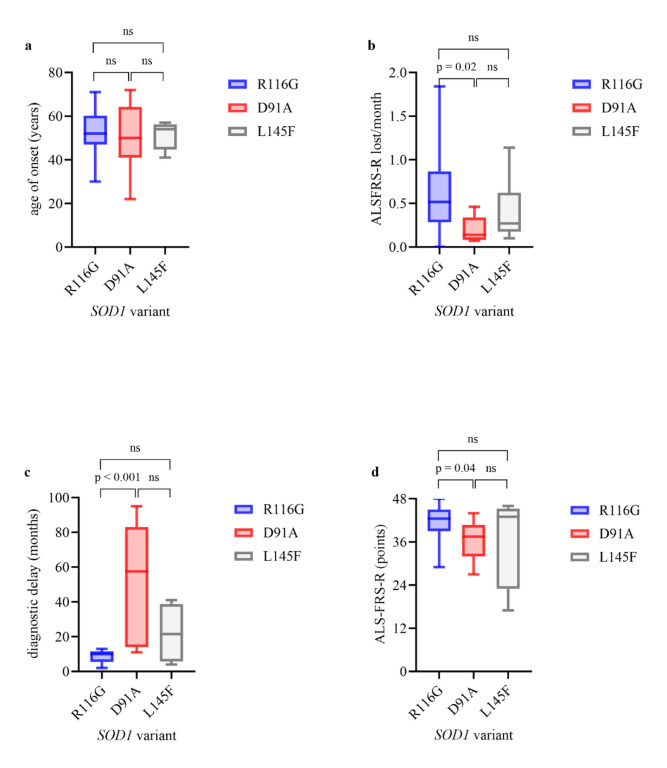 Figure 1
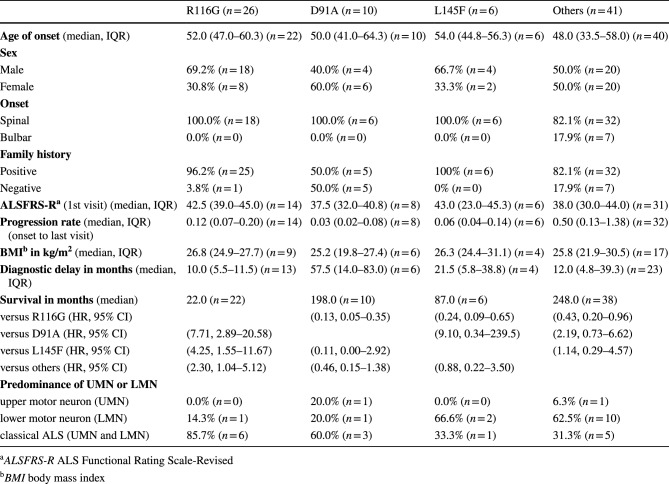 Figure 2
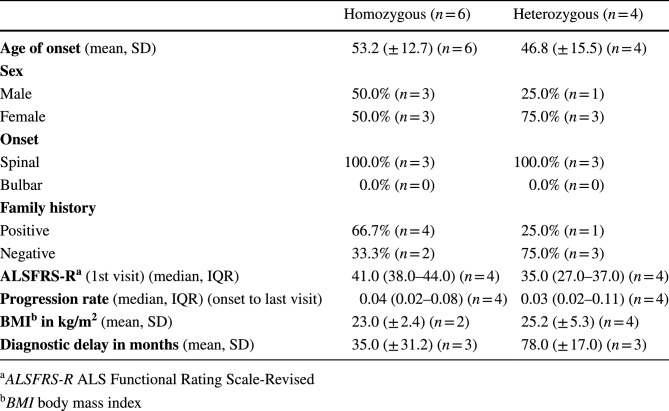 Figure 3
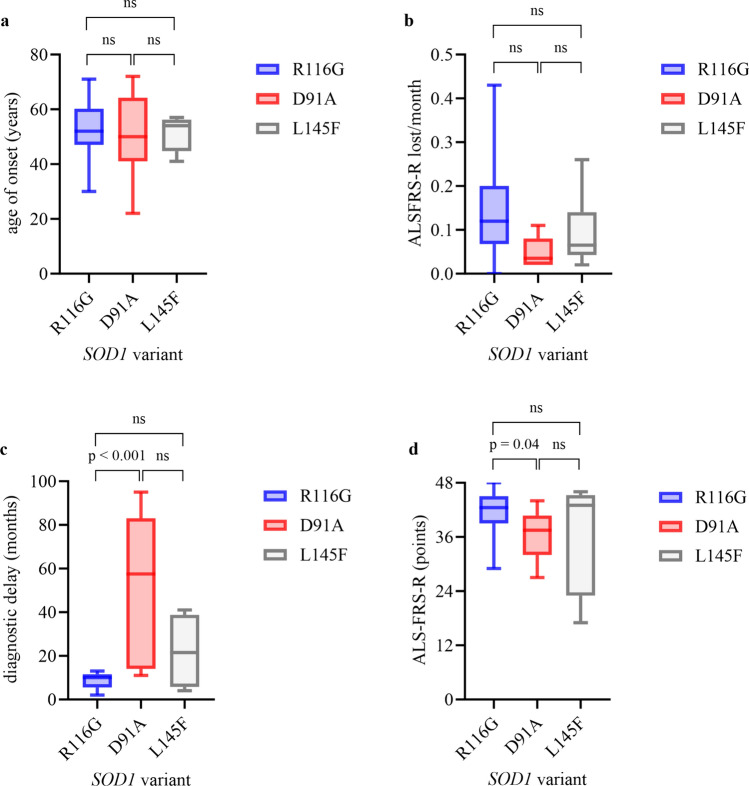 Figure 4
Peer Reviews
No public reviews on file for this paper yet. If you reviewed it on a platform where reviews are public (OpenReview, ICLR, NeurIPS, ICML), you can paste yours below so the community can read it here.
Videos
No videos yet. Explain this paper in a talk, walkthrough, or lecture? Add one.
Taxonomy
TopicsAmyotrophic Lateral Sclerosis Research
Correction: Journal of Neurology (2024) 271:6667–6679 10.1007/s00415-024-12564-1
In the original version of this article, the disease progression rates (ALSFRS-R between onset and last visit) were not reported in points lost per month as described in the text, but in points lost per week (in the text, Tables 2, 3 and Fig. 1b). This affects the progression rates in the text, Tables 2, 3 and Fig. 1b.
In the abstract, fifth sentence which previously read
Moreover, R116G patients had the fastest median ALSFRS-R progression rate with 0.12 (IQR 0.07–0.20) points lost per month.
Should have read
Moreover, R116G patients had the fastest median ALSFRS-R progression rate with 0.51 (IQR 0.28–0.87) points lost per month.
In the section “ALSFRS‑R, progression rate and diagnostic delay” first paragraph which previously read
Consistent with the survival data, SOD1-ALS patients with R116G variants showed a median disease progression rate of 0.12 ALSFRS-R points lost per month (IQR 0.07–0.20) between onset and last visit, which was more pronounced compared to patients with pathogenic D91A (0.03, IQR 0.02–0.08; n = 8; p = 0.02) and L145F variants (median 0.06, IQR 0.04–0.14; n = 6; p = 0.21), while D91A and L145F patients showed a quite similar, slow median progression rate (p = 0.35; Fig. 1b). Moreover, these differences in ALSFRS-R progression rate were already detected in an early phase of the disease, as a decline of 0.62 points (IQR 0.25–0.76; n = 14) per month in ALSFRS-R was found in patients with R116G variants compared to 0.16 (IQR 0.09–0.44; n = 8; p = 0.04) in patients with D91A and 0.38 with L145F variants (IQR 0.14–1.05; n = 6; p = 0.73) between the onset of the disease and the first visit at a MND reference center. In line with this faster disease progression, also the median delay of ALS diagnosis in patients carrying R116G variants was shorter (median 10.0 months, IQR 5.5–11.5; n = 13) than in patients with D91A (median 57.5 months, IQR 14.0–83.0; n = 6; p < 0.001) and in patients with L145F variants (median 21.5 months, IQR 5.8–38.8; n = 4; p = 0.27; Fig. 1c). Of note, median ALSFRS-R progression rates in patients with R116G, D91A and L145F were lower compared to patients carrying less frequent SOD1 variants (0.50, IQR 0.13–1.38; n = 32; Table 2). Median ALSFRS-R at first visit was 42.5 (IQR 39.0–45.0; n = 14) in patients with R116G and therefore higher compared to 37.5 (IQR 32.0–40.8; n = 8) in D91A (p = 0.04; Fig. 1d) and similar to L145F carriers (43.0, IQR 23.0–45.3; n = 6; p = 0.83; Fig. 1d).
Should have read
Consistent with the survival data, SOD1-ALS patients with R116G variants showed a median disease progression rate of 0.51 ALSFRS-R points lost per month (IQR 0.28–0.87) between onset and last visit, which was more pronounced compared to patients with pathogenic D91A (0.14, IQR 0.08–0.33; n = 8; p = 0.02) and L145F variants (median 0.27, IQR 0.17–0.62; n = 6; p = 0.24), while D91A and L145F patients showed a quite similar, slow median progression rate (p = 0.28; Fig. 1b). Moreover, these differences in ALSFRS-R progression rate were already detected in an early phase of the disease, as a decline of 0.62 points (IQR 0.25–0.76; n = 14) per month in ALSFRS-R was found in patients with R116G variants compared to 0.16 (IQR 0.09–0.44; n = 8; p = 0.04) in patients with D91A and 0.38 with L145F variants (IQR 0.14–1.05; n = 6; p = 0.73) between the onset of the disease and the first visit at a MND reference center. In line with this faster disease progression, also the median delay of ALS diagnosis in patients carrying R116G variants was shorter (median 10.0 months, IQR 5.5–11.5; n = 13) than in patients with D91A (median 57.5 months, IQR 14.0–83.0; n = 6; p < 0.001) and in patients with L145F variants (median 21.5 months, IQR 5.8–38.8; n = 4; p = 0.27; Fig. 1c). Of note, median ALSFRS-R progression rates in patients with D91A and L145F were lower compared to patients carrying less frequent SOD1 variants (0.50, IQR 0.13–1.38; n = 32; Table 2). Median ALSFRS-R at first visit was 42.5 (IQR 39.0–45.0; n = 14) in patients with R116G and therefore higher compared to 37.5 (IQR 32.0–40.8; n = 8) in D91A (p = 0.04; Fig. 1d) and similar to L145F carriers (43.0, IQR 23.0–45.3; n = 6; p = 0.83; Fig. 1d).
In the section “Clinical phenotype in patients with homozygous and heterozygous D91A allele genotype” second and third paragraph which previously read
Patients carrying a D91A on both alleles, i.e. in homozygous state (n = 6) all had a spinal onset of the disease, with a mean age of onset of 53.2 years (SD ± 12.7 years; n = 6), equal shares of males and females, but a positive family history of ALS in only 33.3%. ALS was diagnosed after a diagnostic delay of 35.0 months (mean, SD ± 31.2; n = 3). At first visit patients showed a median ALSFRS-R of 41.0 (IQR 38.0–44.0; n = 4), which declined in the median 0.04 points/month (IQR 0.02–0.08) until the last visit. Two patients with homozygous allele genotype died during the observation period after 141.0 and 198.0 months, respectively.
Age of onset in patients with heterozygous (n = 4) D91A allele genotype was 46.8 years (SD ± 15.5 years; n = 4). 75.0% (n = 3) of the included four patients were female and family history was also apparently negative in 75.0% (n = 3). All patients had a spinal onset of the disease. ALS was diagnosed after a mean delay of 78.0 months (SD ± 17.0 months; n = 3). ALSFRS-R was 35.0 (median, IQR 27.0–37.0; n = 4) at first visit and showed a median progression rate of 0.03 points lost/month (IQR 0.02–0.11; n = 4) until the last visit.
Should have read
Patients carrying a D91A on both alleles, i.e. in homozygous state (n = 6) all had a spinal onset of the disease, with a mean age of onset of 53.2 years (SD ± 12.7 years; n = 6), equal shares of males and females, but a positive family history of ALS in only 33.3%. ALS was diagnosed after a diagnostic delay of 35.0 months (mean, SD ± 31.2; n = 3). At first visit patients showed a median ALSFRS-R of 41.0 (IQR 38.0–44.0; n = 4), which declined in the median 0.17 points/month (IQR 0.07–0.33) between onset and the last visit. Two patients with homozygous allele genotype died during the observation period after 141.0 and 198.0 months, respectively.
Age of onset in patients with heterozygous (n = 4) D91A allele genotype was 46.8 years (SD ± 15.5 years; n = 4). 75.0% (n = 3) of the included four patients were female and family history was also apparently negative in 75.0% (n = 3). All patients had a spinal onset of the disease. ALS was diagnosed after a mean delay of 78.0 months (SD ± 17.0 months; n = 3). ALSFRS-R was 35.0 (median, IQR 27.0–37.0; n = 4) at first visit and showed a median progression rate of 0.11 points lost/month (IQR 0.08–0.46; n = 4) between onset and the last visit.
Tables 2 and 3 which previously read
Table 2 Clinical features of patients with different variants of the SOD1 gene
Table 3 Clinical features of ALS patients with homozygous and heterozygous SOD1 D91A genotypes
Tables 2 and 3 should have read Table 2. Clinical features of patients with different variants of the SOD1 geneR116G (n = 26)D91A (n = 10)L145F (n = 6)Others (n = 41)Age of onset (median, IQR)52.0 (47.0–60.3) (n = 22)50.0 (41.0–64.3) (n = 10)54.0 (44.8–56.3) (n = 6)48.0 (33.5–58.0) (n = 40)SexMale69.2% (n = 18)40.0% (n = 4)66.7% (n = 4)50.0% (n = 20)Female30.8% (n = 8)60.0% (n = 6)33.3% (n = 2)50.0% (n = 20)OnsetSpinal100.0% (n = 18)100.0% (n = 6)100.0% (n = 6)82.1% (n = 32)Bulbar0.0% (n = 0)0.0% (n = 0)0.0% (n = 0)17.9% (n = 7)Family historyPositive96.2% (n = 25)50.0% (n = 5)100% (n = 6)82.1% (n = 32)Negative3.8% (n = 1)50.0% (n = 5)0% (n = 0)17.9% (n = 7)ALSFRS-R (1st visit) (median, IQR)42.5 (39.0–45.0) (n = 14)37.5 (32.0–40.8) (n = 8)43.0 (23.0–45.3) (n = 6)38.0 (30.0–44.0) (n = 31)Progression rate (median, IQR) (onset to last visit)0.51 (0.28–0.87) (n = 14)0.14 (0.08–0.33) (n = 8)0.27 (0.17–0.62) (n = 6)0.50 (0.13–1.38) (n = 32)BMI in kg/m^2^ (median, IQR)26.8 (24.9–27.7) (n = 9)25.2 (19.8–27.4) (n = 6)26.3 (24.4–31.1) (n = 4)25.8 (21.9–30.5) (n = 17)Diagnostic delay in months (median, IQR)10.0 (5.5–11.5) (n = 13)57.5 (14.0–83.0) (n = 6)21.5 (5.8–38.8) (n = 4)12.0 (4.8–39.3) (n = 23)Survival in months (median)22.0 (n = 22)198.0 (n = 10)87.0 (n = 6)248.0 (n = 38)Versus R116G (HR, 95% CI)(0.13, 0.05–0.35)(0.24, 0.09–0.65)(0.43, 0.20–0.96)Versus D91A (HR, 95% CI)(7.71, 2.89–20.58)(9.10, 0.34–239.5)(2.19, 0.73–6.62)Versus L145F (HR, 95% CI)(4.25, 1.55–11.67)(0.11, 0.00–2.92)(1.14, 0.29–4.57)Versus others (HR, 95% CI)(2.30, 1.04–5.12)(0.46, 0.15–1.38)(0.88, 0.22–3.50)Predominance of UMN or LMNUpper motor neuron (UMN)0.0% (n = 0)20.0% (n = 1)0.0% (n = 0)6.3% (n = 1)Lower motor neuron (LMN)14.3% (n = 1)20.0% (n = 1)66.6% (n = 2)62.5% (n = 10)Classical ALS (UMN and LMN)85.7% (n = 6)60.0% (n = 3)33.3% (n = 1)31.3% (n = 5)ALSFRS-R ALS Functional Rating Scale-Revised, BMI body mass indexTable 3Clinical features of ALS patients with homozygous and heterozygous SOD1 D91A genotypesHomozygous (n = 6)Heterozygous (n = 4)Age of onset (mean, SD)53.2 (± 12.7) (n = 6)46.8 (± 15.5) (n = 4)SexMale50.0% (n = 3)25.0% (n = 1)Female50.0% (n = 3)75.0% (n = 3)OnsetSpinal100.0% (n = 3)100.0% (n = 3)Bulbar0.0% (n = 0)0.0% (n = 0)Family historyPositive66.7% (n = 4)25.0% (n = 1)Negative33.3% (n = 2)75.0% (n = 3)ALSFRS-R (1st visit) (median, IQR)41.0 (38.0–44.0) (n = 4)35.0 (27.0–37.0) (n = 4)Progression rate (median, IQR) (onset to last visit)0.17 (0.07–0.33) (n = 4)0.11 (0.08–0.46) (n = 4)BMI in kg/m^2^ (mean, SD)23.0 (± 2.4) (n = 2)25.2 (± 5.3) (n = 4)Diagnostic delay in months (mean, SD)35.0 (± 31.2) (n = 3)78.0 (± 17.0) (n = 3)ALSFRS-R ALS Functional Rating Scale-Revised, BMI body mass index
Figure 1 which previously appeared as
Fig. 1 Clinical characteristics in R116G carriers vs. D91A carriers (homozygous and heterozygous) vs. L145F carriers. Boxplots show median (IQR; minimum–maximum). (a) age of onset (b) progression rate (c) diagnostic delay (d) ALSFRS-R at first visit. Experimental units n = number (a) R116G n = 22, D91A* n* = 10, p = 0.6814, R116G n = 22, L145F* n* = 6, p = 0.9239, D91A* n* = 10, L144F* n* = 6, p = 0.9798 (b) R116G* n* = 14, D91A* n* = 8, p = 0.0183, R116G* n* = 14, L145F* n* = 6, p = 0.2125, D91A* n* = 8, L145F* n* = 6, p = 0.3526 (c) R116G* n* = 13, D91A n = 6, p = 0.0008, R116G* n* = 13, L145F n = 4, p = 0.2723, D91A n = 6, L145F n = 4, p = 0.1286 (d) R116G* n* = 14, D91A n = 8, p = 0.0439, R116G* n* = 14, L145F* n* = 6, p = 0.08256, D91A* n* = 8, L145F* n* = 6, p = 0.4336. Mann–Whitney U test was used for two group comparison. A P-value of ≤ 0.05 was regarded as statistically significant. ALSFRS-R Amyotrophic lateral sclerosis functional rating scale revised
Figure 1 should have appeared as shown belowFig. 1Clinical characteristics in R116G carriers vs. D91A carriers (homozygous and heterozygous) vs. L145F carriers. Boxplots show median (IQR; minimum–maximum). (a) Age of onset, (b) progression rate, (c) diagnostic delay, (d) ALSFRS-R at first visit. Experimental units n = number (a) R116G n = 22, D91A* n* = 10, p = 0.6814, R116G n = 22, L145F* n* = 6, p = 0.9239, D91A* n* = 10, L144F* n* = 6, p = 0.9798; (b) R116G* n* = 14, D91A* n* = 8, p = 0.0159, R116G* n* = 14, L145F* n* = 6, p = 0.2391, D91A* n* = 8, L145F* n* = 6, p = 0.2824; c R116G* n* = 13, D91A n = 6, p = 0.0008, R116G* n* = 13, L145F n = 4, p = 0.2723, D91A n = 6, L145F n = 4, p = 0.1286; (d) R116G* n* = 14, D91A* n* = 8, p = 0.0439, R116G* n* = 14, L145F* n* = 6, p = 0.08256, D91A* n* = 8, L145F* n* = 6, p = 0.4336. Mann–Whitney U test was used for two group comparison. A P-value of ≤ 0.05 was regarded as statistically significant. ALSFRS-R amyotrophic lateral sclerosis Functional Rating Scale Revised