MetAssimulo 2.0: a web app for simulating realistic 1D and 2D metabolomic 1H NMR spectra
Yan Yan, Beatriz Jiménez, Michael T Judge, Toby Athersuch, Maria De Iorio, Timothy M D Ebbels

TL;DR
MetAssimulo 2.0 is a web app that simulates realistic 1D and 2D NMR spectra for metabolomics, supporting machine learning and biomedical research.
Contribution
Expands simulation to blood and CSF, adds 2D NMR capabilities, and improves realism with protein background and inter-metabolite correlations.
Findings
Achieves a Pearson correlation of ~0.82 with real blood spectra.
Supports simulation of both 1D and 2D NMR spectra for diverse biological fluids.
Enables case–control and continuous outcome simulations for experimental design.
Abstract
Metabolomics extensively utilizes nuclear magnetic resonance (NMR) spectroscopy due to its excellent reproducibility and high throughput. Both 1D and 2D NMR spectra provide crucial information for metabolite annotation and quantification, yet present complex overlapping patterns which may require sophisticated machine learning algorithms to decipher. Unfortunately, the limited availability of labeled spectra can hamper application of machine learning, especially deep learning algorithms which require large amounts of labeled data. In this context, simulation of spectral data becomes a tractable solution for algorithm development. Here, we introduce MetAssimulo 2.0, a comprehensive upgrade of the MetAssimulo 1.b metabolomic 1H NMR simulation tool, reimplemented as a Python-based web application. Where MetAssimulo 1.0 only simulated 1D 1H spectra of human urine, MetAssimulo 2.0 expands…
Genes, proteins, chemicals, diseases, species, mutations and cell lines named across the full text — each resolved to its canonical identifier and authoritative record.
Click any figure to enlarge with its caption.
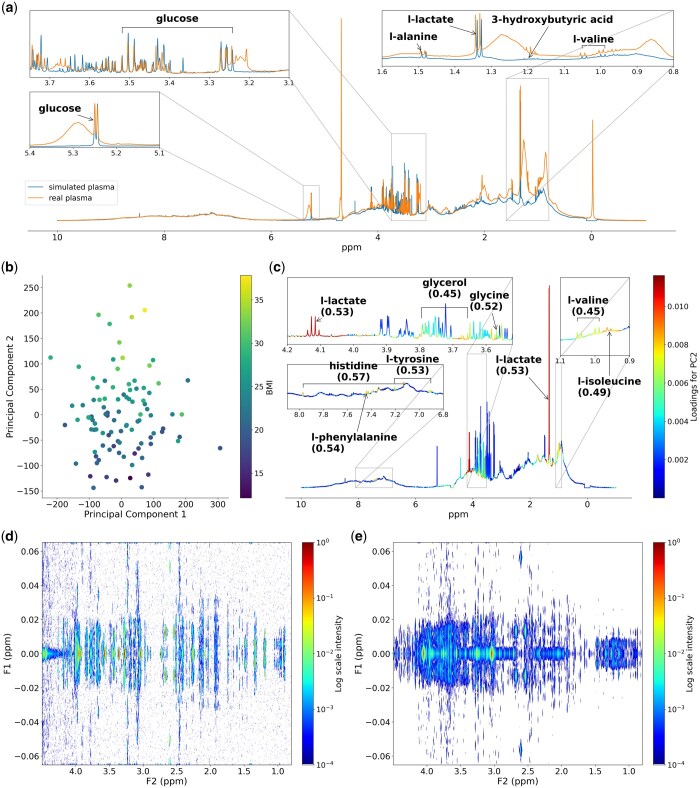 Figure 1
- —UK Research and Innovation Biotechnology and Biological Sciences Research Council
Peer Reviews
No public reviews on file for this paper yet. If you reviewed it on a platform where reviews are public (OpenReview, ICLR, NeurIPS, ICML), you can paste yours below so the community can read it here.
Videos
No videos yet. Explain this paper in a talk, walkthrough, or lecture? Add one.
Taxonomy
TopicsMetabolomics and Mass Spectrometry Studies · Traditional Chinese Medicine Studies · Advanced Chemical Sensor Technologies
1 Introduction
Metabolomics, an essential part of systems biology, provides an exhaustive profile of metabolite variations in response to genetic and external changes (Nicholson et al. 1999, Beckonert et al. 2007). Proton nuclear magnetic resonance (^1^H NMR) spectroscopy, known for its reproducibility and nondestructive nature, has become a pivotal technique in metabolic profiling, offering rich chemical structural insights (Beckonert et al. 2007). The utility of both 1D and 2D NMR spectra in the metabolite identification is well documented (Rossé et al. 2002, Cobas et al. 2013, Dona et al. 2016, Marchand et al. 2017, Judge and Ebbels 2022). Moreover, the integration of sophisticated machine learning algorithms has paved the way for extracting meaningful biological insights from intricate NMR spectroscopic datasets. Nevertheless, the scarcity of NMR spectral data poses a challenge to the efficacy of these algorithms and the validation of the biological significance (Muncey et al. 2010). Recently it was demonstrated that simulated NMR data could be used to train deep learning algorithms, emphasizing its critical role in addressing the challenges posed by data scarcity (Yan et al. 2024).
To address this limitation, synthetic NMR spectra simulation has been explored. Notably, Muncey et al. (2010) introduced MetAssimulo 1.0, a MATLAB-based package for simulating realistic pH-dependent ^1^H NMR spectra for complex mixtures such as urine in 2010. This was followed by Atieh et al. (2013), who developed MetFlexo, a C package enabling the simulation of ^1^H NMR spectra without constraints on pH or magnetic field strength. Dashti et al. (2017) designed a web tool named GiSSMO, which simulates 1D ^1^H NMR spectra of metabolites across different field strengths and facilitates the generation of simple mixture spectra. Despite these advancements, the installation requirements of the existing tools limit their accessibility. More importantly, the simulation of 2D NMR spectra for complex mixtures remains underexplored.
Here, we introduce MetAssimulo 2.0, an advanced reimplementation and expansion of MetAssimulo 1.0 (Muncey et al. 2010), now presented as a user-friendly web application developed in Python. MetAssimulo 2.0 is designed to enhance functionality and accessibility, supporting both discrete outcomes comparing mixture spectra under varying conditions (e.g. “normal” versus “abnormal”) and continuous outcomes demonstrating associations between metabolites and biomedical responses, such as age or body mass index (BMI). MetAssimulo 2.0 adds blood and cerebral spinal fluid (CSF) as alternative biofluids and enhances the realism for blood by incorporating a broad protein background a key feature of real blood spectra. Simulation of urine spectra benefits from MetAssimulo 1.0’s ability to shift metabolite resonances according to pH, and extends its capability to the simulation of 2D J-resolved (J-Res) and Correlation Spectroscopy (COSY) NMR spectra for complex mixtures without pH limitations.
2 Methods
The core algorithm of MetAssimulo 2.0 generates simulated NMR spectra for mixtures by employing a linear combination of experimental ^1^H NMR spectra from pure compounds (Muncey et al. 2010):
where y(δ) denotes the signal intensity at chemical shift δ ppm for a mixture of K metabolites k = 1,…,K, each of which is present at concentration c_k_ and contains p_k_ observable protons.
2.1 Pure compound reference spectra database
To construct the local database, the most commonly found metabolites in urine, blood, and CSF were selected based on concentration data extracted from the Human Metabolome Database (HMDB) version 5.0 (Wishart et al. 2022). The selection criteria were set to “Normal,” “Adults,” and “Both” for sex. Detailed information on the selected pure compounds is provided in Supplementary Table S1. The spectral data for these metabolites were obtained from the National Phenome Centre at Imperial College London (see experimental procedures in Supplementary Material S1.2).
2.2 Determination of metabolite concentrations in simulated biofluids
2.2.1 Discrete outcomes
MetAssimulo 2.0 expands the functionality of MetAssimulo 1.0 by integrating a more comprehensive set of concentration data from HMDB 5.0 (Wishart et al. 2022). For metabolites with multiple entries that meet the filtering criteria, we calculate the mean ( ) and SD ( ) of their concentrations by averaging across all relevant sources. Specifically, when concentration data are provided as a range, we estimate the mean and SD assuming the minimum and maximum values correspond to a 99.7% (3σ) confidence interval for a normal distribution. Concentrations for each metabolite are then sampled from a truncated normal distribution using these parameters, following the methodology outlined in MetAssimulo 1.0 (Muncey et al. 2010).
As an example of abnormal conditions, “heart transplant” was chosen as a case study (these data were more readily accessible in HMDB 5.0). For other abnormal conditions, users are required to input or upload their own concentration data, which allows for customization by the user in terms of the fold change and SD ratio with respect to the normal group.
2.2.2 Continuous outcomes
While MetAssimulo 1.0 only allowed for a discrete two-class outcome, MetAssimulo 2.0 introduces the capability to simulate a set of metabolites correlating with a continuous biological variable, such as age or BMI. The approach assumes a linear relationship between the metabolites (x) and the biological response ( ), represented by a simple linear regression model. To accommodate different scales among variables, standardization is applied, transforming the model to equation (2).
In this framework, users are required to input the mean concentration ( ) and SD ( ) for each metabolite, along with the Pearson correlation coefficient and the SD of the random error . By default, both and are set to zero, indicating no assumed correlation between the metabolites and the biological response ( ).
Additionally, users are required to specify the number of replicates (n) and the distribution of the biological response ( ) by setting its mean and SD. Using these inputs, MetAssimulo 2.0 samples values to calculate the sample mean and sample SD for each metabolite and the response. This process allows for the computation of simulated concentrations for each metabolite based on equation (2). As with discrete outcomes, users have the option to input or upload their own concentration data for completely customized simulations.
2.2.3 Intra- and intermetabolite correlations
In both discrete and continuous outcome simulations, MetAssimulo 2.0 maintains the functionality of intra- and intermetabolite correlations as established in the original MetAssimulo (Muncey et al. 2010), ensuring that the relational dynamics between metabolites are accurately and reliably modeled. This functionality is detailed in Supplementary Material S1.3.
2.3 Simulated spectra for metabolite mixtures
Before simulating spectra for mixtures, it is crucial to preprocess the spectra of pure compounds to ensure they integrate effectively into the final metabolic profiles. The details for peak preprocessing can be found in Supplementary Materials S1.4 and S1.5.
2.3.1 Peak detection
Peak detection is a crucial step in the analysis of pure compound spectra, particularly essential for locating and shifting peaks accurately. In the case of 1D ^1^H spectra, MetAssimulo 2.0 introduces a more flexible and efficient peak detection method which involves locating peaks based on a user-defined intensity threshold, detecting and marking peak clusters by their intensity, and filtering out clusters without marked peaks. The approach used in MetAssimulo 1.0, depended on cross-referencing detected peaks with HMDB multiplet data which could be problematic when multiplet data are lacking in HMDB (see more details in Supplementary Material S1.6).
The peak detection method for 2D J-Res and COSY spectra aligns with the procedures established for 1D ^1^H spectra, with an additional preliminary step. For 2D J-Res spectra, a skyline projection (Fonville et al. 2010) along the chemical shift (F2) axis is conducted to obtain a projected 1D profile. Similarly, in COSY spectra, a diagonal projection is employed. These projections serve as inputs for Algorithm 2, as detailed in the Supplementary Material S1.6, facilitating the localization of peak clusters in the projected profiles of 2D spectral data.
2.3.2 Peak shift
In MetAssimulo 2.0, the approach for peak shifting in 1D ^1^H spectra adheres closely to the method established in MetAssimulo 1.0, incorporating pH variation as the primary factor for peak shifts. This process is quantified in equation (3), a transformation of the Henderson–Hasselbalch equation (Ackerman et al. 1996), tailored to address the pH-related shifts in NMR spectra (see the detailed derivation of the transformation in Supplementary Material S1.7).
where is the amount the peak is shifted in ppm; and are the positions of the peak in the acid and basic limits (ppm), respectively; is the pH of the standard spectrum, usually as 7.4; is the pH of the sample; is the pKa of the metabolite.
To facilitate this peak shifting, users are required to input the mean and SD of the pH values for their samples. Additionally, pKa values are typically retrieved from HMDB 5.0 (Wishart et al. 2022). In instances where pKa values are not available in HMDB, they are estimated by sampling from a normal distribution, with parameters (mean and SD) derived from Tredwell et al. (2016). This approach also extends to determining the mean and SD of the differences between acidic and basic limits, ensuring a comprehensive and precise shifting of NMR spectral peaks.
The peak shifting approach for 2D J-Res and COSY data parallels that of 1D spectral data. After peak clusters are detected on the projected profiles, the shifts are calculated using equation (3), in the same manner as 1D spectra. The detailed shifting process can be found in Supplementary Material S1.8.
3 Results
MetAssimulo 2.0 introduces advanced data simulation capabilities across three of the most common NMR spectra using in metabolomics: 1D, 2D J-Res, and 2D COSY. Each simulation involves three primary steps: selecting metabolites, simulating concentrations, and simulating final spectra. The detailed workflow for these processes is illustrated in Supplementary Material S2.1. This section presents case studies that utilize the key functionalities distinguishing MetAssimulo 2.0 from its predecessor, showcasing the advancements in simulation capabilities. For additional capabilities, including simulations with peak shifts and simulations of 2D COSY data without peak shifts, further details are available in Supplementary Figs S2 and S3.
3.1 1D simulation
3.1.1 Simulation of blood mixtures with protein background
Figure 1a illustrates the comparison between a simulated blood spectrum with protein background (blue) and the real blood spectrum (orange), calibrated to the glucose peak at 5.23 ppm. The addition of the albumin spectrum to the simulated blood general profile provides a very realistic picture as shown for the good overlap with the real blood spectrum. The main remaining discrepancy is the macromolecule profile in regions where lipoprotein signals are observed such as from 0 to 2 ppm. Despite these differences, the simulation effectively captures both high-intensity signals, such as lactate, and low-intensity signals like alanine, 3-hydroxybutyric acid, and valine, illustrating the spectrum’s realistic representation across a range of metabolite concentrations.
(a) Comparison between the simulated and real 1D 1H NMR spectrum for blood. (b) PCA score plot of the first two principal components derived from the simulated spectra, colored by the BMI values. (c) Average spectrum of 100 replicates colored by the loadings on PC2; Pearson correlation coefficients between the metabolite concentration and BMI are shown in brackets. (d) Simulated 2D J-Res urine spectrum. (e) Real 2D J-Res urine spectrum.
3.1.2 Simulation of continuous outcomes
To explore the feature of simulating continuous outcomes, we examined how metabolites are associated with BMI. Based on Moore et al. (2014), we identified 10 metabolites correlated with BMI: valine, isoleucine, tyrosine, leucine, glycerol, phenylalanine, lactate, asparagine, glycine, and histidine. Simulations were run for 100 replicates of blood mixtures containing these metabolites, without peak shifts. The statistical parameters including means, SD, and the correlation coefficients with BMI for these metabolites are detailed in Supplementary Table S2.
Subsequent principal component analysis (PCA) on the simulated spectra assessed how variations in these metabolites correlate with BMI. As shown in Fig. 1b, the second principal component (PC2) captures most of the BMI-related variance. The average spectrum from the 100 replicates, colored by loading scores on PC2, is depicted in Fig. 1c. Here, lactate exhibits the highest loading on PC2, highlighting its strong correlation with BMI. Other metabolites, including isoleucine, tyrosine, and histidine, also show notable loadings, underscoring their relationship to BMI. Such a simulation could provide a robust dataset for training machine learning algorithms in metabolic and epidemiological studies aimed at identifying metabolites associated with disease, or to calculate statistical power, for example.
3.2 2D simulation
3.2.1 Simulation of urine mixtures in J-Res
Figure 1d shows a simulated J-Res spectrum of human urine, compared with a real J-Res spectrum in Fig. 1e. The comparison (0.8–4.5 ppm; full spectra can be found in Supplementary Fig. S4) reveals that the simulated spectrum, although not as densely populated as the real spectrum, still accurately reflects the spectral features of high and medium abundance metabolites such as creatinine and citric acid. The difference in density is due to the simulated spectrum containing 52 metabolites, whereas the real urine spectrum comprises more metabolites including many at lower levels. Despite this, both spectra display some considerable similarities, illustrating the effectiveness of the simulation in capturing key urinary metabolites. An arbitrary level of realism could be achieved by expanding the library to include more metabolites.
4 Conclusion
MetAssimulo 2.0 significantly enhances the simulation of NMR metabolic profile spectra, supporting a diverse range of experiments across three different biofluids and both 1D and 2D NMR techniques (Supplementary Table S3 summarizes differences between MetAssimulo 2.0 and MetAssimulo 1.0). This advancement opens new avenues for future developments in spectral data analysis, presenting extensive opportunities for research in metabolomics.
Supplementary Material
btaf045_Supplementary_Data
The reference list from the paper itself. Each links out to its DOI / PubMed record.
- 1Ackerman JJH , Soto GE, Spees WM et al The NMR chemical shift PH measurement revisited: analysis of error and modeling of a PH dependent reference. Magn Reson Med 1996;36:674–83.8916017 10.1002/mrm.1910360505 · doi ↗ · pubmed ↗
- 2Atieh Z , Suhre K, Bensmail H. Metflexo: an automated simulation of realistic H 1-NMR spectra. Procedia Comput Sci 2013;18:1382–91. 10.1016/j.procs.2013.05.305 · doi ↗
- 3Beckonert O , Keun HC, Ebbels TMD et al Metabolic profiling, metabolomic and metabonomic procedures for NMR spectroscopy of urine, plasma, serum and tissue extracts. Nat Protoc 2007;2:2692–703.18007604 10.1038/nprot.2007.376 · doi ↗ · pubmed ↗
- 4Cobas C , Seoane F, Vaz E et al Automatic assignment of 1H-NMR spectra of small molecules. Magn Reson Chem 2013;51:649–54. https://doi.org/10.1002/mrc.399524038382 10.1002/mrc.3995 · doi ↗ · pubmed ↗
- 5Dashti H , Westler WM, Tonelli M et al Spin system modeling of nuclear magnetic resonance spectra for applications in metabolomics and small molecule screening. Anal Chem 2017;89:12201–8.29058410 10.1021/acs.analchem.7b 02884 PMC 5705194 · doi ↗ · pubmed ↗
- 6Dona AC , Kyriakides M, Scott F et al A guide to the identification of metabolites in NMR-based metabonomics/metabolomics experiments. Comput Struct Biotechnol J 2016;14:135–53. 10.1016/j.csbj.2016.02.00527087910 PMC 4821453 · doi ↗ · pubmed ↗
- 7Fonville JM , Maher AD, Coen M et al Evaluation of full-resolution J-resolved 1H NMR projections of biofluids for metabonomics information retrieval and biomarker identification. Anal Chem 2010;82:1811–21.20131799 10.1021/ac 902443 k · doi ↗ · pubmed ↗
- 8Judge MT , Ebbels TMD. Problems, principles and progress in computational annotation of NMR metabolomics data. Metabolomics 2022;18:102.36469142 10.1007/s 11306-022-01962-z PMC 9722819 · doi ↗ · pubmed ↗