Vitamin and mineral supplements and fatigue: a prospective study
Sisi Xie, Pedro Marques-Vidal, Vanessa Kraege

TL;DR
This study found no consistent link between vitamin/mineral supplements and reduced fatigue, and some evidence that these supplements may increase fatigue in some users.
Contribution
The study provides new population-based evidence on the mixed effects of vitamin/mineral supplements on fatigue.
Findings
No association was found between VMS consumption and changes in fatigue severity scales.
VMDS users tended to develop greater fatigue compared to non-consumers.
Alternate or persistent supplement users had higher incidence of clinical fatigue.
Abstract
The consumption of vitamin/mineral supplements (VMS) and vitamin/mineral and/or dietary supplements (VMDS) is popular among the general population. However, the association of VMS/VMDS with fatigue remains sparse and conclusions are mixed. We aimed to understand the association between VMS/VMDS and fatigue. Prospective study in the city of Lausanne, Switzerland, including 1361 participants (50.3% female, mean age 61.0 ± 9.4 years). Participants were divided into VMS/VMDS users and non-users. Fatigue levels were assessed using the Fatigue Severity Scale (FSS) and the 14-item version of the Chalder Fatigue Scale (CFS). Statistical analyses included multivariable logistic regression for categorical outcomes and analysis of variance for continuous outcomes, adjusting for relevant covariates. No association was found between VMS consumption and changes in FSS (mean ± standard error 0.05 ±…
Genes, proteins, chemicals, diseases, species, mutations and cell lines named across the full text — each resolved to its canonical identifier and authoritative record.
Click any figure to enlarge with its caption.
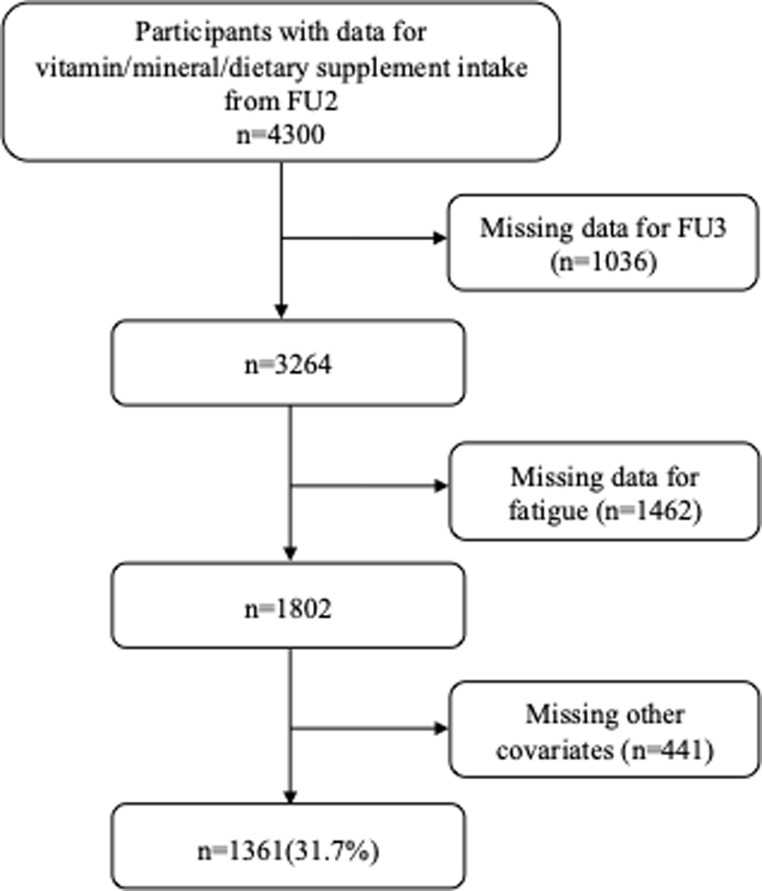 Figure 1
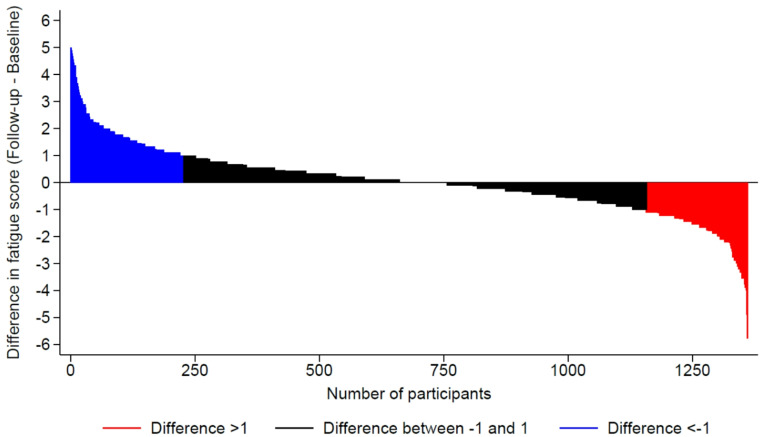 Figure 2
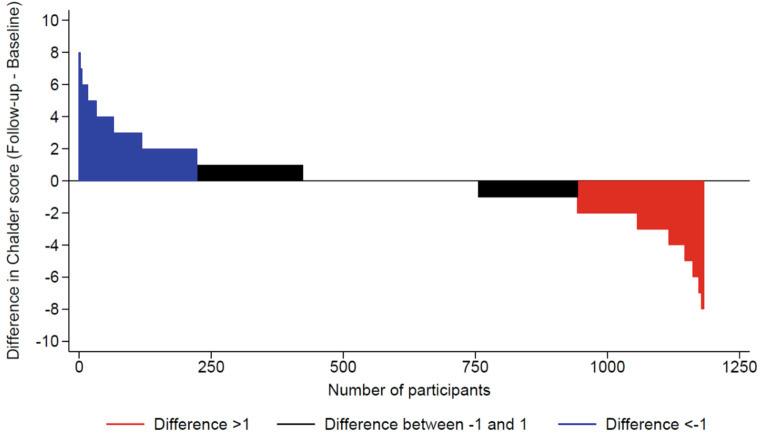 Figure 3
- —University of Lausanne
Peer Reviews
No public reviews on file for this paper yet. If you reviewed it on a platform where reviews are public (OpenReview, ICLR, NeurIPS, ICML), you can paste yours below so the community can read it here.
Videos
No videos yet. Explain this paper in a talk, walkthrough, or lecture? Add one.
Taxonomy
TopicsFibromyalgia and Chronic Fatigue Syndrome Research · Biochemical effects in animals · Antioxidant Activity and Oxidative Stress
Introduction
Fatigue is a common symptom in primary care, usually characterized by low energy, mental exhaustion, and poor muscle endurance. It can have a negative impact on work, family, and society [1]. Fatigue encompasses complex physiological and psychological processes. Biologically, it is closely associated with disorders in energy metabolism. For instance, abnormalities in mitochondrial structure and function can result in inadequate cellular energy production, leading to fatigue [2–4]. Additionally, inflammation, immune system dysregulation, impaired hypothalamic-pituitary-adrenal axis function, and neuroendocrine disorders can negatively impact an individual’s mental state and contribute to fatigue [5–7]. Psychological factors, including chronic stress, depressive symptoms, and sleep disturbances, also play significant roles in the development of fatigue [8–10]. In healthy people, the underlying cause for fatigue is often unknown, and treatment options are scarce; thus, attempts to alleviate or prevent fatigue through nutritional supplements have emerged as a possibility.
The consumption of vitamin/mineral supplements (VMS) and vitamin/mineral and/or dietary supplements (VMDS) is popular among the general population. In Switzerland, 16.8% of the population aged 35 to 75 uses multivitamin and mineral supplements [11]. In the United States, there is a multibillion-dollar dietary supplement industry, at least one-third of which is sold as vitamin/mineral pills and beverages [12]. Research investigating the association between VMS/VMDS and fatigue in the general population is limited and has produced inconsistent findings. Some studies suggest that supplementation with VMS/VMDS can partially alleviate fatigue [13]. However, other research indicates that VMS/VMDS have no significant effect on reducing fatigue [14–16]. Although VMS are beneficial for people with certain clinical diseases [17–20], and with nutritional deficiencies [21, 22], in the general population, most individuals can meet their needs through a healthy diet, so micronutrient supplements are unlikely to be of any benefit [23] and may on the contrary be harmful if taken in excess [12]. Still, most people believe that taking supplements regularly will help them stay healthy, prevent disease, and live longer. This belief is further increased by an aggressive marketing of VMS and VMDS producers, who promote their products as a remedy against fatigue (https://www.naturalia.fr/esprit-bio/parlons-bio/vitamines-contre-la-fatigue, https://nutriandco.com/fr/pages/vitamine-contre-la-fatigue).
Therefore, we aimed to examine the association between VMS, VMDS and fatigue over a mean follow-up of 3.8 years by using data from a population-based prospective study to clarify and solidify recommendations and ensure accurate, useful distribution of information at a population level.
Participants and methods
Participants and study design
We used data from CoLaus|PsyCoLaus (www.colauspsycolaus.ch), a population-based study initiated in 2003 with 6733 middle-aged participants from Lausanne, Switzerland to investigate the epidemiology and genetic determinants of cardiovascular risk factors [24]. Recruitment began in 2003 and ended in 2006. The first follow-up was performed between 2009 and 2012, the second between 2014 and 2017 and the third between 2018 and 2021.
Fatigue status was only collected in the second and the third follow-ups. Hence, for this study, data collected from the second (2014–2017) and third (2018–2021) follow-ups were examined, see supplementary Table 1 for more details. In addition, when we analyzed whether participants consumed VMS or VMDS continuously, we included data from the first follow-up of the original study (2009–2012). We define “never” as no consumption at the first (2009–2012) and second (2014–2017) follow-ups of the original study, “alternate” as consumption at the first or second follow-up and “persistent” as consumption at both the first and second follow-ups.
Vitamin/Mineral/Dietary supplements consumption
Within each survey, participants were asked to report all prescribed and over-the-counter medications and supplements taken during the previous six months. Nonetheless, data on the dosages and frequency of these supplements were not obtained. Vitamin and mineral supplements were defined according to the Swiss compendium (compendium.ch/home/fr, assessed June 2017). If the supplements were not listed in the Swiss compendium, further searches on the internet were conducted. Due to wide differences in the composition of Swiss VMS [23] and to inaccurate reporting (i.e., reporting “multivitamins from producer X” that manufactures six different types of multivitamins), it was not possible to assess the amounts of vitamins and minerals consumed by participants. Dietary supplements were defined as any other supplement that could not be considered as a VMS, such as plant extracts not considered as phytotherapy by the Swiss compendium, cod liver oil, shark cartilage or amino acids.
Assessment of fatigue
Fatigue levels were assessed once within each survey using the Fatigue Severity Scale (FSS) and the 14-item version of the Chalder Fatigue Scale (CFS).
Fatigue during the previous week was assessed by the 9-item FSS [25]. This questionnaire has been validated for a general healthy population in the Swiss setting [26] and has a high test-retest reliability [27]. The questionnaire is composed of nine questions; responses are graded using a Likert scale from 1 to 7, where 1 indicates strong disagreement and 7 strong agreements. The final score is the mean value of the 9 responses, and a score ≥ 4 is considered as severe fatigue. Fatigue was also assessed using the 14-item CFS [28]. In this study, a binary coding (presence/absence) was applied to the items, at it has been shown that near-maximal scoring of the 14 items constituting the Chalder fatigue scale supports the validity of a two-point scoring rather than the four-point Likert scoring [29].
Changes in fatigue status were computed as follows: first, using dichotomous data (clinical fatigue yes/no) at follow-up 2 (FU2), we assessed the incidence of fatigue at follow-up 3 (FU3) among participants without fatigue at FU2, and remission of fatigue at FU3 among participants with fatigue at FU2, for FSS and CFS. Second, we computed the changes in FSS and CFS as the score at FU3 minus the score at FU2; a positive value denotes an improvement (decrease) in fatigue status. Third, we compared the FSS and CFS scales at FU3 between VMS (VMDS) consumers and non-consumers.
Relevant covariates
We selected potential confounding factors based on the literature on the relationship between VMS and fatigue. We selected age (years), sex (male/female), education, marital status, weekly alcohol consumption (units), smoking, hypertension (yes/no), diabetes (yes/no), body mass index (BMI) categories and quality of dietary intake, the collection of which is detailed below.
Education was categorized into high (university), middle (high school) and low (apprenticeship + mandatory). Marital status was defined as living alone (single, divorced, widowed) or with a partner. Usual alcohol consumption during the week was self-reported as number of units (glasses of wine, bottles or cans of beer, and shots of spirits) per week. Smoking was self-reported and categorized as never, former (irrespective of the time since quitting smoking) and current.
Body weight and height were measured with participants barefoot and in light indoor clothes. Body weight was measured in kilograms to the nearest 100 g using a Seca^®^ scale (Hamburg, Germany). Height was measured to the nearest 5 mm using a Seca^®^ (Hamburg, Germany) height gauge. BMI was calculated and categorized as normal (< 25 kg/m^2^), overweight ≥ 25 and < 30 kg/m^2^) and obese ≥ 30 kg/m^2^) [30].
Blood pressure (BP) was measured using an Omron^®^ HEM-907 automated oscillometric sphygmomanometer after at least a 10-minute rest in a seated position, and the average of the last two measurements was used. Hypertension was defined by a systolic BP ≥ 140 mm Hg or a diastolic BP ≥ 90 mm Hg or presence of antihypertensive drug treatment [31].
Glucose was assessed by glucose dehydrogenase. Diabetes mellitus (DM) was defined as fasting plasma glucose ≥ 7.0 mmol/L and/or presence of oral hypoglycaemic or insulin treatment [32].
Dietary intake was assessed using a self-administered, semi-quantitative food frequency questionnaire (FFQ) validated on the Geneva population [33]. Briefly, this FFQ assesses the dietary intake of the previous 4 weeks and consists of 97 different food items that account for more than 90% of the intake of calories, proteins, fat, carbohydrates, alcohol, cholesterol, vitamin D and retinol, and 85% of fibre, carotene, and iron. Dietary quality was assessed via the Alternative Healthy Eating Index (AHEI) adapted from McCullough et al. [34]. In our study, the amount of trans fat could not be assessed, and we considered all participants taking multivitamins as taking them for a duration ≥ 5 years. Thus, the modified AHEI score ranged between 2.5 and 77.5 instead of 2.5 and 87.5 for the original AHEI score. Higher values represented a healthier diet.
Exclusion criteria
We excluded participants with missing data for (1) follow-up 3; (2) fatigue; and (3) covariates.
Statistical analysis
Statistical analyses were conducted using Stata v.18 (Stata Corp, College Station, TX, USA). Descriptive results were expressed as number of participants (percentage) for categorical variables and as average ± standard deviation for continuous variables. Between-group comparisons were conducted using chi-square for categorical variables and student’s t-test for continuous variables. Multivariable analyses were conducted using logistic regression for categorical variables, and results were expressed as odds ratio and (95% confidence interval). Multivariable analyses were conducted using analysis of variance (ANOVA) for quantitative variables and results were expressed as adjusted mean ± standard error. Multivariable analyses were adjusted for the covariates defined previously.
As a significant number of participants were excluded, we conducted sensitivity analyses using inverse probability weighting as defined previously [35]. First, we computed the probability of being included using a logistic model including the variables that differed significantly between included and excluded participants, then we used the inverse of this probability as weight for the multivariable logistic models described previously.
Statistical significance was considered for a two-sided test with p < 0.05.
Results
Selection of participants
Of the initial 4300 participants, 1361 (31.7%) were included in the analyses. The reasons for exclusion are indicated in Fig. 1 and the comparison between included and excluded participants is provided in Supplementary Table 2. Compared with the included participants, excluded participants were older, more frequently female, living alone, abstaining from alcohol, and with lower education levels, and more frequently with hypertension, diabetes, obesity, and lower total energy intake. Excluded participants scored higher than included participants regarding FSS and CFS.
Fig. 1. Selection of participants from FU2 (2014–2017). CoLaus study, Lausanne, Switzerland
Among participants enrolled in the study at the FU2, 79 (5.8%) consumed VMS and 350 (25.7%) consumed VMDS. Table 1 summarizes the characteristics of participants according to VMS and VMDS consumption. Compared with participants who did not consume VMS, participants who consumed VMS were more frequently female, lived alone, and had higher education levels and AHEI (Table 1). Compared with participants who did not consume VMDS, participants who consumed VMDS were older, more frequently female, highly educated, lived alone, abstaining from alcohol, and non-obese, and had a higher AHEI (Table 1).
Table 1. Characteristics of the participants, according to VMS use, FU2 (2014–2017) of the CoLaus|PsyColaus study, Lausanne, SwitzerlandVMS non-consumers(n = 1282)VMS consumers(n = 79)P-valueVMDS non-consumers(n = 1011)VMDS consumers(n = 350)P-valueAge (years)61.0 ± 9.561.0 ± 9.00.98960.7 ± 9.362.1 ± 9.7 0.015 Women (%)634 (49.5)51 (64.6) 0.009 458 (45.3)227 (64.9)P < 0.001Educational level (%) 0.028
0.028 Low572 (44.6)26 (32.9)461 (45.6)137 (39.2) Middle402 (31.4)24 (30.4)317 (31.4)109 (31.1) High308 (24.0)29 (36.7)233 (23.0)104 (29.7)Marital status, % 0.002
0.002 Living alone406 (31.7)38 (48.1)306 (30.3)138 (39.4) Living in a couple876 (68.3)41 (51.9)705 (69.7)212 (60.6)Alcohol consumption, %0.758 0.029 None238 (18.6)18 (22.8)172 (17.0)84 (24.0) 1–13 units/week852 (66.5)48 (60.8)681 (67.4)219 (62.6) 14–27 units/week162 (12.6)11 (13.9)135 (13.3)38 (10.8) 28 + units/week30 (2.3)2 (2.5)23 (2.3)9 (2.6)Smoking categories (%)0.4790.371 Never525 (41.0)27 (34.2)421 (41.6)131 (37.4) Former521 (40.6)35 (44.3)404 (40.0)152 (43.4) Current236 (18.4)17 (21.5)186 (18.4)67 (19.2)BMI categories (%)0.371 0.027 Normal574 (47.8)32 (40.5)433 (42.8)173 (49.4) Overweight518 (40.4)38 (48.1)417 (41.3)139 (39.7) Obese190 (14.8)9 (11.4)161 (15.9)38 (10.9)Hypertension (%)524 (40.9)30 (38.0)0.611416 (41.2)138 (39.4)0.573Diabetes (%)90 (7.0)3 (3.8)0.27171 (7.0)22 (6.3)0.638Total energy intake (kcal/d)1735 ± 6161611 ± 4910.0811733 ± 6131713 ± 6000.595AHEI31.9 ± 10.035.7 ± 10.1 0.001 31.2 ± 9.734.7 ± 10.6P < 0.001Results are expressed as number of participants (column percentage) for categorical variables and as average ± standard deviation for continuous variables. Between-group comparisons performed using chi-square for categorical variables and student’s t-test for continuous variables. Abbreviations: VMS: Vitamin/mineral supplements; VMDS: Vitamin/mineral and/or dietary supplements; BMI: Body mass index; AHEI: Alternate Healthy Eating Index
Association between VMS and VMDS consumption and change in fatigue indicators
A summary of the association between VMS consumption and changes in fatigue indicators after a median follow-up of 3.8 (interquartile range: 3.6–3.9) years is shown in Table 2. In bivariate and multivariable analyses, there was no association between VMS consumption and changes of FSS and CFS, incidence or remission of clinical fatigue, and fatigue scores at FU3 (Table 2). Figures 2 and 3 show the differences between FU3 and FU2 in FSS and CFS, respectively.
A summary of the association between VMDS consumption and changes in fatigue indicators is shown in Table 3. In bivariate and multivariable analyses, there was no association between VMDS consumption and changes of CFS and FSS, remission of clinical fatigue (Table 3). However, participants consuming VMDS had higher incidence of clinical fatigue and CFS (Table 3).
Using inverse probability weighting to correct for exclusions led to similar findings (supplementary Table 3).
Table 2. Bivariate and multivariable associations between VMS consumption and changes in fatigue, CoLaus|PsyColaus study, Lausanne, SwitzerlandBivariateMultivariableVMS non-consumersVMS consumersP-valueVMS non-consumersVMS consumersP-valueIncident clinical fatigue^1^1 (ref.)1.63 (0.78–3.42)0.1931 (ref.)1.75 (0.82–3.74)0.149Remission of clinical fatigue ^2^1 (ref.)1.17 (0.47–2.92)0.7421 (ref.)1.36 (0.49–3.74)0.550Changes in Fatigue score^3^0.05 ± 0.03-0.05 ± 0.140.4620.05 ± 0.03-0.06 ± 0.140.440Changes in Chalder score^4^-0.05 ± 0.060.18 ± 0.280.415-0.05 ± 0.060.22 ± 0.280.338Fatigue score^5^2.83 ± 1.382.99 ± 1.410.3142.83 ± 0.042.95 ± 0.160.439Chalder score^5^5.54 ± 2.476.13 ± 2.790.0695.54 ± 0.076.02 ± 0.310.139Results are expressed as average ± standard deviation for bivariate analysis and as multivariable-adjusted average ± standard error or odds ratio and 95% confidence interval. Between group comparison using ANOVA or logistic regression, multivariable analysis adjusted for age, sex, BMI categories (normal, overweight, obese), education(low/medium/high), marital status (alone, in couple), smoking (never, former, current), alcohol consumption (none, 1–13, 14–27 and 28 + per week), hypertension (yes, no), diabetes (yes, no), total energy intake (continuous), AHEI (continuous). Abbreviations: VMS: Vitamin/mineral supplements; 1: among participants who did not have clinical fatigue at FU2. 2: among participants with clinical fatigue at FU2. 3: The change in Fatigue score is the Fatigue score at FU3 minus the fatigue score at FU2. 4: The change in Chalder score is the Chalder score at FU3 minus the fatigue score at FU2. 5: The value of the FU3
Fig. 2. Differences in Fatigue Severity Scale between the FU3 and the FU2
Fig. 3. Differences in Chalder Fatigue Scale between the FU3 and the FU2
Table 3. Bivariate and multivariable associations between VMDS consumption and changes in fatigue, CoLaus|PsyColaus study, Lausanne, SwitzerlandBivariateMultivariableVMDS non-consumersVMDS consumersP-valueVMDS non-consumersVMDS consumersP-valueIncident clinical fatigue^1^1 (ref.)1.64 (1.07–2.49) 0.022 1 (ref.)1.96 (1.20–3.20) 0.008 Remission of clinical fatigue^2^1 (ref.)0.85 (0.50–1.44)0.5421 (ref.)1.14 (0.57–2.31)0.712Changes in Fatigue score^3^0.06 ± 0.040.01 ± 0.060.5620.06 ± 0.040 ± 0.080.577Changes in Chalder score^4^0 ± 0.07-0.16 ± 0.130.269-0.07 ± 0.080.04 ± 0.150.545Fatigue score^5^2.77 ± 1.353.01 ± 1.48 0.005 2.78 ± 0.052.99 ± 0.090.053Chalder score^5^5.42 ± 2.416.03 ± 2.67P < 0.0015.44 ± 0.095.98 ± 0.17 0.008 Results are expressed as average ± standard deviation or number of participants (column percentage) for bivariate analysis and as multivariable-adjusted average ± standard error or odds ratio and 95% confidence interval. Between group comparison using ANOVA or logistic regression, multivariable analysis adjusted for age, sex, BMI categories (normal, overweight, obese), education(low/medium/high), marital status (alone, in couple), smoking (never, former, current), alcohol consumption (none, 1–13, 14–27 and 28 + per week), hypertension (yes, no), diabetes (yes, no), total energy intake (continuous), AHEI (continuous). Abbreviations: VMDS: Vitamin/mineral and/or dietary supplements; 1: among participants who did not have clinical fatigue at FU2. 2: among participants with clinical fatigue at FU2. 3: The change in Fatigue score is the Fatigue score at FU3 minus the fatigue score at FU2. 4: The change in Chalder score is the Chalder score at FU3 minus the fatigue score at FU2. 5: The value of the FU3
Association between VMS and VMDS (non) persistent consumption and change in fatigue indicators
The association between never, alternate, or persistent VMS and VMDS consumption and fatigue indicators at follow-up are indicated in Table 4. For VMS, multivariable analysis showed that alternate or persistent VMS consumers had a higher incidence of clinical fatigue compared with never consumers. Similar findings were obtained for VMDS, alternate or persistent consumers having a higher incidence of clinical fatigue than never consumers and FSS. Using inverse probability weighting to correct for exclusions led to similar findings (supplementary Table 4).
Table 4. The association between VMS and VMDS consumption based on the FU1 (2009–2012) and the FU2 (2014–2017) of the original study, and evolution of fatigue between FU2 (2014–2017) and FU3 (2018–2021), CoLaus|PsyColaus study, Lausanne, SwitzerlandNeverAlternatePersistentP-value for trendFor VMS consumption Incident clinical fatigue^1^1 (ref.)1.27 (0.58–2.79)3.81 (1.31–11.12) 0.014 Remission of clinical fatigue ^2^1 (ref.)1.56 (0.66–3.68)ncnc Changes in Fatigue score^3^0.05 ± 0.03-0.12 ± 0.120.57 ± 0.270.053 Changes in Chalder score^4^-0.06 ± 0.070.07 ± 0.240.72 ± 0.530.145 Fatigue score^5^2.81 ± 0.043.05 ± 0.143.13 ± 0.30.291 Chalder score^5^5.53 ± 0.076.02 ± 0.275.71 ± 0.590.759 For VMDS consumption Incident clinical fatigue^1^1 (ref.)1.36 (0.82–2.26)2.73 (1.42–5.27) 0.003 Remission of clinical fatigue ^2^1 (ref.)1.22 (0.62–2.4)0.7 (0.22–2.17)0.531 Changes in Fatigue score^3^0.06 ± 0.04-0.03 ± 0.070.14 ± 0.120.544 Changes in Chalder score^4^-0.07 ± 0.08-0.02 ± 0.140.14 ± 0.240.427 Fatigue score^5^2.79 ± 0.052.86 ± 0.083.15 ± 0.14 0.017 Chalder score^5^5.45 ± 0.095.83 ± 0.165.9 ± 0.270.119Nc, not computable. Results are expressed as multivariable-adjusted average ± standard error or odds ratio and 95% confidence interval. Between group comparison using ANOVA or logistic regression adjusting for age, sex, BMI categories (normal, overweight, obese), education(low/medium/high), marital status (alone, in couple), smoking (never, former, current), alcohol consumption (none, 1–13, 14–27 and 28 + per week), hypertension (yes, no), diabetes (yes, no), total energy intake (continuous), alternate healthy eating index (continuous). Abbreviations: VMS: Vitamin/mineral supplements; VMDS: Vitamin/mineral and/or dietary supplements. 1: among participants who did not have clinical fatigue at FU2. 2: among participants with clinical fatigue at FU2. 3: The change in Fatigue score is the Fatigue score at FU3 minus the fatigue score at FU2. 4: The change in Chalder score is the Chalder score at FU3 minus the fatigue score at FU2. 5: The value of the FU3
Discussion
In this study, we investigated the association between VMS consumption and VMDS and fatigue in community-dwelling Swiss adults. Our prospective study failed to find any evidence of a beneficial effect of VMS and VMDS consumption and changes in fatigue status.
Association between VMS and VMDS and fatigue
There are few studies on the potential association between vitamins and minerals and dietary supplements and fatigue in the general population, and the conclusions are mixed. Therefore, in Supplementary Table 5 we summarize the effects of oral vitamins and minerals and dietary supplements on fatigue, according to literature.
Vitamin and mineral supplements
Several studies have shown that individual supplements of vitamin B1 [36], vitamin B12 [37], vitamin C [17, 38], vitamin D [21, 39, 40], vitamin E [41], as well as iron [42, 43], and zinc [44] can relieve fatigue symptoms. Similarly, supplementing with a variety of vitamins and minerals can also reduce fatigue to a certain extent [13].
However, contrary to the above positive results, several studies found no effect of vitamin or mineral supplements in reducing fatigue. A randomized controlled trial showed that oral vitamin D3 did not improve fatigue in patients with chronic fatigue syndrome [14]. Data from Brouwers et al. found no statistically significant relationship between multivitamins and mineral supplementation and symptoms of chronic fatigue syndrome [15]. Also, a meta-analysis revealed that vitamin and mineral status did not lead to clinical improvement in chronic fatigue syndrome [16].
We found that, for participants devoid of fatigue at FU2, after 3.8 years of follow-up, VMS consumption had no effect on the incidence of fatigue. Moreover, for participants who presented with fatigue at FU2, after 3.8 years of follow-up, consuming VMS had no effect on remission. Hence, our results confirm the negative findings of previous studies [14–16].
However, interestingly, when we categorized VMS consumption as never, alternate, and persistent, and among participants devoid of fatigue at FU2, participants who consumed VMS alternatively or persistently had a higher prevalence of clinical fatigue at follow-up and a higher increase in FSS score than participants who never consumed VMS. One possible explanation for this finding is that some participants consume VMS to avoid fatigue in the future. Still, as no information was collected regarding the reason to consume VMS, further studies are needed to clarify this issue.
Dietary supplements
As shown in Supplementary Table 5, supplements such as dietary polysaccharides [45], coenzyme Q10 [46, 47], omega-3 polyunsaturated fatty acids [48], dietary nitrate [49, 50], soluble dietary fiber [51], astaxanthin and sesamin [52], acetyl L-carnitine [53], superoxide dismutase-melon concentrate supplementation [54], and gut probiotics [55] have been suggested to reduce fatigue burden. However, two systematic reviews found limited evidence that dietary supplements can help relieve symptoms of chronic fatigue syndrome, findings being inconsistent across studies [56, 57]. Another study showed no significant association between dietary supplement intake and fatigue severity or functional impairment [58].
In our study, among participants devoid of fatigue at FU2, those who consumed VMDS had a higher incidence of fatigue and had higher FSS and CFS scores after 3.8 years of follow-up than those who did not consume VMDS. Similar findings were obtained when we categorized VMDS consumption as never, alternate, and persistent, persistent consumers having a higher incidence of fatigue and higher FSS scores after 3.8 years of follow-up.
For participants who presented with fatigue at FU2, after 3.8 years of follow-up, consuming VMDS had no effect on remission, and similar findings were obtained when we categorized VMDS consumption as never, alternate, and persistent. Again, a possible explanation is that participants consume VMDS in the hope of reducing the fatigue that may occur.
Potential mechanisms and explanations
The reasons why this study failed to find a beneficial effect of VMS and VMDS on fatigue may include the following: (1) Most of the general population already meets their micronutrient requirements through a balanced diet. Therefore, additional supplement intake may not bring additional benefits in terms of fatigue reduction. In some cases, excessive intake of certain vitamins and minerals may even lead to adverse reactions, which may aggravate fatigue symptoms [12]. (2) The association we observed between continuous or occasional use of supplements and increased fatigue prevalence may reflect reverse causation. That is, individuals who feel tired are more likely to use supplements in the hope of relieving symptoms, rather than supplements causing fatigue. This self-selection bias complicates the interpretation of observational data. (3) Fatigue is a multifactorial condition that is affected by a combination of biological, psychological, and social factors. VMS and VMDS may not address the complex mechanisms that cause fatigue, such as chronic inflammation, hormone imbalance, or psychological stress. Effective fatigue management may require comprehensive lifestyle adjustments, psychological interventions, and targeted medical treatments. (4) The effectiveness of supplements may vary depending on their formulation, dosage, and bioavailability. Differences in product quality and the presence of other active or inactive ingredients may affect their potential effects on fatigue, leading to inconsistent study results.
Strengths and limitations
This is a prospective study with a large population-based sample, making our findings more generalizable than studies conducted in experimental settings or within specific populations such as athletes [36, 51]. Second, we used two methods to quantify/classify fatigue, leading to similar findings.
Our study also has some limitations. First, the inaccurate reporting of VMS composition and dosages by the participants prevented us from assessing the amount of vitamins and minerals consumed by participants. Second, the study was conducted in a limited geographical location, which might not be representative of the entire country. Still, the prevalence of VMS or VMDS users was similar to other countries [59, 60]. Third, possible reverse causation (i.e., participants taking VMS/VMDS to prevent fatigue) cannot be excluded, although it is unlikely that participants consuming VMS/VMDS did so to prevent fatigue over a 5-year period.
Conclusion
In this Swiss population-based sample, no consistent association was found between the consumption of VMS and VMDS and fatigue incidence or remission. Therefore, in the general population, consumption of VMS and VMDS does not have a significant impact on fatigue.
Electronic supplementary material
Below is the link to the electronic supplementary material.
Supplementary Material 1
Supplementary Material 2
The reference list from the paper itself. Each links out to its DOI / PubMed record.
- 1Costantini A, Pala MI, Tundo S, Matteucci P (2013) High-dose thiamine improves the symptoms of fibromyalgia. BMJ Case Rep 2013:. 10.1136/bcr-2013-00901910.1136/bcr-2013-009019 PMC 366983123696141 · doi ↗ · pubmed ↗
- 2Zhou Y, Chu Z, Luo Y et al (2023) Dietary polysaccharides exert anti-fatigue functions via the gut-muscle Axis: advances and prospectives. Foods 12. 10.3390/foods 1216308310.3390/foods 12163083 PMC 1045351637628082 · doi ↗ · pubmed ↗
- 3Castro-Marrero J, Segundo MJ, Lacasa M et al (2021) Effect of Dietary Coenzyme Q 10 Plus NADH supplementation on fatigue perception and health-related quality of life in individuals with myalgic Encephalomyelitis/Chronic fatigue syndrome: a prospective, randomized, Double-Blind, placebo-controlled trial. Nutrients 13. 10.3390/nu 1308265810.3390/nu 13082658 PMC 839924834444817 · doi ↗ · pubmed ↗
- 4Imai A, Oda Y, Ito N et al (2018) Effects of Dietary supplementation of astaxanthin and sesamin on daily fatigue: a Randomized, Double-Blind, Placebo-Controlled, two-way crossover study. 10.3390/nu 10030281. Nutrients 10:10.3390/nu 10030281 PMC 587269929495607 · doi ↗ · pubmed ↗
- 5Kim H, Park SG (2023) Effect of a single multi-vitamin and Mineral supplement on Nutritional Intake in Korean Elderly: Korean National Health and Nutrition Examination Survey 2018–2020. Nutrients 15: 10.3390/nu 1507156110.3390/nu 15071561 PMC 1009702637049402 · doi ↗ · pubmed ↗
- 6Blumberg JB, Frei BB, Fulgoni VL et al (2017) Impact of frequency of Multi-Vitamin/Multi-Mineral supplement intake on nutritional adequacy and nutrient deficiencies in U.S. adults. Nutrients 9. 10.3390/nu 908084910.3390/nu 9080849 PMC 557964228792457 · doi ↗ · pubmed ↗