The EQ-5D-3L valuation study for Bermuda: using an on-line EQ-VT protocol
Henry Bailey, Bram Roudijk, Ricky Brathwaite

TL;DR
This study created a health valuation set for Bermuda using online surveys, which can help in healthcare decision-making.
Contribution
The novel contribution is the successful online valuation study in Bermuda, yielding unique health outcome values.
Findings
A hybrid model produced consistent and significant coefficients for EQ-5D-3L valuation in Bermuda.
The lowest EQ VAS and index values were 20 and -0.120, respectively.
Bermuda's values differ from those of other countries.
Abstract
In many countries, methods of economic evaluation and Health Technology Assessment are used to inform healthcare resource allocation decisions. These approaches often require EQ-5D health outcomes measures. This study aimed to create an EQ-5D-3L value set for Bermuda from which EQ-5D-5L Crosswalk values could be obtained. Respondents in Bermuda were recruited locally. A team of Trinidad-based interviewers with prior EQ-5D-3L valuation experience conducted valuation interviews on-line using the EQ-VT protocol. Respondents completed composite time-trade off (cTTO) and discrete choice experiment (DCE) tasks. A hybrid model that included both the cTTO and DCE data was estimated. An EQ-5D-5L crosswalk value set was then created from the EQ-5D-3L index values. Coefficients in the resulting crosswalk model were compared with those of crosswalk and valuation studies from other countries. The…
Genes, proteins, chemicals, diseases, species, mutations and cell lines named across the full text — each resolved to its canonical identifier and authoritative record.
Click any figure to enlarge with its caption.
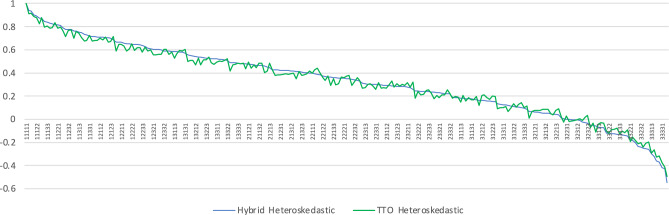 Figure 1
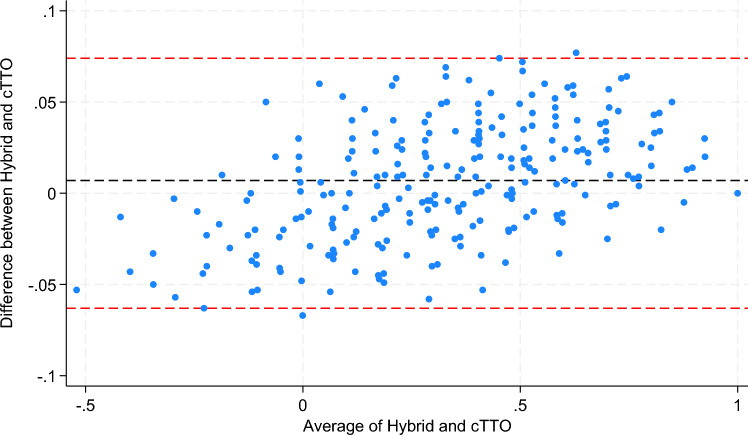 Figure 2
- —Bermuda Health Council
- —http://dx.doi.org/10.13039/501100006419EuroQol Research Foundation
Peer Reviews
No public reviews on file for this paper yet. If you reviewed it on a platform where reviews are public (OpenReview, ICLR, NeurIPS, ICML), you can paste yours below so the community can read it here.
Videos
No videos yet. Explain this paper in a talk, walkthrough, or lecture? Add one.
Taxonomy
TopicsHealth Systems, Economic Evaluations, Quality of Life · Economic and Environmental Valuation · Healthcare Policy and Management
Introduction
All health systems (large and small) face challenges of allocating scarce resources [1]. As epidemiological trends and available technologies develop, these challenges become more complex and urgent. Many large, developed countries now have well established formalized arrangements in place for Health Technology Assessment (HTA) to inform resource allocation decision-making in healthcare. Health systems in several smaller and developing countries are also gradually turning to similar tools [2].
With per capita gross domestic product (GDP) of US$119,000 [3], a population estimated at 64,000 and high spending on health (11.6% of GDP [4]), Bermuda has achieved a relatively high average life expectancy of 81.8 [5]. Despite the high absolute and relative levels of spending on healthcare and favourable life expectancy, the health system in Bermuda faces similar challenges to other countries such as the growth and effect of non-communicable diseases (NCDs), and issues related to access to healthcare [6, 7].
The Bermuda Health Strategy 2022–2027 [8] includes an agenda to deal with the challenges of healthcare resource allocation in Bermuda along with a plan to specifically address inequality. This agenda would be well served with health outcomes measures that can be used to quantify the burden of illness, measure and track the health status of patient- and demographic- groups over time, and to perform economic evaluations of health programmes and interventions. To this end, a decision was taken to create an EQ-5D value set for Bermuda. The EQ-5D-3L and EQ-5D-5L instruments are used as health outcomes measures for reimbursement decision making in many countries.
Different countries will have different EQ-5D value sets as health-state preferences are affected by local health infrastructure, culture and other factors [9]. EQ-5D valuation studies are undertaken using protocols that ensure that the resulting index values embody certain statistical and other properties that allow them to be used as Quality Adjusted Life Year (QALY) adjustments and in other health economics applications [10]. For many years, EQ-5D has been the instrument recommended by The National Institute for Health and Care Excellence (NICE) in the United Kingdom as the measure that should be used in technology appraisal [11]. EQ-5D index values can be used to estimate the burden of an illness in QALY terms.
The 3-level instrument (EQ-5D-3L) was introduced in 1990 [12]. A 5-level version of EQ-5D has recently been developed to improve the sensitivity of the instrument- particularly for mild health-states [13]. There is a protocol for a 5-level EQ-5D valuation study [14] that requires a minimum of 1,000 respondents performing valuation tasks in face-to-face interviews with trained interviewers. In very small populations it can be extremely difficult to obtain a representative sample of 1000 respondents. In the case of Bermuda this would require a sample exceeding 3% of the adult population. In such cases, those wishing to undertake EQ-5D valuation studies may opt to begin with a 3-level valuation study to create a 3 level value set (EQ-5D-3L), based upon which a 5-level value set (EQ-5D-5L) can be developed using a crosswalk algorithm [15].
The aim of this study was to create an EQ-5D-3L value set for Bermuda, based upon which an EQ-5D-5L value set was created using a crosswalk algorithm.
Methods
Study design
An interviewer-administered computer-based on-line survey of a representative sample of the Bermudian population was undertaken. The elicitation process followed the English language EQ-VT version 2.1 protocol [16] adapted for the EQ-5D-3L instrument. This study received exemption from ethical approval from the University of the West Indies (Letter #CREC-SA.1307/12/2021) and ethical approval from the Ethics Committee of the Bermuda Hospitals Board (letter dated March 23rd, 2022). We have followed the CREATE checklist for reporting valuation studies [17].
The EQ-5D-3L and EQ-5D-5L Instruments
EQ-5D is a health classification system that comprises five dimensions in order: mobility, (ability to perform) self-care, usual activities, pain/discomfort and anxiety/depression [18]. In the 3-level version of the instrument (EQ-5D-3L), a respondent can report one of three levels of problems on each dimension: no-, moderate-, or extreme- problems. The levels are coded 1, 2 and 3 respectively, allowing health states to be coded. Thus, a respondent or a patient who has no problems walking, no problems bathing or dressing themselves, some problems performing usual activities (work, study, leisure etc.), extreme pain or discomfort and moderate anxiety/depression would be in state 11232.
With 5 dimensions and 3 levels, there are 3^5^ = 243 possible states ranging from 11111 (no problems on all 5 dimensions) through 33333 (extreme problems on all dimensions). In an EQ-5D valuation study, a societal ‘value’ is obtained for each EQ-5D state. This is known as an EQ-5D index value, and it reflects the strength of preference or the value that the society places on each EQ-5D state relative to all other EQ-5D states.
The EQ VAS is another element of EQ-5D in which a respondent indicates their subjective valuation of their own state of health on a visual analogue scale ranging from 0 (worst imaginable health state) to 1 (best imaginable health state).
The EQ-5D-5L instrument was developed by including two intermediate levels: slight (between no- and moderate- problems) and severe (between moderate- and extreme- problems) on all five dimensions.
Sample
Respondents were recruited locally in Bermuda through a marketing firm, using their respondent panel. Eligibility criteria were Bermudian citizenship and being at least 18 years old. Quota sampling was used based on age and sex with a target of 350. The recruitment effort was supported by social media awareness-building along with television and radio interviews and outreach activities in high traffic retail outlets. Respondents in Bermuda received restaurant vouchers valued at US$18.00 for their participation.
Interview process
The interviews took place via videoconferencing software by a team of nine interviewers from a survey provider based in Trinidad and Tobago. Utilizing videoconferencing software for valuation interviews has been shown to be a viable strategy, producing results that are similar to those from conducting these interviews in a face to face setting [19, 20]. Members of the Trinidad and Tobago interviewer team had conducted two face-to-face EQ-5D valuation studies previously and had received one week of face-to-face training which was provided by two experienced EQ-5D researchers (HB and BR).
Interviewers used the EQ-VT software (version 2.1 English) for the on-line interviews. Respondents began by indicating consent and then moving to a ‘warm up task’ to build familiarity with the EQ-5D classification system by reporting their own health status on the 5 dimensions. During the valuation process, respondents were encouraged to think aloud so that interviewers could gauge their understanding of the tasks.
Respondents then moved on to the Composite Time Trade Off (cTTO) part of the survey. This began with another warm-up task to build familiarity with Time Trade Off (TTO) valuations in which respondents were asked to indicate preferences between being in a wheelchair for 10 years with being in full health for a smaller number of years. This was followed by another practice task considering either a health state much better or much worse than being in a wheelchair. Lastly, respondents practiced by valuing 3 EQ-5D-3L health states. Lead time TTO exercises were used to elicit ‘worse than dead’ valuations. This is a variant of TTO in which a lead period in full health is included in the choice task before the onset of the EQ-5D-3L state to be valued. Values for both the TTO and the lead-time TTO were subsequently inferred from the number of life years traded in those tasks (e.g. if a respondent is indifferent between 7 years in full health and 10 years in some state X, the value of that state X is 7/10 = 0.7). Data from the warm-up tasks were not used in the valuation analysis. Respondents then went on to complete 10 cTTO tasks presented in random order. Upon completion, respondents were presented the ranking of their answers to the cTTO tasks, and asked whether they agree with their answers, using the so-called feedback module.
The survey then moved on to the Discrete Choice Experiment (DCE) stage. Here respondents were presented with pairs of EQ-5D states and asked to indicate which state in each pair they preferred. One ‘warm-up’ pair was used to build familiarity with DCE tasks. Respondents then went on to complete 12 DCE tasks in random order. Details of cTTO and DCE tasks are provided elsewhere [14].
The EQ-VT protocol version 2.1 was used in the current study [16]. Although designed for the valuation of the EQ-5D-5L, similar procedures have been fielded previously for the valuation of EQ-5D-3L [21–23]. The only difference with an EQ-5D-5L valuation study using this protocol is that EQ-5D-3L health states are valued rather than EQ-5D-5L health states, and therefore the selection of states for the cTTO and DCE tasks is different from the one used in the EQ-5D-5L.
Quality control
Quality control measures were implemented as outlined in the EQ-VT protocol [24]. The investigators monitored the data to ensure quality by checking to make sure that:
- Each interviewer took at least 3 min to explain the cTTO warm-up task
- Each interviewer explained the lead time in the worse-than-dead task
- Each respondent took at least 5 min to complete the 10 cTTO tasks
- EQ-5D state 33333 (the worst possible state) did not receive a higher value than any other state for a respondent or for an interviewer
Interviews were flagged if the interview met at least one of these criteria. If an interviewer had 4 or more flags in a batch of 10 interviews, they were retrained and the collected batch of data was removed. Furthermore, the distributions of cTTO data were compared between interviewers throughout the study, to avoid any major interviewer effects. Regular on-line quality control meetings were held to ensure interviewer compliance with these criteria during the survey period. At the start of the interviews there were quality issues with two interviewers. These interviewers received further training but their quality control reports continued to show multiple violations of the quality criteria. The two interviewers were then removed from the project and the data that they had collected were not used.
Data analysis and modeling
The target sample size was 350 respondents to ensure that at least 100 responses were collected for each health state valued in the cTTO tasks and at least 50 responses were collected for each of the DCE choice pairs. This is similar to the sample size required in the EQ-VT protocol for EQ-5D-5L valuation studies [25] and this approach has produced good results in other EQ-5D-3L valuation studies such as those recently conducted in Russia and Tunisia [22, 23]. The same health state design was used for the cTTO elicitation in Bermuda as was used in the Russian and Tunisian studies, which includes a total of 28 health states. In the Bermuda study, each respondent valued a subset of 9 states, plus the worst health state described by the EQ-5D-3L, state 33333. For the DCE, a new health state design was generated to be used as the default design for forthcoming EQ-5D-3L valuation studies commissioned by the EuroQol Research Foundation. Priors were based on an analysis of the Russian and Tunisian EQ-5D-3L valuation studies as well as a sample of EQ-5D-3L data from a Dutch DCE survey. A Bayesian efficient design was generated, consisting of six blocks of 12 choice pairs. This mix of different priors and the Bayesian approach ensures the robustness of the design and reduces the risk of misspecification. The full design can be found in Appendix 1.
The cTTO data were analyzed using regression models correcting for heteroskedasticity. The linear regression formula takes the form of Eq. (1).
\documentclass[12pt]{minimal} \usepackage{amsmath} \usepackage{wasysym} \usepackage{amsfonts} \usepackage{amssymb} \usepackage{amsbsy} \usepackage{mathrsfs} \usepackage{upgreek} \setlength{\oddsidemargin}{-69pt} \begin{document}$$U_{j} = \beta_{0} + \beta_{1} MO2_{j} + \beta_{2} MO3_{j} + \beta_{3} SC2_{j} + \beta_{4} SC3_{j} + \beta_{5} UA2_{j} + \beta_{6} UA3_{j} + \beta_{7} PD2_{j} + \beta_{8} PD3_{j} + \beta_{9} AD2_{j} + \beta_{10} AD3_{j} + \varepsilon_{j}$$\end{document}Here, \documentclass[12pt]{minimal} \usepackage{amsmath} \usepackage{wasysym} \usepackage{amsfonts} \usepackage{amssymb} \usepackage{amsbsy} \usepackage{mathrsfs} \usepackage{upgreek} \setlength{\oddsidemargin}{-69pt} \begin{document}$${U}_{j}$$\end{document} represents the value assigned to health state \documentclass[12pt]{minimal} \usepackage{amsmath} \usepackage{wasysym} \usepackage{amsfonts} \usepackage{amssymb} \usepackage{amsbsy} \usepackage{mathrsfs} \usepackage{upgreek} \setlength{\oddsidemargin}{-69pt} \begin{document}$$j$$\end{document} . \documentclass[12pt]{minimal} \usepackage{amsmath} \usepackage{wasysym} \usepackage{amsfonts} \usepackage{amssymb} \usepackage{amsbsy} \usepackage{mathrsfs} \usepackage{upgreek} \setlength{\oddsidemargin}{-69pt} \begin{document}$${\beta }_{0}$$\end{document} is the regression intercept, while \documentclass[12pt]{minimal} \usepackage{amsmath} \usepackage{wasysym} \usepackage{amsfonts} \usepackage{amssymb} \usepackage{amsbsy} \usepackage{mathrsfs} \usepackage{upgreek} \setlength{\oddsidemargin}{-69pt} \begin{document}$${\beta }_{1}$$\end{document} to \documentclass[12pt]{minimal} \usepackage{amsmath} \usepackage{wasysym} \usepackage{amsfonts} \usepackage{amssymb} \usepackage{amsbsy} \usepackage{mathrsfs} \usepackage{upgreek} \setlength{\oddsidemargin}{-69pt} \begin{document}$${\beta }_{10}$$\end{document} are the estimated weights assigned to 10 dummy variables that represent having a certain degree of problems on some dimension of the EQ-5D-3L. For example, \documentclass[12pt]{minimal} \usepackage{amsmath} \usepackage{wasysym} \usepackage{amsfonts} \usepackage{amssymb} \usepackage{amsbsy} \usepackage{mathrsfs} \usepackage{upgreek} \setlength{\oddsidemargin}{-69pt} \begin{document}$${PD3}_{j}$$\end{document} is a dummy variable that equals 1 if the problems on pain/discomfort of state \documentclass[12pt]{minimal} \usepackage{amsmath} \usepackage{wasysym} \usepackage{amsfonts} \usepackage{amssymb} \usepackage{amsbsy} \usepackage{mathrsfs} \usepackage{upgreek} \setlength{\oddsidemargin}{-69pt} \begin{document}$$j$$\end{document} are at level 3 (extreme pain/discomfort) and 0 otherwise. Similarly, \documentclass[12pt]{minimal} \usepackage{amsmath} \usepackage{wasysym} \usepackage{amsfonts} \usepackage{amssymb} \usepackage{amsbsy} \usepackage{mathrsfs} \usepackage{upgreek} \setlength{\oddsidemargin}{-69pt} \begin{document}$${AD2}_{j}$$\end{document} is a dummy variable that equals 1 if anxiety/depression is at level 2 in state \documentclass[12pt]{minimal} \usepackage{amsmath} \usepackage{wasysym} \usepackage{amsfonts} \usepackage{amssymb} \usepackage{amsbsy} \usepackage{mathrsfs} \usepackage{upgreek} \setlength{\oddsidemargin}{-69pt} \begin{document}$$j$$\end{document} , and 0 otherwise. Together, these 10 dummy variables and their respective weights (the beta’s) can be used to assign values to all 243 possible health states.
cTTO data typically suffers from heteroskedasticity. This was corrected for by assuming that the error term \documentclass[12pt]{minimal} \usepackage{amsmath} \usepackage{wasysym} \usepackage{amsfonts} \usepackage{amssymb} \usepackage{amsbsy} \usepackage{mathrsfs} \usepackage{upgreek} \setlength{\oddsidemargin}{-69pt} \begin{document}$${\varepsilon }_{j}$$\end{document} is normally distributed with mean 0 and variance \documentclass[12pt]{minimal} \usepackage{amsmath} \usepackage{wasysym} \usepackage{amsfonts} \usepackage{amssymb} \usepackage{amsbsy} \usepackage{mathrsfs} \usepackage{upgreek} \setlength{\oddsidemargin}{-69pt} \begin{document}$${\sigma }_{j}^{2}$$\end{document} , with \documentclass[12pt]{minimal} \usepackage{amsmath} \usepackage{wasysym} \usepackage{amsfonts} \usepackage{amssymb} \usepackage{amsbsy} \usepackage{mathrsfs} \usepackage{upgreek} \setlength{\oddsidemargin}{-69pt} \begin{document}$${\sigma }_{j}$$\end{document} taking the form of Eq. (2):
\documentclass[12pt]{minimal} \usepackage{amsmath} \usepackage{wasysym} \usepackage{amsfonts} \usepackage{amssymb} \usepackage{amsbsy} \usepackage{mathrsfs} \usepackage{upgreek} \setlength{\oddsidemargin}{-69pt} \begin{document}$$\sigma_{j} = {\text{exp}}\left( {\gamma_{0} + \gamma_{1} MO2_{j} + \gamma_{2} MO3_{j} + \gamma_{3} SC2_{j} + \gamma_{4} SC3_{j} + \gamma_{5} UA2_{j} + \gamma_{6} UA3_{j} + \gamma_{7} PD2_{j} + \gamma_{8} PD3_{j} + \gamma_{9} AD2_{j} + \gamma_{10} AD3_{j} } \right)$$\end{document}To model the DCE data, a full mixed logit with random parameters for each respondent was estimated, allowing for correlation between the random parameters. The utility function in the estimated model takes the form as Eq. (3) and uses a logit link function to model the binary DCE data.
\documentclass[12pt]{minimal} \usepackage{amsmath} \usepackage{wasysym} \usepackage{amsfonts} \usepackage{amssymb} \usepackage{amsbsy} \usepackage{mathrsfs} \usepackage{upgreek} \setlength{\oddsidemargin}{-69pt} \begin{document}$$U_{ij} = \beta_{i1} MO2_{ij} + \beta_{i2} MO3_{ij} + \beta_{i3} SC2_{ij} + \beta_{i4} SC3_{ij} + \beta_{i5} UA2_{ij} + \beta_{i6} UA3_{ij} + \beta_{i7} PD2_{ij} + \beta_{i8} PD3_{ij} + \beta_{i9} AD2_{ij} + \beta_{i10} AD3_{ij}$$\end{document}Finally, a hybrid model correcting for heteroskedasticity in the cTTO data was estimated. The hybrid model allows for the estimation of a joint likelihood function for the cTTO and DCE data and produces estimates on the QALY scale anchored at 0 (dead) and 1 (full health), and takes the same functional form as shown in Eq. (1). A final model was selected based on the consistency of the parameter estimates and predictivity of the mean observed cTTO values. In case of similar performance, a hybrid model was preferred, as this allows for the utilization of all collected data.
Results
Sample characteristics
Data collection ran from May 2022 through June 2023. There were challenges in recruiting respondents for the survey- particularly among males in the younger age groups. Only 17.6% of the contacts received from the recruiting firm resulted in valuation interviews. A second recruiting firm was hired and the Bermuda Health Council also provided considerable support with recruitment drives through social media, television and radio interviews and distribution of flyers in high traffic retail establishments. All told 1180 prospective respondents (over 2% of the population) were contacted via e-mail directly. Of these 371 completed the EQ-VT survey. Two interviewers showed problems with protocol compliance, and in addition were not available for further interviews after conducting 5 interviews in total. This left 366 respondents for the final sample. A total of 809 respondents either refused to take part or terminated the interviews before the valuation tasks had been completed. Of the 366 interviews included in the final analyses, 68 (18.6%) were flagged. Firstly, 8.2% of interviews were flagged, as the WTD task was not entered in the wheelchair examples. Furthermore, 5.5% of interviews were flagged as they showed an inconsistency for state 33333 and 1.6% of interviews were flagged for not spending enough time on the wheelchair example. Lastly, 6.8% of interviews were flagged for not spending enough time on the cTTO tasks.
The demographics of the sample versus the population are compared in Table 1 based on the 2016 Population and Housing Census of Bermuda [26]. The sample was skewed towards older female groups with males in all age groups being under-represented.Table 1. Sample CharacteristicsAge GroupSamplePopulation %MaleFemaleN%N%MaleFemale18–34215.7%328.7%19.7%22.0%35–54349.3%10729.2%16.6%17.7%55 + 328.7%14038.3%11.4%12.6%Total8723.8%27976.2%47.7%52.3%SamplePopulation %N%Parish Devonshire4111%11% Hamilton4111%9% Paget257%10% Pembroke3710%16% Sandys3911%11% St. Georges5214%9% Smiths318%10% Southampton4613%10% Warwick5415%14%Ethnicity Black22160%52% White10729%31% Other3810%17%
Just over half (50.8%) of the respondents reported being in state 11111 with the most common level 2 dimensions being pain/discomfort (34.7%) and mobility (14.5%). The mean EQ VAS score was 80.4 (standard deviation = 13.7).
Data analysis and modeling
3660 cTTO responses were collected, of which 764 were worse than dead (20.9%). The mean observed values for each health state are reported in Table 2.Table 2. Observed TTO valuesStateMeanSE111120.8590.026111210.8430.026111220.7460.035112110.8820.029113130.4540.044121110.8620.031122120.6840.032123310.2160.050131330.0380.056132210.5590.037211110.8810.024211330.1670.056212110.8500.027213230.3870.050213320.1350.051221210.7270.033222220.5180.041222330.0670.062231120.5180.042233230.0960.057311310.1440.054312230.0070.056321130.1630.05632232– 0.1680.056323220.1470.05333232– 0.1030.059333110.1440.05833333– 0.3920.033
Only analytical approaches that corrected for the representativeness issue were considered. First, a weighted regression model corrected for heteroskedasticity on the cTTO data and a weighted mixed logit regression analysis on the DCE data both provided preliminary models that had internally consistent, significant (p < 0.05) coefficients. Both of these weighted regression models used inverse sampling weights to allocate a larger weight to respondents from age-gender groups that were underrepresented and smaller weights to groups that were overrepresented. These preliminary models are displayed in Table 3.Table 3. Preliminary modelsTTO HeteroskedasticMixed LogitCoefficientSECoefficientSDRescaledMO20.1010.0170.9320.1690.061MO30.4020.0296.0750.6740.396SC20.1100.0221.2690.1690.083SC30.2340.0273.3310.3890.217UA20.0930.0210.8820.1640.057UA30.1430.0262.7520.3640.179PD20.1190.0191.8000.2220.117PD30.4070.0276.4020.7370.417AD20.1250.0191.4480.1880.094AD30.2940.0264.1710.4970.272AIC5041.6775217.938BIC5171.9875678.183AIC akaike information criterion, BIC Bayesian information criterion
A hybrid model correcting for heteroskedasticity was estimated to capture the advantages of both the TTO and DCE valuation approaches. However, hybrid models do not allow for sampling weight corrections in the software packages in which they are available (Stata and R). Therefore, a bootstrap procedure was used in which random draws of subsamples of the overrepresented sample groups were drawn to produce smaller representative samples upon which the hybrid models were subsequently estimated. The largest subsample of the full sample that was representative of the Bermudan population included n = 151 respondents. This includes the full sample of underrepresented quota groups given this sample size, and a proportional random draw of each the other quota groups. A total of 3000 of such draws were done, and for each of these draws a hybrid model was estimated. A distribution of the modelled coefficients is reported in Table 4. Given that most of the EQ-5D-3L value sets currently in use are TTO based [27], a similar procedure was conducted on the TTO data in order to investigate the level of similarity between the TTO model and the hybrid model. The two bootstrapped models are presented in Table 4. The bootstrapped models showed similar fit to the mean observed cTTO responses for the 28 states included in the cTTO task (mean absolute deviation vs observed cTTO responses was 0.05 for both the hybrid model and the cTTO model). Sensitivity analyses were conducted by excluding feedback module flagged states from the sample (347 responses or 6.3%) or by preserving the 5 interviews that were removed from analysis, but neither had any effect on the estimated values. Finally, the hybrid model was selected to generate the EQ-5D-3L value set for Bermuda, as while the models showed similar fit and estimates, the hybrid model allows for the use of all collected data, rather than just the cTTO data.Table 4. Heteroskedastic TTO and Hybrid models: bootstrap analysis with 3000 random samplesHybrid ModelTTO model for ComparisonBetaSDBetaSDMO20.0610.0050.0910.012MO30.4270.0130.3940.020SC20.0970.0060.1110.012SC30.2250.0080.2290.013UA20.0650.0040.0850.011UA30.1860.0070.1660.016PD20.1260.0060.1210.009PD30.4210.0130.4070.015AD20.1100.0060.1230.015AD30.2880.0090.2980.017
The value of any state can easily be calculated by subtracting these beta values from the value of the full health state (11111) which is set at 1.000 by definition. For example, using the hybrid model in Table 4, the value associated with state 21322 would be 1.000 – 0.061– 0.000 – 0.186 – 0.126 – 0.110 = 0.517. The zero is included in this calculation for level 1 on self-care in state 21322, as there is no reduction in index value for a dimension at level 1 (no problems). The coefficients from the two models in Table 4 are very similar. A mean absolute deviation of 0.027 was observed between the value sets generated by these two models.
At level 2 (moderate problems), pain/discomfort and anxiety/depression have the biggest effect on index values. At level 3 (extreme problems), mobility and pain/discomfort have the biggest effect. Out of the 243 EQ-5D-3L states, 34 had negative values with the lowest valued state being 33333 with a value of – 0.547.
Figure 1 shows the closeness of the values from the two models across the value set, and the Bland Altman plot in Fig. 2 shows that fewer than 3% of the states have differences outside of the 95% confidence interval between the two models.Fig. 1. Similarity between the value sets generated by the Hybrid and TTO Bootstrap ModelsFig. 2Bland–Altman Plot for the value sets generated by the Hybrid and TTO Bootstrap Models
The EQ-5D-3L value set and the EQ-5D-5L Crosswalk set are presented in Appendices 2 and 3.
Conclusion
This study has produced an EQ-5D-3L value set for Bermuda. The hybrid model produced values that were very similar to those obtained from the cTTO data only.
Table 5 shows a comparison of the Bermuda EQ-5D-3L coefficients with those of the three other countries for which EQ-5D-3L valuation studies have been undertaken using EQ-VT: Russia, Pakistan and Tunisia. Also included in Table 5 are another island state: Trinidad and Tobago along with the countries listed in an inventory of TTO-based valuation studies [27]. While the coefficients may not be directly comparable because of the inclusion of interaction (and other) terms, along with differences in valuation protocols (as not all of the other countries in Table 5 utilized EQ-VT) some differences can be discerned between preferences in Bermuda and those in other countries. The Bermuda value set differs from the DCE-TTO based 3-level value set from Trinidad and Tobago: there were fewer negative values and the highest impact dimensions were pain/discomfort and mobility at levels 2 and 3 [28]. The Bermuda 3-level value set also differs from those of other nearby countries: the highest level 2 coefficients were pain and self-care in the United Kingdom and the United States, while for level 3 pain/discomfort had the biggest coefficient for both countries but self-care was second highest for the United States and mobility was second highest for the United Kingdom [27]. Such differences highlight the need for using local values in resource allocation and policy making in healthcare [9].Table 5. Bermuda EQ-5D-3L coefficients compared with those of other countriesBermudaRussiaPakistanTunisiaTrinidad and TobagoUSAUKNetherlandsSpainDenmarkJapanZimbabweConstant––– 0.030– 0.093–– 0.081– 0.071– 0.024– 0.114– 0.152– 0.100MO2– 0.061– 0.049– 0.034– 0.076– 0.045– 0.146– 0.069– 0.036– 0.106– 0.053– 0.075– 0.056MO3– 0.427– 0.448– 0.323– 0.597– 0.412– 0.558– 0.314– 0.161– 0.430– 0.411– 0.418– 0.204SC2– 0.097– 0.081– 0.060– 0.165– 0.064– 0.175– 0.104– 0.082– 0.134– 0.063– 0.054– 0.092SC3– 0.225– 0.230– 0.275– 0.340– 0.172– 0.471– 0.214– 0.152– 0.309– 0.192– 0.102– 0.231UA2– 0.065– 0.075– 0.041– 0.078– 0.043– 0.140– 0.036– 0.032– 0.071– 0.048– 0.044– 0.043UA3– 0.186– 0.236– 0.352– 0.251– 0.117– 0.374– 0.094– 0.057– 0.195– 0.144– 0.133– 0.135PD2– 0.126– 0.069– 0.018– 0.057– 0.064– 0.173– 0.123– 0.086– 0.089– 0.062– 0.080– 0.067PD3– 0.421– 0.369– 0.255– 0.276– 0.230– 0.537– 0.386– 0.329– 0.261– 0.396– 0.194– 0.302AD2– 0.110– 0.028– 0.025– 0.095– 0.011– 0.156– 0.071– 0.124– 0.062– 0.068– 0.063– 0.046AD3– 0.288– 0.172– 0.218– 0.332– 0.139– 0.450– 0.236– 0.325– 0.144– 0.367– 0.112– 0.173N3––––––– 0.269– 0.234– 0.291–––D1–––––0.14––––––I2-Square–––––– 0.011––––––I3–––––0.122––––––I3-Square–––––0.015––––––D1: The number of movements away from state 11,111 beyond the first one, I3: The number of dimensions at level 3 beyond the first one, I2: The number of dimensions at level 2 beyond the first one, N3: At least one dimension at level 3
There were some challenges with sampling; it was difficult to collect a representative sample of around 350 individuals in a country with a population of 64,000. This led to an overrepresentation of females in the older age categories. A viable analytical solution had to be found to account for the over-sampling of some groups, and the under-sampling of others. Weighted models are usually the preferred method, but these rely on sufficient data within each quota group; a criterion that was not met for some of the age-sex groups. To deal with this, some quota groups were collapsed. As weighted models are not supported for hybrid models, a bootstrap approach was used in this study which provides a robust estimate of what would be expected from a single model estimated on a representative sample. Further studies can be undertaken to test the level of similarity of the preferences in the underrepresented age-gender groups to those in Table 4. Furthermore, the high level of agreement observed between the weighted model on the TTO data and the bootstrap of the TTO data suggest that the bootstrap approach is a viable alternative to using a weighted model for the hybrid model.
The idea of conducting EQ-5D valuation studies on-line with an experienced Trinidad-based team using the EQ-VT platform opens the possibility of doing similar studies in the smaller Caribbean and Central American countries. The quality control protocol of EQ-VT in Sect. 2.5, the resulting feedback and actions discussed in the "Sample Characteristics" section, and the performance of the final model in the "Data Analysis and Modeling" section all point to this modality being useful/appropriate for the subregion. This can greatly reduce the cost of conducting such studies locally. The alternative to this would be to train and supervise teams of interviewers locally for the valuation study in each country. One learning that came out of the Bermuda valuation study was associated with the possible challenge of recruiting respondents for an on-line survey. Especially when working with small populations, careful consideration should be given to the possibility of high refusal rates which may in part be associated with outreach from overseas. Strong local promotion and recruitment efforts before initializing outreach from the valuation team should help in such circumstances.
The values created in this study can be used in the economic analysis of health interventions and to assess the burden of disease of different patient groups and demographic groups in Bermuda. As Bermuda moves towards developing its own HTA arrangements, applying societal values to self-reported health states can provide unique insights into understanding the burden of disease and can capture aspects of health inequality that can be missed by other measures. Self-reported health-based measures bring the patients’ or respondents’ experience with their health states directly into the analysis. Such studies continue to bring new insights into burden of disease and health inequality in the small islands of the Caribbean and other countries/regions [29, 30].
The reference list from the paper itself. Each links out to its DOI / PubMed record.
- 1Bailey, H., Espinoza, M., Parkin, D., Smith, S., Theodore, K.: Improving population health through priority setting in Trinidad and Tobago. Carib. Med. J. 84
- 2National Accounts Data [Internet]. The World Bank; (2022). https://data.worldbank.org/indicator/NY.GDP.PCAP.CD?locations=BM
- 3Global Health Expenditure Database [Internet]. World Health Organization; (2022). https://apps.who.int/nha/database/Home/Index/en
- 4World Population Prospects [Internet]. United Nations; (2022). https://population.un.org/wpp/
- 5Country Profile: Bermuda [Internet]. Pan American Health Organization; [cited 2023 Jul 18]. https://hia.paho.org/en/countries-22/bermuda-profile
- 6STEPS to a Well Bermuda 2014. PAHO-WHO Non-Communicable Disease risk factor survey. [Internet]. Government of Bermuda, Ministry of Health, Seniors and Environment; (2016). https://cdn.who.int/media/docs/default-source/ncds/ncd-surveillance/data-reporting/bermuda/steps/bermuda_2014_steps_report.pdf?sfvrsn=6aa 0eab 5_5&download=true
- 7Bermuda Health Strategy 2022–2027 [Internet]. Ministry of Health, Bermuda; (2022). https://www.gov.bm/sites/default/files/Mo H%20Bermuda%20Health%20Strategy%202022-2027%20v 10.pdf
- 8Guide to the methods of technology appraisal 2013 [Internet]. National Institute for Health and Care Excellence; (2013). https://www.nice.org.uk/process/pmg 9/chapter/foreword 27905712 · pubmed ↗