Development of the Pulmonary Embolism Progression (PEP) score for predicting short-term clinical deterioration in intermediate-risk pulmonary embolism: a single-center retrospective study
Jane Ehret, Dorothy Wakefield, Jessica Badlam, Maryellen Antkowiak, Brett Erdreich

TL;DR
This study developed the PEP score to predict which intermediate-risk pulmonary embolism patients will worsen within 72 hours, using clinical, lab, and imaging data.
Contribution
The PEP score is a novel risk stratification tool for predicting short-term deterioration in intermediate-risk pulmonary embolism patients.
Findings
The PEP score includes five variables: oxygen use, lactate, hs-cTnT, TAPSE, and clot distribution.
A PEP score of 4 points achieved 93% sensitivity and 65% specificity for predicting clinical deterioration.
The score showed strong predictive accuracy with AUROC of 0.8671 in derivation and 0.9264 in validation cohorts.
Abstract
Accurate risk stratification in acute intermediate-risk pulmonary embolism (PE) is essential. Current prediction scores lack the ability to forecast impending clinical decline. The Pulmonary Embolism Progression (PEP) score aims to predict short-term clinical deterioration (respiratory failure or hemodynamic instability within 72 h) in patients with intermediate-risk PE. This single-center retrospective cohort study analyzed patients with intermediate PE. The outcome of interest was respiratory failure or hemodynamic instability within 72 h. A multivariate logistic regression identified five predictive variables for the final PEP score: use of > 4 L/min of supplemental oxygen above baseline, lactate > 2.0 mmol/L, high-sensitivity cardiac troponin T (hs-cTnT) > 40 ng/L, tricuspid annular plane systolic excursion (TAPSE) < 13 mm, and the combination of central and subsegmental clot. The…
Genes, proteins, chemicals, diseases, species, mutations and cell lines named across the full text — each resolved to its canonical identifier and authoritative record.
Click any figure to enlarge with its caption.
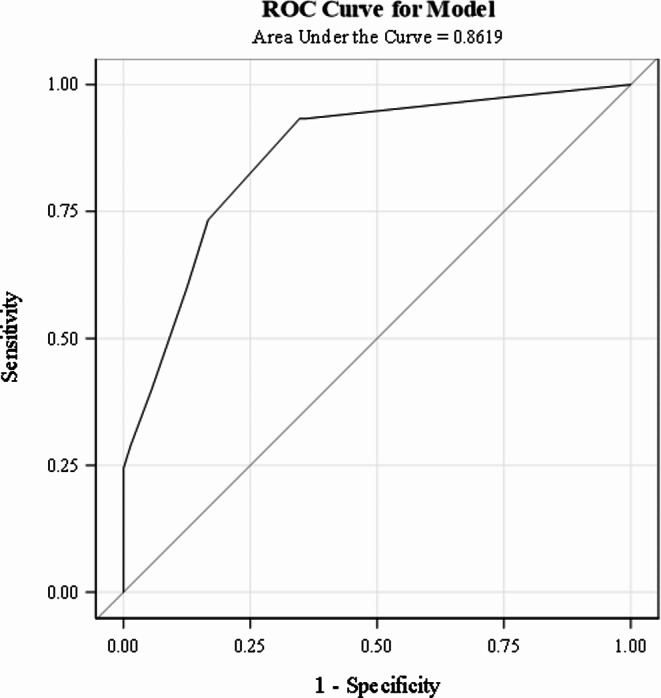 Figure 1
 Figure 2
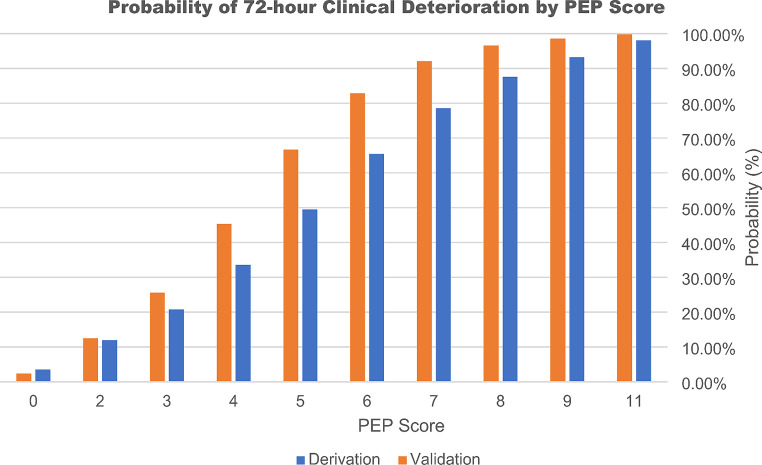 Figure 3
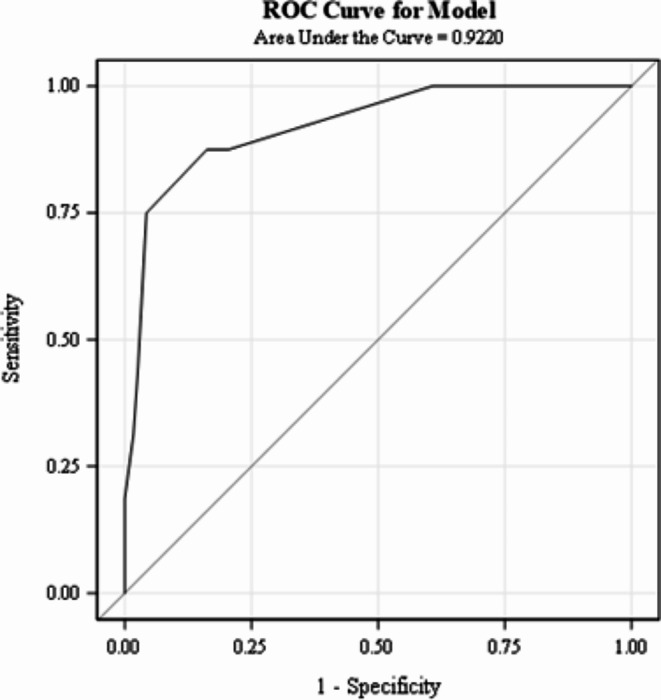 Figure 4
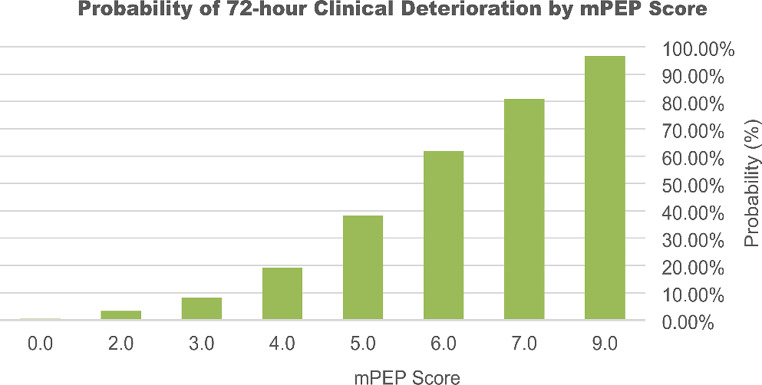 Figure 5
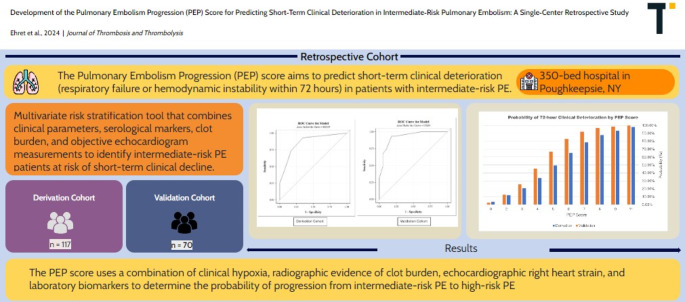 Figure 6
Peer Reviews
No public reviews on file for this paper yet. If you reviewed it on a platform where reviews are public (OpenReview, ICLR, NeurIPS, ICML), you can paste yours below so the community can read it here.
Videos
No videos yet. Explain this paper in a talk, walkthrough, or lecture? Add one.
Taxonomy
TopicsVenous Thromboembolism Diagnosis and Management · Acute Ischemic Stroke Management · Central Venous Catheters and Hemodialysis
Pulmonary embolism (PE) remains a leading cause of mortality worldwide [1]. Early identification of patients with imminent clinical deterioration is crucial to provide timely escalation of care to improve patient outcomes [2].
The 2019 European Society of Cardiology (ESC) guidelines classify patients with acute PE into low, intermediate-low, intermediate-high, and high-risk categories based on hemodynamic stability, evidence of right ventricular dysfunction (RVD), and cardiac biomarkers [3]. This classification system, on the bookends, aids management but lacks predictors of impending clinical deterioration, particularly in the intermediate-risk group. The treatment guidelines for intermediate-risk PE are currently limited, often leaving clinicians to rely on clinical judgment to guide medical management. Furthermore, the diverse spectrum of clinical presentations in this group complicates risk stratification and treatment selection [4, 5].
As of this publication, clinical prediction scores lack the ability to forecast short-term clinical decline in intermediate-risk PE. Scores like the Pulmonary Embolism Severity Index (PESI), simplified PESI (sPESI), and BOVA lack utility for acute management decisions [6–10]. These predictive scores are not validated to identify patients on the brink of cardiac or respiratory collapse. To guide clinical decision making, experts agree that a comprehensive and effective risk assessment model that reflects the complex pathophysiology of acute PE is necessary [10, 11]. The aim of this study focuses on developing and validating a novel prognostic model that predicts short-term clinical deterioration in acute PE. In doing so, we introduce the Pulmonary Embolism Progression (PEP) Score, a quantitative risk stratification tool that combines clinical parameters, serological markers, clot burden, and objective echocardiogram measurements to identify intermediate-risk PE patients at risk of clinical deterioration within 72 h of presentation.
Study design and methods
A retrospective study took place at a 350-bed community teaching hospital in Poughkeepsie, NY. Patients diagnosed with intermediate PEs between February 2020 and February 2024 underwent a chart review of clinical, laboratory, computed tomography pulmonary angiography (CTPA), and transthoracic echocardiography (TTE) findings from the time of PE diagnosis and for 72 h thereafter. The outcome of interest was short-term clinical deterioration, defined as either respiratory failure or hemodynamic instability, within 72 h of PE diagnosis.
This study was approved by the Institutional Review Board (IRB), with a waiver of informed consent. We adhered to the Transparent Reporting of a Multivariable Prediction Model for Individual Prognosis or Diagnosis (TRIPOD) reporting guideline for reporting multivariate prediction model development and validation [12].
Patient selection
Subjects were identified through the inpatient discharge database (DAD) using the ICD-10 code for PE. The electronic medical record (EMR) was reviewed to confirm diagnosis of PE by CTPA. All confirmed PE cases were screened for markers of RVD within the first 24 h of admission. Thresholds for RVD included: high-sensitivity cardiac troponin (hs-cTnT) > 30 ng/L, N-terminal pro-brain natriuretic peptide (NT-proBNP) > 300 pg/mL, CTPA findings (RV: LV ratio > 1.0, septal deviation, or retrograde contrast reflux into the vena cava), or TTE findings (RV dilation (end-diastolic diameter > 30 mm), right ventricular systolic pressure (RVSP) > 40 mm Hg, septal deviation, positive McConnell’s sign, or positive “D” sign.
Eligible subjects were ≥ 18 years old with confirmed acute PE and at least one marker of RVD. Low-risk PE patients and pregnant patients were excluded. Subjects were divided into two cohorts. The derivation cohort consisted of all available data at the time of retrieval on December 18, 2023. This cohort was used to develop, evaluate, and internally validate the predictive model and clinical scoring system. The validation cohort consisted of subjects whose data was uploaded after December 19, 2023. This cohort was used to evaluate the model’s performance on an independent sample. The data for both the derivation and validation cohorts was obtained from the same hospital. Subjects missing any predictor variables were excluded from the final derivation and validation models. Subjects were used in a post-hoc extrapolation cohort if missing only one predictor variable.
Outcome variable
The outcome of interest was whether the subject had clinical deterioration, defined as worsening respiratory failure or hemodynamic instability, within 72 h of PE diagnosis. Respiratory failure was defined as the need for high flow nasal cannula (HFNC), non-invasive positive pressure ventilation (NIPPV), or mechanical ventilation (MV) to maintain oxygen saturation (SpO2) above 90%. Hemodynamic instability was defined as at least one of the following criteria: systolic blood pressure (SBP) less than 90 mm Hg or a drop of greater than 40 mm Hg from baseline for greater than 15 min, the need for catecholamine administration to maintain SBP above 90 mm Hg, or cardiac arrest.
Data collection
Subjects were collected from a central list, de-identified, and uploaded into a secure Redcap database. Data entry occurred periodically between October 2022 and February 2024. Data was collected from the time of PE diagnosis and for 72 h afterwards. The data collected at the time of PE diagnosis was used for the current study and included the following:
Patient characteristics: Baseline demographics (age, sex, race, BMI); chronic medical conditions (including preexisting heart failure, chronic lung disease, active or past malignancy, and prior venous thromboembolism); additional risk factors for PE (recent COVID-19 or other systemic infection, travel, surgery, or hospitalization).
Clinical data: Symptomatology (syncope, chest pain, dyspnea, leg pain or swelling, altered mental status); highest and lowest heart rate (HR), SBP, and supplemental oxygen (O2) requirements (above baseline) prior to admission. Additional clinical data was collected for 72 h from the time of PE diagnosis, including trends in vital signs, supplemental oxygen requirements, vasopressor requirements (if any), and medical documentation pertaining to escalation of care or clinical deterioration.
Laboratory and imaging results: Venous plasma samples were collected on arrival by laboratory personnel and included hs-cTnT, NT-proBNP, and lactic acid. Radiologists independently reviewed CTPA images and reported the most proximal and distal anatomical thrombus distribution. Radiologists reported the presence or absence of RVD, and the RV: LV ratio as either less than or equal to 1.0, or greater than 1.0. A TTE was performed within 24 h by a certified ultrasound technician and read by in-house cardiologists per the Intersocietal Accreditation Commission (IAC) Standards and Guidelines for Echocardiography Accreditation [13]. The parameters collected included the presence or absence of: RV dilation (end-diastolic diameter greater than or equal to 30 mm from the parasternal view), interventricular septum deviation, clot in transit, McConnell’s sign, and valvular dysfunction. Numerical values were collected for left ventricular ejection fraction (LVEF [%]), RVSP [mm Hg], and TAPSE [mm]. Bilateral lower limb complete duplex ultrasound (CDUS) testing was performed within 24 h by certified ultrasound technicians using two-dimensional imaging, graded compression, and Doppler analysis. Images were reviewed by in-house radiologists and reported as: proximal deep vein thrombosis (DVT), distal DVT, both, or absent.
Statistical methods
All baseline characteristics and potential predictor variables were compared by study group (Adverse outcome, Y/N). Descriptive data was reported as absolute numbers, percentages, or means +/- standard deviation (means +/- SD) or medians (interquartile range). Subject baseline characteristics and clinical factors, laboratory results, CT, and echocardiogram results were compared by study group [Clinical Deterioration (Yes/No)]. Some continuous variables (TAPSE, Lactate, supplemental O2, hs-cTnT) were converted to dichotomous variables using predefined cut-offs based on clinical significance and prior research studies. Normally distributed continuous variables were compared using the student’s t test, whereas non-normally distributed variables were compared using the Wilcoxon rank-sum tests. Categorical variables were compared using chi-square analysis or Fisher’s exact test. Variables with a significant relationship to the outcome in the univariate analysis were considered as covariates in the multivariable model. A stepwise logistic regression was performed to screen for potential variables for inclusion in the final model. In addition to variables selected by the stepwise procedure, variables deemed clinically relevant by the investigators were included in the selection procedure. Subjects with missing data for significant predictor variables were excluded from analyses by the regression procedure. Five variables associated with an increased risk of short-term clinical deterioration were incorporated into the final regression model. The goodness-of-fit was assessed using Akaike Information Criterion (AIC) and the Hosmer-Lemeshow test. A clinical risk score (PEP Score), ranging from 0 to 11 points, was created based on the results of the final logistic regression model. For each of the five included variables, a point value was assigned based on the rounded square root of the odds ratio. A receiver’s operator curve (ROC) was created to assess the accuracy of the model. For each score cutoff, the probability, sensitivity, specificity, positive predictive value (PPV), and negative predictive value (NPV) were calculated. Youden’s index was calculated to identify the point with the highest sensitivity and specificity. Accuracy was measured using the brier score, measuring the difference between predicted vs. observed outcomes. Using a second dataset, PEP scores were calculated for each subject, and the process was repeated– an ROC curve was created, and the sensitivity, specificity, PPV, NPV were calculated for validation. A post-hoc analysis was performed using the subjects excluded from the derivation and validation cohorts due to missing variables. This modified PEP score (mPEP) included all subjects missing one of the five predictor variables. The missing variable was assumed to be normal if not preset, making the modified PEP score with a reduced potential range of 0 to 9 points. Statistical analysis was performed using the SAS statistical software version 9.4 (SAS Institute, Cary, NC, USA).
Results
A sample of 244 subjects was used to compare baseline characteristics and clinical factors, laboratory results, CTPA, and TTE results by study group [Clinical deterioration (Y/N)] and identify potential predictors of an adverse outcome.
Altered mental status, complaints of dyspnea, HR > 110, concurrent DVT, RV: LV ratio > 1.0 on CTPA, clot in transit, and McConnell’s sign were independently predictive of the outcome, but lost significance in the multivariate regression analysis. Notable variables that were not significant predictors of 72-hour clinical deterioration included older age, male sex, syncope, chronic lung disease, pre-existing heart failure, and history of malignancy. The results of the univariate analysis are available in the online supplementary material (e-Table 1).
The statistically significant variables were entered into a stepwise logistic regression. The variable selection process resulted in the five predictors of clinical deterioration within 72 h: the use of > 4 L/min of supplemental oxygen (above baseline) to maintain SpO2 > 90% (p < 0.01), lactic acid > 2.0 mmol/L (p < 0.01), hs-cTnT > 40 ng/L (p < 0.01), TAPSE ≤ 13 mm (p < 0.01) and the combination of central and subsegmental clot burden (p < 0.01).
The derivation cohort (N = 117) included subjects with complete data for all five of final variables, of which 45 (38.46%) had clinical deterioration within 72 h. Table 1 displays the baseline patient characteristics of the derivation cohort subjects.
Table 1. Baseline characteristics of the derivation cohortPatient CharacteristicClinical DeteriorationP-valueNo (N = 72)Yes (N = 45)Age, years, mean (SD)71.0 (14.4)63.3 (17.5)0.01Sex, female, n (%)42 (58.3)21 (46.7)0.22Race, n (%)0.20Black13 (18.1)6 (13.3)White52 (72.2)31 (68.9)Other5 (6.9)8 (17.8)Unknown2 (2.8)0 (0.0)BMI, mean (SD)30.9 (8.4)33.1 (10.4)0.22PESI score, mean (SD)116.1 (41.2)134.8 (46.0)0.02Pre-existing ConditionsChronic lung disease, n (%)16 (22.2)11 (24.4)0.78Pre-existing heart failure, n (%)14 (19.4)8 (17.8)0.82Prior VTE, n (%)14 (19.4)6 (13.3)0.39Active or past malignancy, n (%)15 (22.4)11 (25)0.75Risk Factors in final modelSupplemental O2 > 4 L/min above baseline, n (%)7 (9.7)22 (48.9)< 0.01TAPSE ≤ 13 mm, n (%)13 (18.1)22 (48.9)< 0.01Central and subsegmental artery thrombus, n (%)12 (16.7)18 (40.0)< 0.01Hs-cTnT > 40 ng/L, n (%)34 (47.2)34 (75.6)< 0.01Lactate > 2 mmol/L, n (%)25 (34.7)34 (75.6)< 0.01BMI = body mass index; SD = standard deviation; Hs-cTnT = high-sensitivity cardiac troponin T; PESI score = pulmonary embolism severity index score; TAPSE = tricuspid annular plane systolic excursion; VTE = venous thromboembolism
The results of the final logistic regression are shown in Table 2. The Hosmer and Lemeshow (HL) (χ² = 5.0273, df = 7, p = 0.6566) statistic indicated good fit. The area under the receiver’s operating curve (AUROC) was 0.8671 (SE = 0.0339, 95% CI: 0.8006, 0.9336), indicating good discriminatory ability to predict 72-hour clinical deterioration.
Table 2. Logistic regression results and PEP score pointsFinal predictor variableBeta (SE)OR (95% CI)P-valuePointsSupplemental O2 > 4 L/min above baseline2.15 (0.58)8.55 (2.74–26.67)< 0.0013Lactate > 2 mmol/L1.19 (0.52)3.30 (1.18–9.22)0.022Hs-cTnT > 40 ng/L1.22 (0.56)3.37 (1.14–10.01)0.032Central + subsegmental thrombus1.42 (0.59)4.15 (1.32–13.09)0.012TAPSE ≤ 13 mm1.35 (0.56)3.86 (1.29–11.57)0.022Beta = beta coefficient; CI = confidence interval; hs-cTnT = high-sensitivity cardiac troponin T; OR = odds ratio; SE = standard deviation; TAPSE = tricuspid annular plane systolic excursion
PEP score
To convert the 5-variable logistic regression model into a clinical score, the rounded square root of the odds ratio (OR) was used to assign a point value to each risk variable and derive the PEP score (Table 2). The odds of clinical deterioration increase by a factor of approximately 1.933 for every one-unit increase in the score. The HL statistic (χ² = 5.4688, df = 5, p = 0.3614) supported adequate model fit. The AUROC of PEP Score (Fig. 1) was 0.8619 (SE = 0.0343, 95% CI: 0.7946, 0.9292), showing good discrimination in the points model.
Fig. 1AUROC curve for the derivation cohort
Validation cohort
The predictive model was validated using a separate cohort. Ninety-two subjects were initially available, but only seventy had full datasets. The outcome was met in 31 (44.29%) of subjects. Compared to the derivation cohort, there were no differences in baseline characteristics. Analysis of the type of clinical decline demonstrated that the validation cohort had fewer subjects with a combination of both respiratory failure and hemodynamic instability compared to the derivation cohort (Table 3).
Table 3. Comparison of patient characteristics between derivation and validation cohortsPatient CharacteristicDerivation Cohort (n = 117)Validation Cohort (n = 70)P-valueClinical Deterioration, n (%)45 (38.5)31 (44.3)0.43Clinical Deterioration Type, n (%)0.03Respiratory Failure10 (22.2)5 (16.1)Hemodynamic Instability17 (37.8)21 (67.7)Both18 (40)5 (16.1)Age, years, mean (SD)68 (16)70.2 (15)0.37Sex, female, n (%)63 (53.9)37 (52.9)0.90Race, n (%)0.27Black, n (%)19 (16.2)7 (10.0)White, n (%)83 (70.9)58 (82.9)Other, n (%)13 (11.1)5 (7.1)Unknown, n (%)2 (1.7)0BMI, mean (SD)31.8 (9.3)29.6 (8.8)0.11PESI score, mean (SD)123.3 (43.9)127.6 (52)0.54Pre-existing ConditionsChronic lung disease, n (%)27 (23.1)32 (45.7)< 0.01Pre-existing heart failure, n (%)22 (18.8)11 (15.7)0.59Prior VTE, n (%)20 (17.1)13 (18.6)0.80Active or past malignancy, n (%)26 (23.4)20 (32.3)0.21Risk Factors in final modelSupplemental O2 > 4 L/min above baseline, n (%)29 (24.8)20 (28.6)0.57TAPSE ≤ 13 mm, n (%)35 (29.9)19 (27.1)0.69Central and subsegmental artery thrombus, n (%)30 (25.6)22 (31.4)0.39Hs-cTnT > 40 ng/L, n (%)68 (58.1)45 (64.3)0.40Lactate > 2 mmol/L, n (%)59 (50.4)21 (30)< 0.01BMI = body mass index; SD = standard deviation; Hs-cTnT = high-sensitivity cardiac troponin T; PESI score = pulmonary embolism severity index score; TAPSE = tricuspid annular plane systolic excursion; VTE = venous thromboembolism
PEP scores were calculated using the point system from the derivation cohort (Table 2), and a logistic regression model examined how well the PEP score predicted clinical decline in the validation cohort. The HL statistic (χ² = 5.4693, df = 4, p = 0.2424) indicated satisfactory model fit. The AUROC of 0.9264 (SE = 0.0298, 95% CI: 0.8680, 0.9847), indicates good discriminatory ability in a separate cohort of patients (Fig. 2).
Fig. 2AUROC curve for the validation cohort
Brier scores, ranging from 0 to 1 with lower scores indicating correlation between the predicted and observed outcomes, were computed to further assess calibration and accuracy of the model. Low Brier scores in both the derivation cohort (0.14361) and validation cohort (0.104762) indicated predictive accuracy in each step.
In both the derivation and validation cohorts, the performance of the PEP score was evaluated across the range of score cutoffs (0–11), yielding different values for probability, sensitivity, specificity, PPV, and NPV (Table 4). Youden’s index indicated that a score of 4 would yield the highest combination of sensitivity (93%) and specificity (65%), with a PPV of 63% and NPV of 94%. As the PEP score increases, both the probability of an adverse outcome and the PPV increase (Table 4). With every one-point increase in the PEP score, the chance of an adverse outcome increases by a factor of approximately 1.933 (Fig. 3). Therefore, although a score of 4 points conveys significant risk of deterioration, a cutoff threshold was not defined to allow for greater clinical applicability.
Table 4. Probability, sensitivity, specificity, PPV, and NPV at various PEP score cutoffs. All values are in (%)Derivation Cohort PEP ScoreValidation Cohort PEP ScoreCutoffProbabilitySensitivitySpecificityPPVNPVProbabilitySensitivitySpecificityPPVNPV1198.088.89100.00100.0063.7299.759.68100.00100.0058.21993.1924.44100.00100.0067.9298.5522.58100.00100.0061.90887.6328.8998.6192.8668.9396.5732.26100.00100.0065.00778.5540.0094.4481.8271.5892.1048.3994.8788.2469.81665.4560.0087.5075.0077.7882.8667.7494.8791.3078.72549.4973.3383.3373.3383.3366.7274.1989.7485.1981.40433.6393.3365.2862.6994.0045.3993.5582.0580.5694.12320.7793.3363.8961.7693.8825.6293.5576.9276.3293.75211.9497.7822.2244.0094.1212.50100.0038.4656.36100.0003.50100.000.0038.46.2.40100.000.0044.29.NPV = negative predictive value; PPV = positive predictive value
Table 5. Probability, sensitivity, specificity, PPV, and NPV at various modified PEP score cutoffs. All values are in (%)Modified PEP ScoreCutoffProbabilitySensitivitySpecificityPPVNPV996.6818.75100.00100.0090.00780.9231.2598.2971.4391.27661.8343.7597.4470.0092.68538.2275.0095.7370.5996.55419.1187.5083.7642.4298.0038.2787.5079.4936.8497.8923.33100.0039.3218.39100.0000.50100.00.12.03.NPV = negative predictive value; PPV = positive predictive value
Fig. 3. Probability of 72-hour clinical deterioration by PEP score
Modified PEP score
A post-hoc analysis was performed using subjects excluded from the derivation and validation cohorts for missing one predictor variable (N = 133). Clinical deterioration occurred in 16 (12.03%) of these subjects. The missing variables were lactate (N = 121), TAPSE (N = 10), or hs-cTnT (N = 2), all of which are weighted equally in the PEP score. A modified PEP (mPEP) score, using the same point system with a reduced potential range of 0–9 points, was evaluated in this group (Table 5). Missing variables assumed normal.
The ROC analysis yielded comparable results to the validation cohort, with an AUROC of 0.9220 (SE = 0.0350, 95% CI: 0.835, 0.9906) (Fig. 4). The HL test ((χ² = 1.5109, df = 2, p = 0.4698) demonstrates adequate model fit. The low Brier score (0.060425) indicated accuracy in predicting the adverse outcome despite missing one of the variables. Like with the PEP Score, the probability of the adverse outcome increased with higher mPEP scores (Fig. 5).
Fig. 4AUROC curve for the mPEP score in the cohort of subjects missing one variable
Fig. 5. Probability of 72-hour clinical deterioration by mPEP score
Discussion
The present study derives and externally validates a clinical score for predicting short-term deterioration in patients with intermediate-risk PE at a single institution. The PEP score identifies patients at risk of respiratory or hemodynamic collapse within the critical 72-hour of presentation, providing a more immediate and actionable clinical assessment tool for treating clinicians.
The PEP score uses a combination of clinical hypoxia, radiographic evidence of clot burden, echocardiographic RVD, and laboratory biomarkers to determine the probability of progression from intermediate-risk PE to high-risk PE. Interestingly, the clinical degree of hypoxia had the highest weight in our predictive model. Although, in other studies, elevated HR was a predictor of worsening clinical outcomes, our multivariate regression selectively chose hypoxemia as a more clinically significant vital sign [14].
Saddle, main pulmonary artery, lobar artery, and subsegmental artery clots were independently significant in the univariate analysis; however, only subsegmental clot was initially retained through the stepwise regression. We further refined this variable to include central clots as a marker for overall clot burden due to inconsistency in radiologist reporting thrombi as either the most proximal or most distal involved vessels. As previous studies have shown, the percentage of occlusive disease has a significant effect on pulmonary artery pressures and total pulmonary resistance [15, 16]. Further research and modeling on the clinical significance of distal occlusive disease is warranted. Our study suggests that the degree of vascular occlusive disease may be a significant marker for clinical deterioration rather than central clot burden alone [17–19]. Although quantitative markers of clot burden are useful in an academic sense, they are time-consuming without artificial intelligence and have yet to show their usefulness in clinical practice [20].
Decreased RV function, as measured by TAPSE, is independently predictive of short-term mortality in acute PE [21, 22]. Although a value less than 16 mm is considered abnormal, our model shows that 13 mm or less is the best echocardiographic measure for predicting progression to hemodynamic collapse [23]. TAPSE can be obtained quickly at the bedside by a skilled ultrasonographer providing significant amount of diagnostic value. A new marker of RVD uses TAPSE/RVSP to determine the degree of RV-pulmonary artery uncoupling [24, 25]. When comparing our model using TAPSE/RVSP < 0.4 in place of TAPSE < 13 mm, the results were similar. This supports our decision to lower the prognostic threshold of TAPSE from the value of 16 mm that has been used previously.
Lactate serves as a marker of tissue hypoperfusion, even in normotensive PE patients. Elevated lactate is a strong predictor of adverse outcomes in acute PE, especially as it relates to the concept of subclinical shock [26–28]. However, lactate levels were missing most often from initial prognostication. We strongly recommend obtaining lactate levels upon immediate diagnosis of PE with any evidence of right heart strain.
Troponin, but not NT-proBNP, was a predictor of disease progression in our study. Although several studies have shown that higher levels of NT-proBNP at the time of PE diagnosis corelate with increased mortality, its prognostic utility may be limited by patient characteristics such as age, obesity, chronic cardiac conditions, and renal failure [29–31].
Nearly half of the subjects that were collected were excluded from the derivation and validation cohorts due to missing data points. To have the most clinical relevance, we created a modified PEP score that included all subjects that were missing one of the five variables. The modified PEP score was able to predict adverse outcomes despite missing key data points. We hope that moving forward both the PEP score and modified PEP score will have actionable relevance when applied to intermediate-risk patients.
It is worth noting that subjects in this study met our outcome variables whether they had the usual care of systemic anticoagulation or more advanced interventions such as catheter directed interventions. This tool is not intended to recommend a specific treatment modality, and further studies are warranted to determine the appropriate intervention for the intermediate-risk group with high probability of clinical deterioration.
Several limitations of our study should be noted. The retrospective design inherently introduces potential information biases due reliance on existing medical records. Clot location, determined by several radiologists not involved in the study, had inconsistent reporting of either the most proximal and/or distal thrombus. This problem is not inherent to our institution and further work is necessary to standardize CTA reporting. This problem may also be mitigated by adopting artificial intelligence capable of reliably reporting the degree of clot burden and location. Lastly, the PEP score was derived and externally validated at a single institution. Further validation in larger, multicenter cohorts is needed to ensure broader applicability.
Interpretation
The PEP score helps to determine the risk of clinical deterioration of intermediate-risk PE patients. This tool will provide much needed information to treating clinicians and further research is necessary to determine its benefit on a global scale.
Electronic supplementary material
Below is the link to the electronic supplementary material.
Supplementary Material 1
The reference list from the paper itself. Each links out to its DOI / PubMed record.
- 1Intersocietal Accreditation Commission. IAC Standards and Guidelines for Echocardiography Accreditation. Intersocietal Accreditation Commission. Published 2024. Accessed June 15 (2024) https://www.intersocietal.org/echo/standards/IAC_Standards_and_Guidelines_for_Echocardiography_Accreditation.pdf
- 2He Q, Lin Y, Zhu Y et al (2023) Clinical Usefulness of Right Ventricle-Pulmonary Artery Coupling in Cardiovascular Disease. J Clin Med.;12(7):2526. Published 2023 Mar 27. 10.3390/jcm 1207252610.3390/jcm 12072526 PMC 1009553737048609 · doi ↗ · pubmed ↗