Male mouse skeletal muscle lacking HuR shows enhanced glucose disposal at a young age
Robert C. Noland, Sujoy Ghosh, Carlos J. Crisanto, Antonio Aleman, McKenna K. Chaney, Maitri K. Chauhan, Layla G. Loftis, Ally C. Goad, Christin F. Rickman, Samuel E. Velasquez, Jaycob D. Warfel

TL;DR
Male mice lacking a specific protein in their muscle use more glucose and less fat for energy, suggesting a shift toward glycolysis.
Contribution
The study reveals sex-specific metabolic changes in mice lacking HuR, a protein involved in fat oxidation.
Findings
Male HuR knockout mice show increased glucose uptake and glycogen content in skeletal muscle.
Male HuR knockout mice have decreased fat oxidation and increased lactate levels.
Transcriptomic differences between male and female mice are reduced by half when HuR is absent.
Abstract
Metabolic flexibility is the ability of a system to switch between metabolic substrates. Human and murine skeletal muscle tissues and cells with decreased activity of the regulatory RNA-binding protein, human antigen R (HuR), have decreased capacity for fat oxidation, and thus decreased metabolic flexibility. In this study, we aimed to assess the preference for carbohydrates in mice lacking HuR in skeletal muscle. Experiments were performed on weight-matched control and HuR knockout mice of both sexes. Palmitate and pyruvate oxidation were performed in mouse muscle following the release of 14CO2. In vivo glucose and lipid uptake were assayed in mouse tissue following nonmetabolizable 3H-2-deoxyglucose or 14C-bromopalmitate injection. Transcriptomic analyses were performed in the skeletal muscle of all mice, followed by qPCR validation of select genes. Serum lactate and glucose levels…
Genes, proteins, chemicals, diseases, species, mutations and cell lines named across the full text — each resolved to its canonical identifier and authoritative record.
Click any figure to enlarge with its caption.
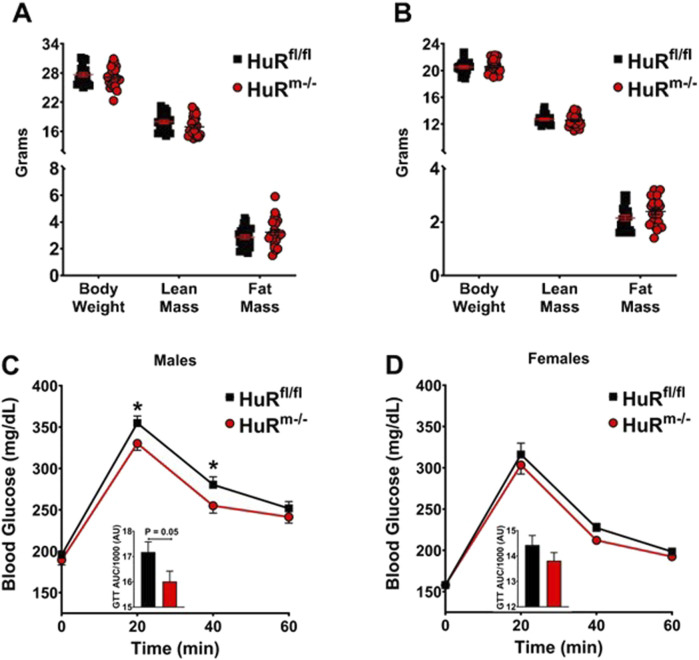 FIGURE 1
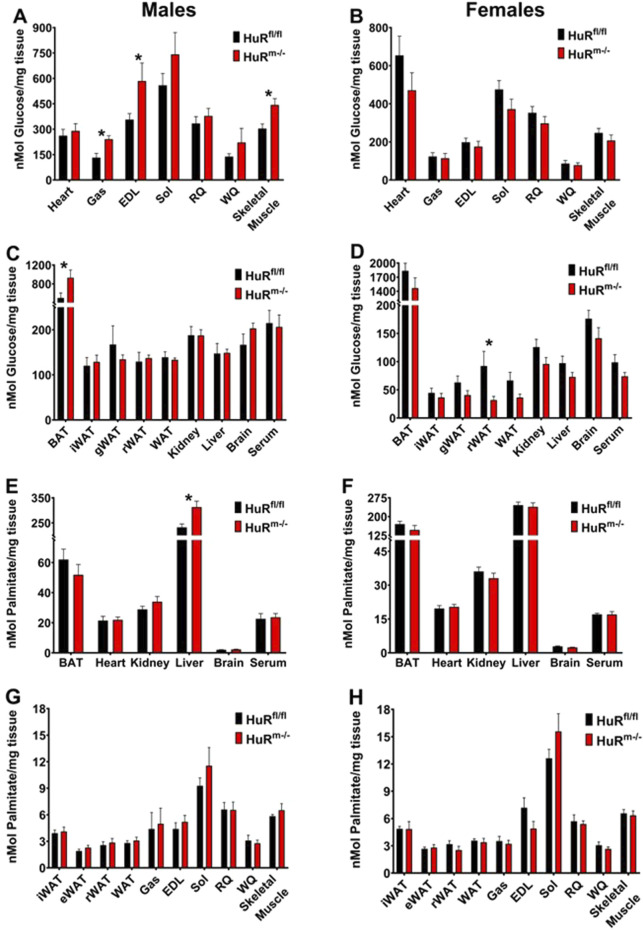 FIGURE 2
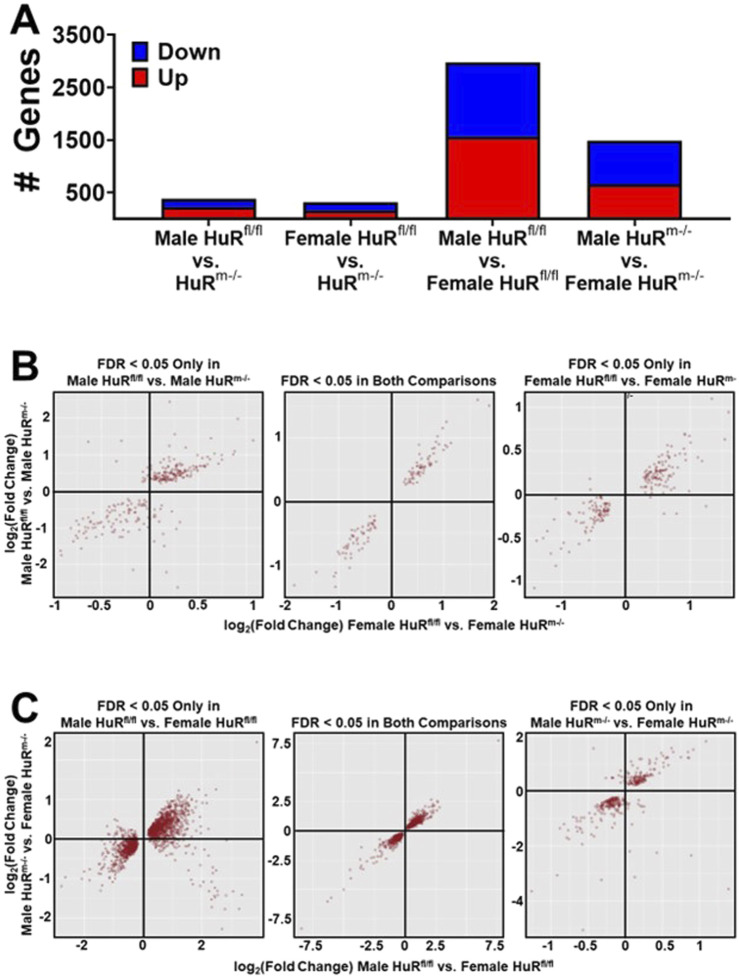 FIGURE 3
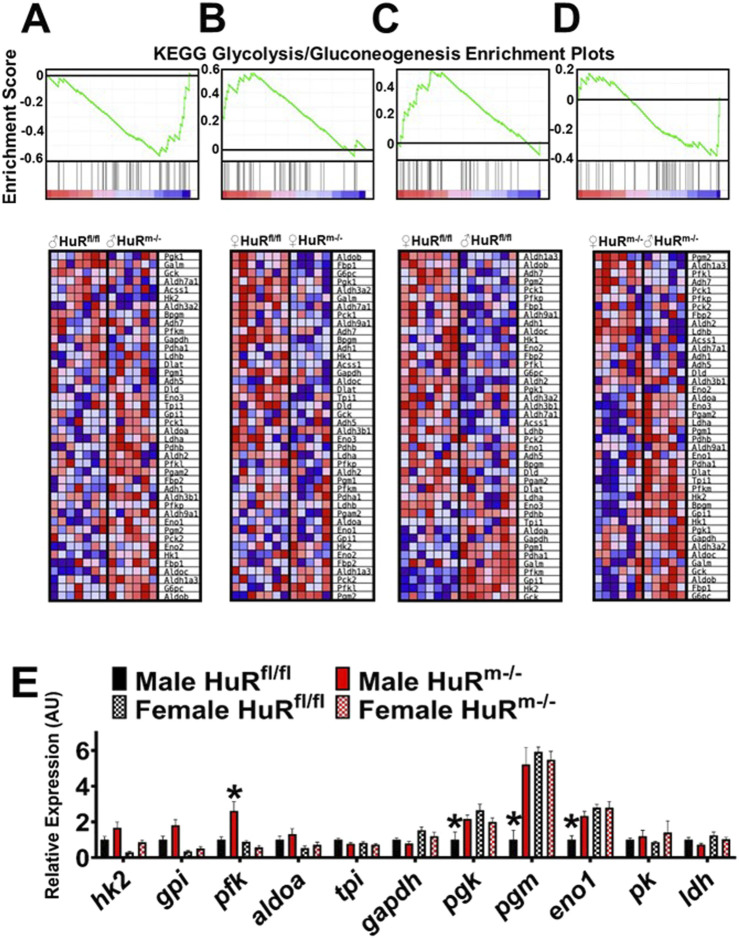 FIGURE 4
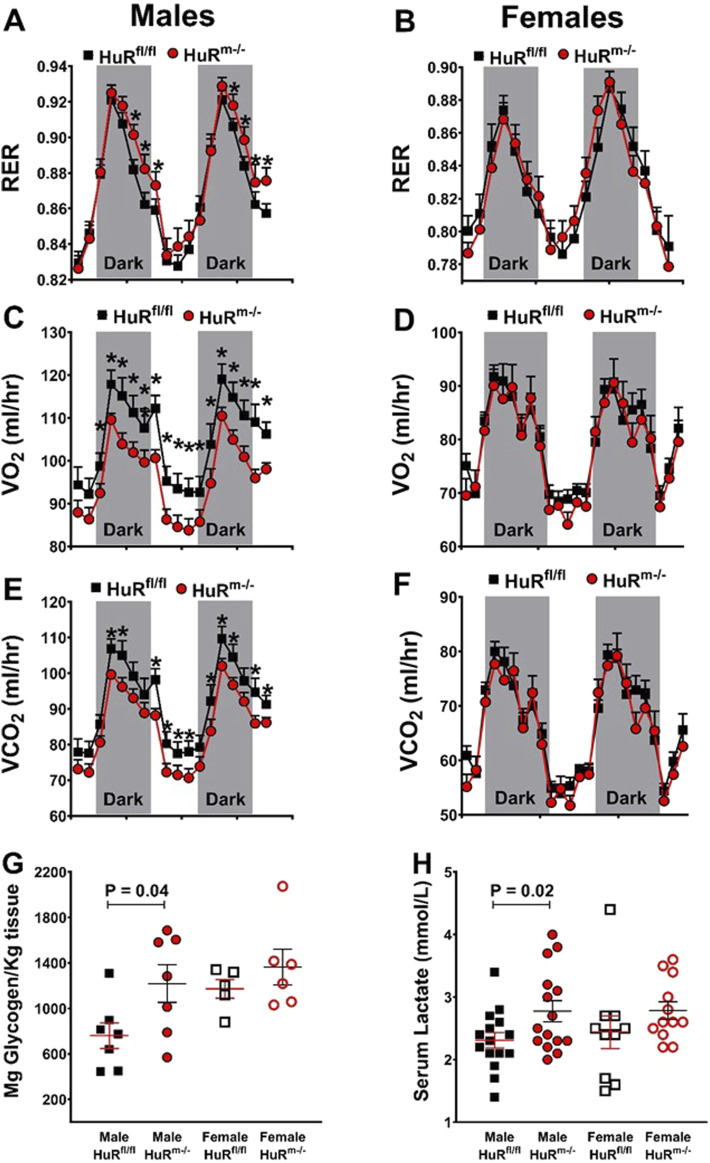 FIGURE 5
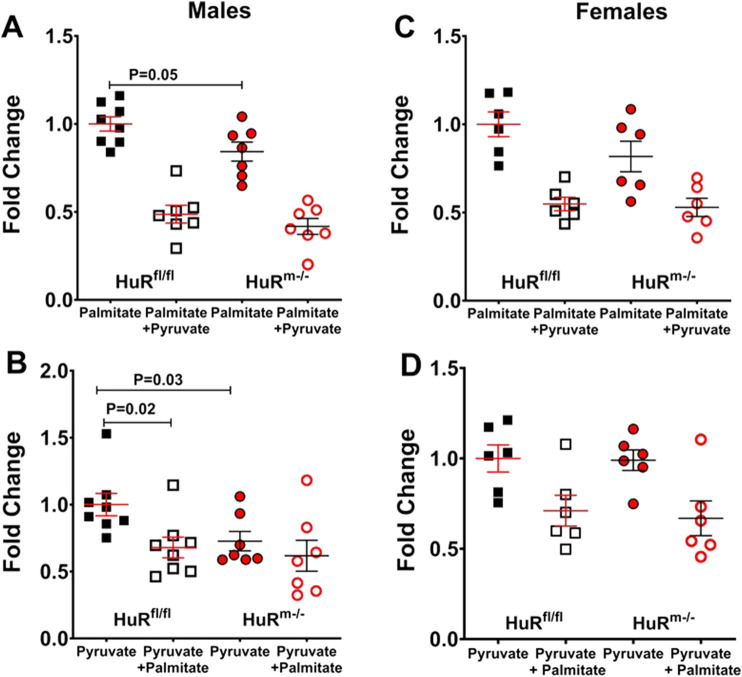 FIGURE 6
- —National Institute of Diabetes and Digestive and Kidney Diseases 10.13039/100000062
- —National Institute of General Medical Sciences 10.13039/100000057
- —NIH Office of the Director 10.13039/100000052
Peer Reviews
No public reviews on file for this paper yet. If you reviewed it on a platform where reviews are public (OpenReview, ICLR, NeurIPS, ICML), you can paste yours below so the community can read it here.
Videos
No videos yet. Explain this paper in a talk, walkthrough, or lecture? Add one.
Taxonomy
TopicsAdipose Tissue and Metabolism · Muscle Physiology and Disorders · Genetic Neurodegenerative Diseases
1 Introduction
Biological systems are metabolically flexible, allowing them to switch between different nutrient substrates for energy production. Flexibility can vary, and the degree to which a system can switch between different fuels when available has noteworthy implications in metabolic disease pathology (Goodpaster and Sparks, 2017; Storlien et al., 2004). As ectopic accumulation of lipids is known to interfere with insulin signaling (Goodpaster and Kelley, 2002; Samuel and Shulman, 2016), a decreased capacity to switch to lipid oxidation can be particularly detrimental. Humans with a decreased ability to adapt to a high-fat diet show an increased tendency toward fat mass gain, which is known to contribute to the development of metabolic disease (Begaye et al., 2020).
We have shown that the RNA-binding protein and master regulator, human antigen R (HuR), is important for the control of metabolic flexibility in skeletal muscle through its promotion of fatty acid oxidation in both mice and humans (Mynatt et al., 2019; Stone et al., 2021). However, this is a sex-specific phenomenon as only male mice experience a decrease in fatty acid oxidation in skeletal muscle when HuR is removed. This decreased fatty acid oxidation is accompanied by increased fat mass gain, which leads to more rapid development of hallmarks of insulin resistance relative to controls. Data on female HuR skeletal muscle knockout (HuR^m−/−^) mice are of particular interest as these mice have increased fat mass relative to controls but show no decrease in skeletal muscle fatty acid oxidation capacity and trend toward enhanced glucose clearance relative to controls (Stone et al., 2021).
Humans with decreased metabolic flexibility have decreased levels of transcripts regulated by HuR in skeletal muscle, regardless of whether the subjects are male or female (Mynatt et al., 2019), and compelling evidence shows that humans with decreased metabolic flexibility also show increases in serum lactate levels following exercise training (San-Millan and Brooks, 2018). Additionally, several studies have shown that male HuR^m−/−^ mice consistently show an increased respiratory exchange ratio (RER) relative to controls (Mynatt et al., 2019; Stone et al., 2021; Janice Sanchez et al., 2019). These studies, coupled with the increased glucose clearance observed in female HuR^m−/−^ mice, could suggest an increased reliance upon glycolysis within systems with decreased metabolic flexibility.
We hypothesized that HuR^m−/−^ mice may rely more heavily on glucose and that insulin signaling is interfered with in male HuR^m−/−^ mice as ectopic lipid content increases. To evaluate this hypothesis, we weight matched HuR^m−/−^ and control mice and tested several physiological parameters of glucose and lipid utilization. These assays included transcriptomic analyses, skeletal muscle pyruvate and palmitate oxidation assays, in vivo glucose and palmitate uptake assays, and glucose tolerance tests.
2 Materials and methods
2.1 Animals
The breeding of skeletal muscle-specific HuR-deficient (HuR^m−/−^) mice and littermate controls (HuR^fl/fl^) has been previously described (Mynatt et al., 2019). Briefly, mice floxed at elavl1, the gene encoding HuR, were purchased from the Jackson Laboratory (Ghosh et al., 2009) (Stock # 021431) and bred to mice expressing Cre recombinase under the control of the Mlc1f promoter (Bothe et al., 2000) (Jackson Laboratory, Stock # 024713) to delete HuR in skeletal muscle. All mice were on a C57BL/6 background. Mice were bred and group-housed at room temperature (RT; 22°C–24°C) under a 12:12-h light:dark cycle and allowed ad libitum access to food (Purina Mills 5015) and water. Mice were either 10–12 or 20–24 weeks of age when euthanized and the age of each group is listed for each dataset. The mice were euthanized by cervical dislocation, and tissues were collected, snap-frozen in liquid nitrogen, and stored at −80°C until subsequent analyses could be performed. Mixed gastrocnemius skeletal muscle was powdered and used for all assays presented, unless otherwise noted. The mice were euthanized according to the approved procedures of the Panel on Euthanasia of the American Veterinary Medical Association.
2.2 Animal procedures
Body composition was measured using a Bruker NMR Minispec (Bruker Corporation, Billerica, MA, United States). Glucose tolerance tests and blood lactate measurements were performed after a 4-h fast as previously described (Warfel et al., 2017). Briefly, at 10–12 weeks of age after measuring baseline blood glucose and lactate levels via the tail vein using either a lactate plus meter (Nova Biomedical) or a blood glucose monitoring system (OneTouch Ultra 2), mice received a 0.2-mL intraperitoneal injection of 20% D-glucose (40 mg glucose per mouse; 1.5 g/kg for males and 2 g/kg for females), and blood glucose levels were subsequently monitored at 20 min, 40 min, and 60 min post-injection. Behavioral and indirect calorimetry studies were done in a 16-chamber Promethion system (Sable Systems International, Las Vegas, NV, United States) on the mice at 20–22 weeks of age. For these experiments, the mice were single-housed at RT (22°C–24°C) under a 12:12-h light:dark cycle and allowed ad libitum access to food and water. Gastrocnemius muscle was used for the measurement of the total glycogen content in HuR^m−/−^ and control mice. A glycogen assay kit (Abcam, ab65620) was used for glycogen measurement following the manufacturer’s instructions.
2.3 RNA isolation
RNA was extracted from 20 to 30 mg of powdered mouse tissue using TRIzol (Thermo Fisher Scientific, Waltham, MA, United States), as previously described (Lam et al., 2014). Briefly, samples were homogenized in 300 μL TRIzol and allowed to sit at RT for 5 min, and then, 0.2 mL of chloroform was added. The samples were shaken vigorously for 15 s and allowed to sit at RT for 2–3 min before they were centrifuged (12,000 × g; 15 min; 4°C) to induce phase separation. Approximately 150 µL of the upper aqueous supernatant containing RNA was transferred to a new microcentrifuge tube to which 150 µL of 70% ethanol was added, and the samples were vortexed. RNA was then isolated using an RNeasy kit (QIAGEN, Valencia, CA, United States) with DNAse treatment, as per the manufacturer’s instructions. RNA content and quality (260/280 ratio range 1.9–2.1) were assessed using NanoDrop 1000.
2.4 RNA sequencing
Whole gastrocnemius muscle of HuR^m−/−^ and control mice (N = 5–7 per group) were used for total RNA extraction, as described in Section 2.3. RNA-seq libraries were constructed using Illumina’s TruSeq Stranded Total RNA Library Prep Kit with Ribo-Zero. RNA was sequenced on the Illumina NextSeq 500 using the High Output v2 Kit and paired-end sequencing forward and reverse reads (2 × 75 bp) with 75 million reads/sample. Gene-level aggregated raw counts were normalized via the TMM algorithm in edgeR (Robinson et al., 2010), and subsequent differential gene expression analysis was conducted via limma (Ritchie et al., 2015). Significantly regulated genes were defined as genes with an adjusted p-value of differential gene expression (false discovery rate or FDR) ≤ 0.05. Biological pathway enrichment was evaluated via Gene Set Enrichment Analysis (GSEA) (Mootha et al., 2003) with pathways drawn from the Kyoto Encyclopedia of Genes and Genomes (KEGG), available from Molecular Signatures Database, MSigDB (Liberzon et al., 2011), from WikiPathways (Agrawal et al., 2024), or Gene Ontology and Biological Pathways (GOBP) (Nguyen et al., 2015). For pathway analysis, pathways with an adjusted enrichment p-value (FDR) ≤ 0.1 were considered to be significantly regulated, following established methods (Griss et al., 2020; Reimand et al., 2019).
2.5 Quantitative RT-PCR
Total RNA from tissues was isolated as described above. cDNA was then synthesized using an iScript cDNA synthesis kit and used for qRT-PCR with the SYBR Green system (Bio-Rad, Hercules, CA, United States). Analysis was conducted using the Norma-gene macro, as previously described (Heckmann et al., 2011; O’Connell et al., 2017). The mouse ppib transcript was included as an additional reference gene within the Norma-gene macro to provide additional power. Primer details are given in Supplementary Table S1.
2.6 Substrate oxidation assays
Mixed gastrocnemius muscle homogenates were prepared as previously described [14]. Fatty acid oxidation was measured as the liberation of ^14^CO_2_ from [1–^14^C]-palmitate (ARC, St. Louis MO). Oxidation of palmitate at a final concentration of 200 μM unlabeled and 0.625 nCi/μL labeled was measured over the course of 30 min. Homogenates were incubated with or without 1 mM unlabeled pyruvate to measure the inhibition of palmitate oxidation. Pyruvate oxidation was measured using identical procedures, with the exception of using a final concentration of 1 mM pyruvate unlabeled and 0.625 nCi/μL [3–^14^C]-pyruvate (ARC, St. Louis MO) ± unlabeled palmitate (200 µM) to assess substrate competition. All reactions were conducted using media (pH 7.4) consisting of 100 mM sucrose, 60 mM EDTA, 10 mM Tris HCl, 10 mM K_2_HPO_4_, 80 mM KCl, 1 mM MgCl_2_ 6H_2_O, 1 mM L-carnitine, 0.05 mM malate, 1 mM DTT, 0.05 mM nicotinamide adenine dinucleotide, 2 mM ATP, and 0.05 mM CoA.
2.7 Glucose and lipid uptake assays
Using previously described procedures (Hom et al., 1984) with modifications, at 10–12 weeks of age, HuR^m−/−^ and control mice were fasted for 4 h and injected with either 200 µL of 20% glucose supplemented with 25 µL of 1 mCi/mL deoxy-D-glucose, 2-[1–^3^H] (ARC), or oral gavaged with 200 μL of olive oil supplemented with 125 μL 0.1 mCi/mL S-2-bromopalmitic acid [1–^14^C] (ARC). For the preparation of the palmitic acid solution, the stock solution was primarily ethanol, which was evaporated with compressed air prior to the addition of olive oil. Glucose-injected mice were euthanized after 40 min and palmitate-gavaged mice were euthanized after 3 h. Tissues were collected following euthanasia, and up to 75 mg of each tissue was placed in 1.5 mL of hexadecyltrimethylammonium bromide (Sigma) containing solubilization buffer and incubated for 6 h in a 65-C water bath with gentle shaking. Then, 10 mL of scintillation cocktail was added to each vial, and the vials were read for total ^3^H and ^14^C counts, respectively, in a scintillation counter.
2.8 Study approval
Animal studies were conducted at the Pennington Biomedical Research Center’s AALAC-approved facility. All experiments were in compliance with the NIH Guide for the Care and Use of Laboratory Animals and approved by the Pennington Biomedical Research Center Institutional Animal Care and Use Committee under PBRC IACUC Protocol #1049.
2.9 Statistics
Data are expressed as the mean ± SEM. For single-variable comparisons between control HuR^m−/−^ mice or between males and females, GraphPad Prism software was used to determine significant differences with paired, equal-variance two-tailed Student's t-tests, where normality was established using the D’Agostino–Pearson normality test. For multiple comparisons between genotypes and sex groups, GraphPad Prism software was used to determine significant differences with two-way ANOVA using Tukey’s post hoc analysis. For either test, p < 0.05 was considered significant.
3 Results
3.1 HuRm−/− male mice clear glucose better than controls at a young age
We previously reported that 20- to 24-week-old HuR^m−/−^ male mice have increased fat mass and impaired glucose clearance (Mynatt et al., 2019; Stone et al., 2021). As adiposity is strongly linked to glucose intolerance (Goodpaster and Sparks, 2017; Goodpaster and Kelley, 2002), we sought to determine whether glucose intolerance preceded the development of adiposity. In the present study, 10- to 12-week-old HuR^m−/−^ male mice exhibited similar levels of body weight and fat mass as age-matched controls (Figure 1A). Interestingly, in the absence of differences in adiposity, young HuR^m−/−^ male mice exhibited improved glucose tolerance (Figure 1C). In addition, our previous work reported sex-specific differences in HuR^m−/−^ mice. Specifically, while 20- to 24-week-old female HuR^m−/−^ mice exhibited similar increases in adiposity as HuR^m−/−^ male mice, unlike their male counterparts, females had improved glucose clearance rates (Stone et al., 2021). Within the present study, we tested the link between adiposity and glucose tolerance in 10- to 12-week-old mice, which showed similar body weight and fat mass between HuR^m−/−^ vs. floxed controls (Figure 1B). Surprisingly, the results herein suggest that in the absence of expansion of adiposity, female HuR^M−/−^ mice do not exhibit improvements in glucose tolerance (Figure 1D).
*Male HuRm−/− mice show increased glucose clearance relative to controls when weight-matched. (A, B) Body weight, lean mass, and fat mass are shown for control (black) and HuRm−/− (red) males (A) and females (B). (C, D) GTT are shown with the area under the curve displayed as an inset figure for control (black) and HuRm−/− (red) males (C) and females (D). N = 21–22; p ≤ 0.05.
3.2 Enhanced glucose clearance in HuRm−/− male mice is seen principally in skeletal muscle
To determine where glucose clearance may be enhanced in male HuR^m−/−^ mice, we utilized these same 10- to 12-week-old mice to monitor glucose uptake following injection with 1,2-^3^H, 2-deoxy-D-glucose (2DG). Male HuR^m−/−^ mice show a significant increase in glucose uptake in skeletal muscle when all tissues are averaged together as a whole, and this increase is especially localized to tissues with a significant proportion of type II skeletal muscle fibers such as gastrocnemius and extensor digitorum longus (EDL) (Figures 2A, C). Females on the other hand show no increases in uptake in any measured tissues but have a slightly decreased clearance in adipose tissue (Figures 2B, D). The only other tissue where significant differences in glucose uptake were noted was brown adipose tissue (BAT), where glucose uptake is significantly higher in HuR^m−/−^ males than in controls. Given the common origin of BAT and skeletal muscle as Myf5^+^ cells (Jung et al., 2019), we verified that mRNA of elavl1, the gene encoding HuR, was not expressed at a lower level in BAT of HuR^m−/−^ animals as it was it gastrocnemius compared to controls (Supplementary Figure S1). Although the result of increased glucose uptake in BAT in the absence of skeletal muscle HuR is intriguing and warrants further investigation, we did not perform further analyses of this phenomenon.
*Increased glucose uptake is localized primarily to skeletal muscle in male HuRm−/− mice. (A–D) Glucose uptake is shown in muscle (A, B) and additional (C, D) tissues from control (black) and HuRm−/− (red) males (A, C) and females (B, D). (E–H) Palmitate uptake is shown in various tissues (E, F) and skeletal muscle and white adipose tissues (G, H) from control (black) and HuRm−/− (red) males (E, G) and females (F, H). BAT, brown adipose tissue; iWAT, inguinal white adipose tissue; gWAT, gonadal white adipose tissue; Gas, gastrocnemius; EDL, extensor digitorum longus; Sol, soleus; RQ, red quadriceps; WQ, white quadriceps; muscle, average of all muscles. N = 9–10; p ≤ 0.05.
In addition to monitoring glucose uptake, we also monitored tissue uptake of 1-^14^C-S-2-bromopalmitate (2BP) to determine whether baseline clearances in dietary fat contributed to enhanced fat mass gain. HuR^m−/−^ males exhibited significantly increased uptake of 2BP only in the liver (Figures 2E, G), whereas no differences in lipid uptake were observed between genotypes in female mice (Figures 2F, H).
3.3 HuRm−/− male mice have an increased glycolytic mRNA signature in skeletal muscle
A second cohort of mice of 20 weeks of age (WOA) was studied for better comparison to previous studies (Mynatt et al., 2019; Stone et al., 2021). Mice from each genotype controlled for weight were used for transcriptomics analyses conducted on total RNA isolated from skeletal muscle of HuR^m−/−^ and control mice. We utilized gastrocnemius muscle in order to represent a sample known to contain a relatively equal number of type 1 and type 2 muscle fibers (Schiaffino and Reggiani, 2011), which also showed enhanced glucose clearance during uptake assays (Figure 2A). Reporting only genes with an FDR < 0.05, we found that the total number of differentially expressed genes between male HuR^m−/−^ and control samples was 384, whereas female mice had 315 differentially expressed genes (Figure 3A). Differences between male and female skeletal muscle were much more pronounced, with 2,974 genes being differentially expressed between control male and female samples. Remarkably, the removal of HuR decreased this number by 50% to 1,483 differentially expressed genes.
Removal of HuR from skeletal muscle reduces differential gene expression between males and females by half. (A) Number of differentially expressed genes between control and HuRm−/− mice separated by sex, or male and female mice separated by genotype. (B) Scatterplot analyses of log2 (fold change) between females of different genotypes versus males of different genotypes. First panel plots genes that are significantly differentially expressed (FDR<0.05) between male animals of different genotypes only. Middle panel plots genes that are significantly differentially expressed (FDR<0.05) between male and female animals of different genotypes. Last panel plots genes that are significantly differentially expressed (FDR<0.05) between female animals of different genotypes only. (C) Scatterplot analyses plotting log2 (fold change) between sexes of controls versus sexes of HuRm−/− mice. First panel plots genes that are significantly differentially expressed (FDR<0.05) between sexes in controls only. Middle panel plots genes that are significantly differentially expressed (FDR<0.05) between sexes within both genotypes. Last panel plots genes that are significantly differentially expressed (FDR<0.05) between sexes in HuRm−/− mice only.
Scatterplots were generated with genes at FDR<0.05 by comparing Log_2_ (fold change) between all groups. These comparisons were of genes that were differentially expressed in either the male HuR^fl/fl^ vs. male HuR^m−/−^ comparison (left panel, Figure 3B), female HuR^fl/fl^ vs. female HuR^m−/−^ comparison (right panel, Figure 3B), or differentially expressed in both comparisons (middle panel, Figure 3B). These plots reveal that among both common and uniquely differentially expressed genes between groups, the direction of change in expression in HuR^m−/−^ mice compared to controls is largely consistent regardless of sex. When similar scatterplots are created comparing sexes within a given genotype (Figure 3C), the direction of change in female mice tends to be consistent compared to males regardless of the genotype. Collectively, these results demonstrate that the removal of HuR results in few changes in gene expression relative to controls but greatly diminishes transcriptomic differences between male and female gastrocnemius muscle.
Through pathway enrichment analysis via GSEA, we determined pathways that were significantly different in group comparisons with FDR ≤ 0.1. Of the top 60 pathways identified (Supplementary Figure S2A), the Ppar signaling pathway was number 3, and the glycolysis/gluconeogenesis pathway was number 7. The Ppar signaling pathway is a known regulator of both fat metabolism and lipid biosynthesis (Christofides et al., 2021), and we have previously reported differences in expression levels of genes within this pathway between male HuR^m−/−^ and control male mice (Stone et al., 2021). The differential expression in Ppar signaling pathway genes thus likely relates to metabolic changes within skeletal muscle lacking HuR (Supplementary Figure S3).
Further analysis of differences in the KEGG pathway termed “glycolysis/gluconeogenesis” between groups (Figures 4A–D) indicated differences that in general followed the same trend as was found in the Ppar signaling pathway. Significant enrichment was found in female controls relative to male controls with FDR = 0.08 and in female controls relative to female HuR^m−/−^ with FDR = 0.03. In contrast to females, male HuR^m−/−^ gastrocnemius muscle showed enrichment in glycolysis/gluconeogenesis pathway gene expression with FDR = 0.08. Strikingly, the pathway enrichment found in female relative to control males was not seen between HuR^m−/−^ males and females (FDR = 0.68).
*Male HuRm−/− mice show an increased glycolytic transcript signature. (A–D) KEGG enrichment plots and Gene Set Enrichment Analyses showing differential expression of glycolysis/gluconeogenesis genes for each comparison of genotypes or sexes. (A) Male genotype comparison (downregulated in controls, FDR = 0.08). (B) Female genotype comparison (upregulated in controls, FDR = 0.03). (C) Control sex comparison (upregulated in females, FDR = 0.08). (D) HuRm−/− sex comparison (not significant, FDR = 0.68). (E) qPCR analysis of glycolytic genes for control (black) and HuRm−/− (red) males (solid) and females (checkered). N = 7–8; p ≤ 0.05 for the marked bar compared to all other groups.
To further confirm these results indicating that female muscle has enhanced glycolytic gene expression relative to males, which is ablated in the absence of HuR, we used qPCR to analyze the expression of glycolytic genes within the four groups (Figure 4E). Significance calculations using two-way ANOVA suggest that 3 of the 11 genes measured are significantly decreased in expression in control male muscle relative to females, whereas only 1 gene, pfk, is significantly different between males and females of the HuR^m−/−^ genotype, and this is due to an increase in this gene in male over female levels. Whereas no genes are significantly different between females of different genotypes, skeletal muscle HuR knockout results in increased expression of four genes in HuR^m−/−^ males relative to controls. Specifically, for pgk, pgm, and eno1, knockout of HuR from skeletal muscle of males renders expression levels much more similar to those in female control and HuR^m−/−^ muscle. These results reinforce the suggestion that the knockout of HuR from skeletal muscle results in a more similar gene expression pattern between male and female gastrocnemius, including an increased glycolytic signature in males that is more similar to that seen in female controls.
3.4 HuRm−/− male mice show additional markers of increased carbohydrate usage such as increased RER, serum lactate, and muscle glycogen levels
In addition to the mRNA analyses above, we used indirect calorimetry to assess metabolic parameters for HuR^m−/−^ mice and weight-matched controls. As with previous results (Mynatt et al., 2019; Stone et al., 2021), we found increases in respiratory exchange ratios (RERs) for male but not female HuR^m−/−^ mice relative to controls (Figures 5A, B). Increases in RERs in male HuR^m−/−^ mice are reflective of decreases in oxygen consumption that are more robust than decreases in carbon dioxide production (Figures 5C–F). Although RER can be influenced by total activity and food intake, we did not find any differences in these parameters between groups (Supplementary Figure S4).
*Male HuRm−/− mice show an increased respiratory exchange ratio and muscle glycogen and serum lactate levels. (A, B) RERs are plotted for control (black) and HuRm−/− (red) males (A) and females (B). Total oxygen consumption is plotted for control (black) and HuRm−/− (red) males (C) and females (D). Total carbon dioxide production is plotted for control (black) and HuRm−/− (red) males (E) and females (F). (G) Gastrocnemius glycogen content is plotted for control (black) and HuRm−/− (red) males (closed) and females (open). (H) Serum lactate levels are plotted for control (black) and HuRm−/− (red) males (closed) and females (open). N = 5–8; p ≤ 0.05.
We then tested muscle and serum for glycogen content and lactate, respectively, as additional markers of increased carbohydrate utilization. The skeletal muscle glycogen content is increased in male HuR^m−/−^ mice relative to controls (Figure 5G). Despite gene expression showing no difference in levels of the ldh gene, which encodes for lactate dehydrogenase (Figure 4E), serum lactate levels were also increased in male HuR^m−/−^ mice relative to controls (Figure 5H). Although female HuR^m−/−^ mice show a trend toward increases in levels of each of these markers, they are not significantly different between HuR^m−/−^ females and controls, or between HuR^m−/−^ females and HuR^m−/−^ males. This reinforces that the removal of HuR from skeletal muscle results in several increased similarities between male and female mouse muscle.
3.5 Both palmitate and pyruvate oxidation are decreased in HuRm−/− male mice relative to controls
Our previous results have indicated that not only are mRNA transcripts of proteins involved in fat oxidation decreased in HuR^m−/−^ male skeletal muscle (Stone et al., 2021) but also mRNA associated with oxidative phosphorylation proteins is decreased (Mynatt et al., 2019). We therefore sought to test whether pyruvate oxidation was also decreased, which would implicate decreased mitochondrial function following glycolysis. Relative to controls, male HuR^m−/−^ mice show significant decreases in base oxidation of both palmitate and pyruvate (Figures 6A, B). Substrate competition designs were used for each, and the results showed that pyruvate effectively inhibited palmitate oxidation similarly in both genotypes; however, the ability of palmitate to serve as a competing substrate against pyruvate was less robust in HuR^m−/−^ males than in floxed controls (Figures 6A, B). Female HuR^m−/−^ mice show no differences in levels of maximal pyruvate or palmitate oxidation relative to controls, or in the shift toward oxidation of the alternate substrate in either assay (Figures 6C, D). These results provide further evidence that the removal of HuR from skeletal muscle results in the decreased utilization of mitochondrial metabolic substrates in a sex-specific manner.
*Not only palmitate but also pyruvate oxidation is decreased in male HuRm−/− mice relative to controls. (A, B) Palmitate (A) or pyruvate (B) oxidation as measured by 14CO2 production in gastrocnemius homogenates from control (black) and HuRm−/− (red) males. Palmitate oxidation was measured both in the absence (closed) and presence (open) of 1 mM pyruvate as an inhibitor. (C, D) Palmitate (C) or pyruvate (D) oxidation as measured by 14CO2 production in gastrocnemius homogenates from control (black) and HuRm−/− (red) females. Pyruvate oxidation was measured both in the absence (closed) and presence (open) of 200 µM palmitate as an inhibitor. N = 6–8; p < 0.05.
4 Discussion
The degree to which mammals can switch between different substrates as cellular fuel has profound implications for the development and treatment of metabolic disease. Decreased HuR function in skeletal muscle is associated with decreased metabolic flexibility (Mynatt et al., 2019; Stone et al., 2021), and HuR removal from male mouse skeletal muscle correlates with increased fat mass, resulting in hallmarks of insulin resistance. This is a sex-specific phenomenon, with female HuR^m−/−^ mice not suffering the metabolic decrease associated with fat mass gain (Stone et al., 2021).
In the present study, we demonstrate that weight-matched male HuR^m−/−^ mice show several physiological indications of enhanced glucose utilization. These mice have greater glucose uptake, specifically in muscle tissues known to have a higher proportion of type 2 fibers in HuR^m−/−^ males relative to controls (Schiaffino and Reggiani, 2011). Male HuR^m−/−^ mice have been shown to have an increased prevalence of type 1 skeletal muscle fibers relative to controls (Janice Sanchez et al., 2019), which exhibit higher glucose uptake than type 2 fibers (Bocek et al., 1966). Our observed increase in glucose uptake in tissues such as gastrocnemius and EDL may thus be related to this shift. As increased uptake is seen only in males; it is worth noting that several studies report higher ratios of type 1/type 2 skeletal muscle fibers in female mammals (Haizlip et al., 2015; Nuzzo, 2023; Nuzzo, 2024). Our results together with these and other reports (Janice Sanchez et al., 2019) thus suggest that HuR removal results in increased similarity between male and female skeletal muscle.
Transcriptomic signatures reinforce this greater similarity between the sexes following the removal of HuR from skeletal muscle. Although female control mice show an increase in glycolysis pathway transcripts in skeletal muscle relative to males, this is ablated in HuR^m−/−^ animals. Our data suggest that this may be due to an increase in the expression of several glycolytic genes in male HuR^m−/−^ animals relative to controls. HuR may thus be involved not only in increasing fat metabolism but also in downregulating the glycolytic pathway.
Several additional pieces of evidence suggest enhanced glucose usage in male mice following the removal of HuR from skeletal muscle, including higher RER in HuR^m−/−^ males and increased glycogen storage. It is also noteworthy that HuR^m−/−^ males show an increase in serum lactate, which is associated with decreased metabolic flexibility and could indicate a tendency toward lactate metabolism due to decreases in mitochondrial oxidative capacity (San-Millan and Brooks, 2018).
Despite some increased similarities between male and female skeletal muscle lacking HuR, males and females show a different metabolic response. Male but not female HuR^m−/−^ mice have a decreased ability to oxidize not only palmitate but also pyruvate, which is the end product of glycolysis. This may indicate that although skeletal muscle signatures become more similar between the sexes following HuR removal, circulating factors within female animals may contribute to the differences in metabolic processing within the muscle. Indeed, serum levels of both adiponectin and estrogen are elevated in females relative to males and are known to enhance lipid oxidation in the periphery (Campbell and Febbraio, 2001; Sparks et al., 2009a; Sparks et al., 2009b). Further investigation of the role of these hormones in the metabolic differences between HuR^m−/−^ males and females will therefore be of interest in future studies.
Male HuR^m−/−^ mice showing decreased oxidation of both palmitate and pyruvate together with increased serum lactate levels relative to controls could also indicate decreased mitochondrial function. We have previously shown changes in mitochondrial signatures in male HuR^m−/−^ mice, including decreased oxidative phosphorylation and fat oxidation gene expression (Mynatt et al., 2019; Stone et al., 2021). HuR^m−/−^ mice also have increased mitochondrial copy number, and increases in Pgc1 (alpha), the mitochondrial biogenesis factor and Ppar coactivator Pgc1α (Stone et al., 2021; Janice Sanchez et al., 2019). This correlates with our present result indicating increased activation of Ppar signaling pathways in HuR mice. Although increased mitochondrial DNA can indicate increased function (Hood et al., 2000; Memon et al., 2021), it can also reflect mitochondrial defects (Castellani et al., 2020; Filograna et al., 2021). Our results showing decreases in oxidation of both palmitate and pyruvate thus encourage further investigation of mitochondrial integrity via morphological and respirometric analyses.
Finally, the introduction of pyruvate as an inhibitor of palmitate oxidation results in a much greater inhibition than when palmitate is used to inhibit pyruvate oxidation. Therefore, whereas fat oxidation is readily inhibited by a carbohydrate substrate, the reverse is not so, again suggesting a preference for carbohydrates in male skeletal muscle lacking HuR. The collection of these results thus shows a favorability for glucose in male HuR^m−/−^ muscle relative to controls, which is not the case for females. Given that several results reported here suggest greater ambiguity within skeletal muscle between male and female HuR^m−/−^ mice than between sexes within control mice, future studies aimed at understanding how HuR promotes mitochondrial oxidation are essential to fully elucidate its role in regulating metabolic flexibility in a sex-specific manner.
The reference list from the paper itself. Each links out to its DOI / PubMed record.
- 1Agrawal A.Balci H.Hanspers K.Coort S. L.Martens M.Slenter D. N. (2024). Wiki Pathways 2024: next generation pathway database. Nucleic Acids Res. 52 (D 1), D 679–D 689. 10.1093/nar/gkad 960 37941138 PMC 10767877 · doi ↗ · pubmed ↗
- 2Begaye B.Vinales K. L.Hollstein T.Ando T.Walter M.Bogardus C. (2020). Impaired metabolic flexibility to high-fat overfeeding predicts future weight gain in healthy adults. Diabetes 69 (2), 181–192. 10.2337/db 19-0719 31712321 PMC 6971489 · doi ↗ · pubmed ↗
- 3Bocek R. M.Peterson R. D.Beatty C. H. (1966). Glycogen metabolism in red and white muscle. Am. J. Physiol. 210 (5), 1101–1107. 10.1152/ajplegacy.1966.210.5.1101 5947256 · doi ↗ · pubmed ↗
- 4Bothe G. W.Haspel J. A.Smith C. L.Wiener H. H.Burden S. J. (2000). Selective expression of Cre recombinase in skeletal muscle fibers. Genesis 26 (2), 165–166. 10.1002/(sici)1526-968x(200002)26:2<165::aid-gene 22>3.3.co;2-6 10686620 · doi ↗ · pubmed ↗
- 5Campbell S. E.Febbraio M. A. (2001). Effect of ovarian hormones on mitochondrial enzyme activity in the fat oxidation pathway of skeletal muscle. Am. J. Physiol. Endocrinol. Metab. 281 (4), E 803–E 808. 10.1152/ajpendo.2001.281.4.E 803 11551858 · doi ↗ · pubmed ↗
- 6Castellani C. A.Longchamps R. J.Sun J.Guallar E.Arking D. E. (2020). Thinking outside the nucleus: mitochondrial DNA copy number in health and disease. Mitochondrion 53, 214–223. 10.1016/j.mito.2020.06.004 32544465 PMC 7375936 · doi ↗ · pubmed ↗
- 7Christofides A.Konstantinidou E.Jani C.Boussiotis V. A. (2021). The role of peroxisome proliferator-activated receptors (PPAR) in immune responses. Metabolism 114, 154338. 10.1016/j.metabol.2020.154338 32791172 PMC 7736084 · doi ↗ · pubmed ↗
- 8Filograna R.Mennuni M.Alsina D.Larsson N. G. (2021). Mitochondrial DNA copy number in human disease: the more the better? FEBS Lett. 595 (8), 976–1002. 10.1002/1873-3468.14021 33314045 PMC 8247411 · doi ↗ · pubmed ↗