Partially purified Strongyloides ratti antigen improved the diagnostic performance of strongyloidiasis by enzyme-linked immunosorbent assay (ELISA) and immunochromatographic test (ICT)
Phattharaphon Wongphutorn, Chanika Worasith, Kulthida Y. Kopolrat, Chatanun Eamudomkarn, Opal Pitaksakulrat, Nuttanan Hongsrichan, Patcharaporn Tippayawat, Anchalee Techasen, Jiraporn Sithithaworn, Teeranat Homsombut, Peter Odermatt, Rahmah Noordin, Paiboon Sithithaworn

TL;DR
Researchers improved the accuracy of diagnosing strongyloidiasis by purifying a specific antigen, making tests more reliable and suitable for point-of-care use.
Contribution
The study demonstrates that partially purified Strongyloides ratti antigen significantly enhances the sensitivity and specificity of serological tests for strongyloidiasis.
Findings
The washing fraction (WF) of purified antigen showed higher sensitivity and specificity in ELISA and ICT compared to crude antigen.
WF-based ICT showed almost perfect agreement with fecal examination (Kappa = 0.94).
Purified antigen reduced cross-reactivity with other parasitic infections like Opisthorchis viverrini and Taenia spp.
Abstract
Strongyloides stercoralis infection is a neglected tropical disease with a global distribution. Serodiagnosis is a sensitive method, but improving its performance and simplifying into a point-of-care test (POCT) are needed. This study aimed to improve the diagnostic performance of serological tests using partially purified Strongyloides ratti antigen in an enzyme-linked immunosorbent assay (ELISA) and an immunochromatographic test (ICT). Crude S. ratti antigen was purified by an IgG affinity column to partition the antigen into flow-through, washing fraction (WF), and elution fractions. Optimized ELISA and ICT using crude and antigen fractions were used to analyze sera from three groups of subjects. Group 1 comprised subjects with proven strongyloidiasis, Group 2 were subjects with other parasitic infections, and Group 3 were negative parasitic infections. The diagnostic performance and…
Genes, proteins, chemicals, diseases, species, mutations and cell lines named across the full text — each resolved to its canonical identifier and authoritative record.
Click any figure to enlarge with its caption.
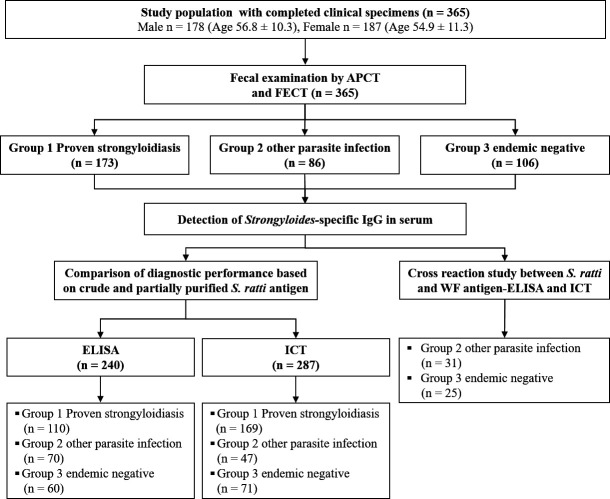 Fig 1
Fig 1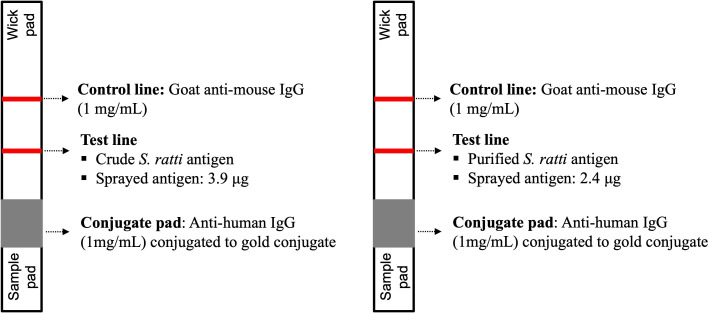 Fig 2
Fig 2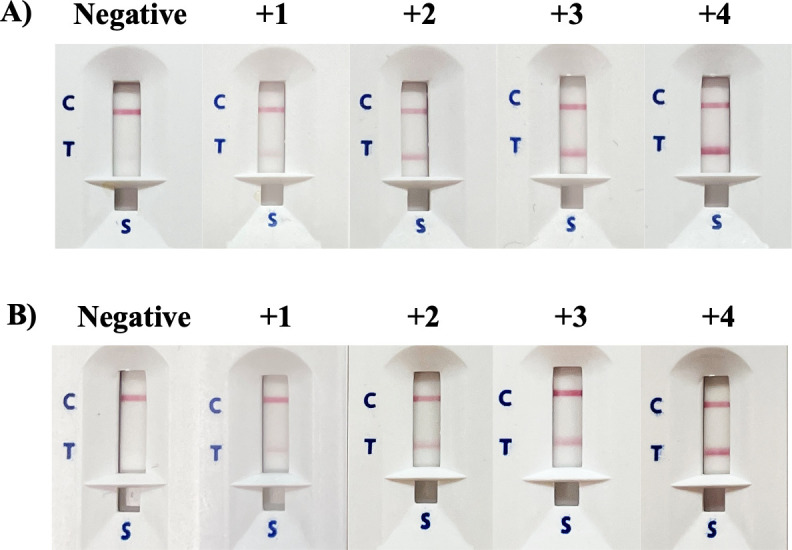 Fig 3
Fig 3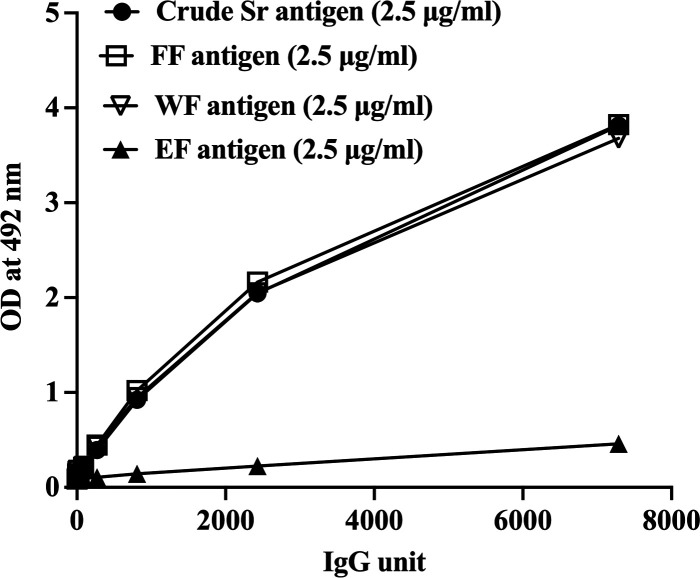 Fig 4
Fig 4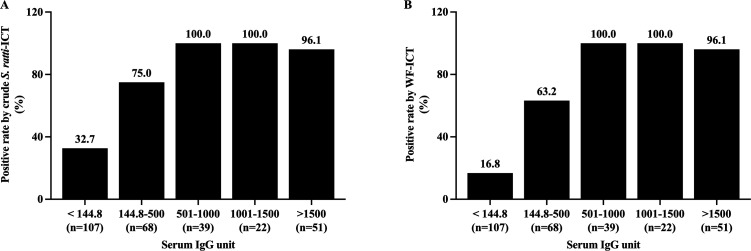 Fig 5
Fig 5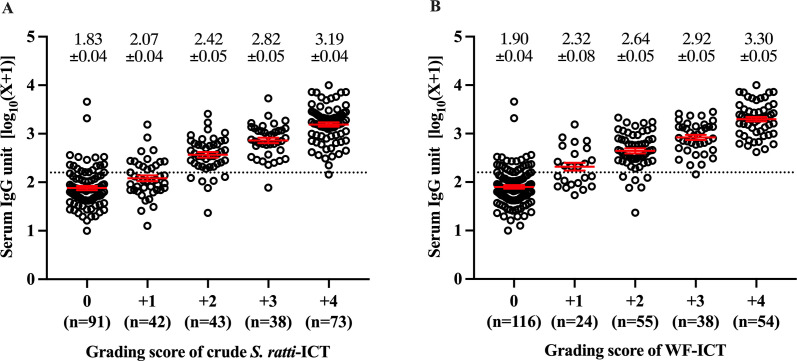 Fig 6
Fig 6| Group | N | No. positive by crude | FF-ELISA | WF-ELISA | ||
|---|---|---|---|---|---|---|
| No. positive (%) |
| No. positive (%) |
| |||
| Group 1 Proven | 110 | 103 | 103 | > 0.05 | 100 | > 0.05 |
| Group 2 Other | 70 | 36 | 34 | > 0.05 | 32 | > 0.05 |
| Group 3 Endemic | 60 | 26 | 22 | > 0.05 | 16 | < 0.01 |
| Diagnostic performance test | Fecal examination as reference standard | ||
|---|---|---|---|
| Crude | Purified | ||
| FF-ELISA | WF-ELISA | ||
| Sensitivity (%) (95% CI) | 93.6 (87.3–97.4) | 93.6 (8 | 90.9 (83.9–95.6) |
| Specificity (%) (95% CI) | 52.3 (43.3–61.1) | 56.9 (48.0–65.8) | 63.1 (54.2–71.4) |
| PPV (%) (95% CI) | 62.4 (54.6–69.8) | 64.8 (56.8–72.2) | 67.6 (59.4–75.1) |
| NPV (%) (95% CI) | 90.7 (81.7–96.2) | 91.4 (83.0–96.5) | 89.1 (80.9–94.7) |
| Group | N | No. of positive by crude | No. of positive by WF- ICT (%) |
|
|---|---|---|---|---|
| Group 1 Proven strongyloidiasis | 169 | 166 (98.2) | 166 (98.2) | > 0.05 |
| Group 2 Other parasitic infections | 47 | 17 (36.2) | 5 (10.6) | < 0.001 |
| Group 3 Endemic negatives | 71 | 13 (18.3) | 0 (0.0) | < 0.001 |
| Diagnostic performance test (%) | Fecal examination as reference standard | |
|---|---|---|
| Crude | Wf-ICT | |
| Sensitivity (95% CI) | 98.2 (94.9–99.6) | 98.2 (94.9–99.6) |
| Specificity (95% CI) | 74.6 (65.7–82.1) | 95.8 (90.4–98.6) |
| PPV (95% CI) | 84.7 (80.2–88.3) | 97.1 (93.4–98.7) |
| NPV (95% CI) | 96.7 | 97.4 (92.5–99.1) |
| Accuracy (95% CI) | 88.5 (84.2–92.0) | 97.2 (94.6–98.8) |
| Population | N | Positive tests by diagnostic methods (%) | |||
|---|---|---|---|---|---|
| Crude-ELISA | WF-ELISA | Crude-ICT | WF-ICT | ||
| Group 2 | |||||
| | 24 | 4 (16.7) | 3 (12.5) | 8 (33.3) | 0 (0.0) |
| | 1 | 0 (0.0) | 0 (0.0) | 1 (100.0) | 0 (0.0) |
| Minute intestinal flukes | 2 | 2 (100.0) | 2 (100.0) | 2 (100.0) | 2 (100.0) |
| | 3 | 1 (33.3) | 0 (0.0) | 2 (66.7) | 0 (0.0) |
| | 1 | 0 (0.0) | 0 (0.0) | 1 (100.0) | 0 (0.0) |
| Group 3 | |||||
| Endemic negative | 25 | 3 (12.0) | 1 (4.0) | 5 (20.0) | 0 (0.0) |
| Total | 56 | 10 (17.9) | 6 (10.7) | 19 (33.9) | 2 (3.6) |
- —National Research Council of Thailand (NRCT)
- —Program management unit for Human Resources and Institution Development, Research and Innovation
Peer Reviews
No public reviews on file for this paper yet. If you reviewed it on a platform where reviews are public (OpenReview, ICLR, NeurIPS, ICML), you can paste yours below so the community can read it here.
Videos
No videos yet. Explain this paper in a talk, walkthrough, or lecture? Add one.
Taxonomy
TopicsParasites and Host Interactions · Parasite Biology and Host Interactions · Helminth infection and control
INTRODUCTION
Strongyloides stercoralis is an intestinal parasitic helminth and is widespread globally, including in Southeast Asia, especially Thailand, Lao People’s Democratic Republic, and Cambodia (1–3). Most strongyloidiasis patients are asymptomatic but may exhibit gastrointestinal or dermatological symptoms or progress to highly fatal hyper- or disseminated infections. Effective control and elimination programs require highly sensitive and specific methods for detecting S. stercoralis infection. It is known that parasitological examination methods used in the fecal examination are not sensitive. Consequently, several alternative methods have been developed, including serological and molecular techniques. The latter detect parasite-specific DNA by conventional and real-time polymerase chain reaction in feces and urine (4–6). The enzyme-linked immunosorbent assay (ELISA) is the most widely used serological assay for detecting Strongyloides-specific antibodies in serum and urine using several antigen preparations. The use of Strongyloides ratti as a heterologous antigen for serodiagnosis of strongyloidiasis is preferable compared to S. stercoralis due to the ease and safety of the antigen preparation (7). Other sources of antigen, especially recombinant proteins, are also used as alternative materials to Strongyloides native proteins for detecting parasite**-**specific IgG and IgG4 antibodies (8, 9).
The use of S. ratti as a heterologous antigen for the serodiagnosis of strongyloidiasis presents several advantages over S. stercoralis. Large-scale production of S. stercoralis filariform larvae relies on human hosts or experimentally infected dogs or primates. This process is not only logistically complex but also poses significant biohazard risks to laboratory personnel. In contrast, S. ratti antigens can be safely and efficiently produced using laboratory rats and mice, offering a more secure and practical alternative. Research into the antigenic composition of S. ratti extracts supports its potential as a reliable source of antigens for the immunodiagnosis of human strongyloidiasis (7, 8, 10–13). Concerning diagnostic platforms, other than ELISA, the immunochromatographic test (ICT) is a method of choice in developing a rapid diagnostic test (RDT) for serodiagnosis of strongyloidiasis. ICTs have been used in detecting strongyloidiasis using crude S. stercoralis and recombinant antigens (14–20). Previous studies have reported several immunodominant antigenic components when using S. ratti as an antigen, and cross**-reactions with other parasitic infections were observed (7, 13, 20, 21). Indeed, these cross-reactions were also reported in IgG-**ELISA using various antigens prepared from S. stercoralis, rNIE, and S. ratti (8, 13, 22). These results are not unexpected since multiple parasitic infections are common, and shared antigens among the parasites are conceivable. In the case of northeast Thailand, coinfections of Opisthorchis viverrini with S. stercoralis were commonly observed (7, 13, 20, 23).
Due to the complexity of S. ratti’s crude native antigen, we anticipated that partial antigen purification could improve its diagnostic accuracy in detecting strongyloidiasis. Previously, partial purification of S. stercoralis antigen to identify fractions that enhanced the diagnostic accuracy of detecting strongyloidiasis had been reported, but they did not include analysis on S. ratti (24).
Our study, therefore, focused on the diagnostic performance of partially purified S. ratti antigens in detecting strongyloidiasis. We compared this with crude S. ratti antigen, employing both ELISA and ICT platforms for assessment.
MATERIALS AND METHODS
Study design and clinical samples
This study was a diagnostic performance evaluation using retrospective samples. The serum samples were retrieved from the specimen depository of the Cholangiocarcinoma Research Institute, Khon Kaen University, under the project on the liver fluke control program. The project was started from 20 June 2022 to 29 January 2024. The presence of parasitic infections was assessed by fecal examination using the formalin**-**ethyl acetate concentration technique (FECT) (25), and the agar plate culture technique (APCT) (10, 26).
The study participants were separated into three groups based on the results of the fecal examination (FECT and APCT). Group 1 comprised samples from subjects with proven strongyloidiasis (larvae positive) by fecal examination (to determine diagnostic sensitivity), Group 2 comprised samples from subjects with other parasitic infections (excluding S. stercoralis infection), and Group 3 comprised samples from subjects negative for parasite infections, that is, “endemic negatives” (to determine diagnostic specificity). Results are reported following the Standards for Reporting Diagnostic Accuracy guidelines (27).
In determining the sample size, calculations were carried out using method by Fenn Buderer (28). We assumed that the assays (ELISA and ICT) using the partially purified S. ratti antigens have similar sensitivity and specificity as the existing ELISA using crude S. ratti antigen (88.1% and 58.8%, respectively) (20). The sample size calculation was based on the proportion of the population expected to be positive for S. stercoralis (9%) (29) with the standard score (Z-score) set at 1.96, corresponding to a 95% confidence level ±5%. The calculated sample size for diagnostic sensitivity was 96, assuming a sensitivity of 90%. The calculated sample size for diagnostic specificity was 114, assuming a specificity of 60%. Figure 1 shows the participants’ groupings, assays performed, and study flow.
Diagram showing the participants’ groupings, assays performed, and study flow.
Preparation of crude S. ratti antigen
The life cycle of S. ratti was maintained in Wistar rats. The rats were each inoculated subcutaneously with 5,000 S. ratti third-stage filariform larvae (L3). After 7 days post-infection, fecal samples were examined to confirm the infection, and fecal culture was performed over 20 days by the filter paper culture technique. The supernatant was collected and centrifuged daily, and the pelleted L3 was cleaned under a stereo microscope and then stored at −20°C. Soluble antigen from the L3 was extracted as described previously (30). Briefly, the L3 larvae were washed several times in sterile phosphate-buffered saline (PBS, pH 7.4). Proteinase inhibitor (GE Healthcare, Bio-Sciences Corp., USA) was added to prevent protein degradation. The larvae were disrupted by sonicating for 1 hour at 40 KHz (pulse on 5 s and pulse off 5 s); the homogenate was stored at 4°C overnight and then centrifuged at 15,000 × g, 4°C for 30 min. The resulting supernatant (soluble crude antigen) was collected, and the total protein concentration was determined by the Bradford protein assay and then kept at −20°C.
Partial purification of the crude antigen
The soluble crude S. ratti antigen was purified using the Hitrap Protein G High Performace affinity column (Cytiva, Sweden) following the manufacturer’s protocol, with slight modifications. First, the S. ratti antigen was diluted (1:1) with the binding buffer (20-mM sodium phosphate buffer, pH 7.0). After mixing, it was filtered through a 0.45-µM syringe filter. The Protein G column was then equilibrated to neutral pH with the binding buffer before sample loading. The antigen solution was then applied to the column at a 1-mL/min flow rate. The flow-through fraction (FF) was collected in 1.5-mL tubes (1-mL/fraction). The column was then washed with five column volumes of the binding buffer at a 1-mL/min flow rate. The unbound or excess protein (washing fraction or WF) was collected in 1.5-mL tubes (1 mL/fraction). Subsequently, bound proteins were eluted using the elution buffer (100-mM glycine-HCl buffer, pH 2.7) and neutralized with 100 µL of 1-M Tris-HCl, pH 9.0. The elution (elution fraction or EF) was collected in 1.5-mL tubes (1 mL/fraction). The total protein concentrations of the fractions were determined by the Bradford protein assay before storage at −20°C.
Measurements of IgG by ELISA
The unit-based ELISA protocol for IgG detection using the S. ratti antigen described previously was used with slight modifications (7, 13). A 96-well plate was coated with 2.5 µg/mL of crude S. ratti antigen or partially purified antigen fractions and incubated at 4°C overnight. The plate was washed twice using PBS containing 0.05% Tween-20 (pH 7.2) before blocking with 3% skimmed milk in PBS containing 0.5% Tween-20 at ambient temperature for 2 hours. Serum samples (1:8,000, 100 µL/well) were added and incubated at 37°C for 1 hour. After three times washing of the plates, 100 µL of horseradish peroxidase conjugated to goat anti-human IgG at dilution 1:4,000 (Abcam, USA) was added and incubated at 37°C for 1 hour. After washing three times, O-phenylenediamine dihydrochloride substrate (Sigma-Aldrich, USA) in citrate-phosphate buffer pH 5.0 (100 µL/well) was added. The plate was incubated at room temperature for 1 hour in a humidified dark container. The reaction was stopped by adding 4 N sulfuric acid (50 µL/well), and the optical density (OD) was measured at 492 nm using an ELISA reader (TECAN Sunrise, Austria). The OD was transformed to arbitrary antibody units (per mL or serum) based on a standard curve generated from serial dilutions of pooled positive serum samples.
RDT based on immunochromatographic technique
The ICT cassette prototype is based on a one-way immunochromatographic technique (Fig. 2). The test cassette consists of pads, filter, and membranes, including nitrocellulose membrane (CN140, Sartorius Stedim Biotech SA, Goettingen, Germany), and the results are seen as test (T) and control (C) lines. Goat anti-mouse IgG at a concentration of 1 mg/mL (Lampire Biological Laboratories, USA) was sprayed at a flow rate of 0.1 µL/mm using XYZ3210 Dispense Platform (BioDot, Irvine, CA, USA) onto the nitrocellulose membrane to form the C line. Crude S. ratti antigen (3.5 mg/mL) or partially purified antigen (2.4 mg/mL) was sprayed as the T lines at a flow rate of 0.1 µL/mm. The colloidal gold-conjugated mouse monoclonal anti-human IgG at OD = 10 (Sigma-Aldrich, USA) was sprayed onto a pretreated glass microfiber filter GF33 (Whatman Schleicher & Schuell, Dassel, Germany). The ICT cassettes were produced in collaboration with Kestrel BioSciences Co., Pathumthani, Thailand.
Structure and compositions of ICT cassettes for IgG detection of strongyloidiasis. (A) Crude S. ratti antigen and (B) purified fraction antigen (WF).
A serum sample (5 µL) was applied to the sample well, followed by adding three drops of running buffer (FL buffer with 0.1% Triton-X 405, pH 8.0) to the same well. Strongyloides-specific IgG in the serum sample will covalently bind to the goat anti-human IgG conjugated to colloidal gold before moving upward (via capillary action) to the test and control lines. After 15–20 min, the appearance of red lines at C and T indicates a positive result, and the intensity of the T line is scored visually according to a reference card (grading score +1 to +4). A red line only at C indicates a negative result (Fig. 3).
Grading scores of ICT Cassette. (A) Crude S. ratti antigens and (B) WF antigen.
Statistical analysis
The cutoff values of Strongyloides**-specific IgG by ELISA were determined by the receiver operating characteristic analysis using Medcalc version 11.6.1.0 based on an analysis of 40 proven-positive and 40 proven-**negative serum samples for S. stercoralis infection. The area under the curve (AUC) indicates how well a parameter can differentiate between two diagnostic groups, and the cutoff was calculated to achieve the highest sensitivity and specificity (7, 22, 31). The cutoff values in terms of antibody unit/mL of serum for IgG ELISA based on crude S. ratti were 144.8, 203.7 for FF antigen, and 190.0 for WF antigen.
Diagnostic sensitivity and specificity of Strongyloides**-**specific IgG in serum by ELISA and ICT using crude S. ratti and partially purified antigens were determined by comparing with the reference test (FECT and APCT). The sensitivity and specificity of each test were also calculated using Medcalc version 11.6.1.0. The data for sensitivity and specificity were compared using the McNemar’s test. Pairwise comparisons of AUC values were evaluated by DeLong’s test (32).
Agreement of diagnostic methods was evaluated using Cohen’s Kappa coefficient (κ), for which a value of less than 0.2 indicates a slight agreement, 0.21–0.40 a fair agreement, 0.41–0.60 a moderate agreement, 0.61–0.80 a substantial agreement, and >0.80 an almost perfect agreement (33, 34). The statistical analyses of data obtained in this study were performed using SPSS v.26.0, and the results were considered significant when P < 0.05.
The relationship between positive rates of S. ratti-ICT and levels of Strongyloides-specific IgG in serum was analyzed using a test for trend. Data frequency distributions were assessed for normality, and antibody units were normalized using log-transformed data, log (1 + unit) and prior to performing statistical tests and**/**or utilizing nonparametric tests where appropriate. The results were considered significant when P < 0.05.
RESULTS
Demographic characteristics and parasitic infections of the study samples
As shown in Table S1, three groups of samples (as described in “Study design and Clinical samples”) for ELISA were Group 1 consisted of 110 samples (67 males, 43 females), Group 2 consisted of 70 samples (38 males, 32 females), and Group 3 consisted of 60 samples (21 males, 39 females). For ICT, Group 1 consisted of 169 samples (98 males, 71 females). Group 2 consisted of 47 samples (19 males, 28 females), and Group 3 consisted of 71 samples (23 males, 48 females). The overlapping samples for analysis by the ELISA and ICT were 56.4% and between different groups were 35%–62%.
Purification of crude S. ratti antigen
Purification of S. ratti antigen and ELISA optimization
The partially purified S. ratti protein comprised three fractions, that is, FF, WF, and EF. The concentration of each antigen fraction was optimized for the measurements of specific IgG in ELISAs and compared with crude S. ratti-ELISA using pooled positive and negative S. stercoralis sera. Figure 4 shows the results of the optimized ELISAs. It demonstrates that the FF and WF were reactive to Strongyloides-positive sera and showed similar profiles to the crude *S. ratti-*ELISA. On the other hand, the EF-ELISA showed low antibody levels; subsequently, only FF and WF of the partially purified antigens were used in the ELISAs.
Strongyloides-specific IgG levels determined by ELISAs using partially purified (FF, WF, and EF) and crude S. ratti antigens and dilutions of positive control sera. Each data point represents a mean of triplicate experiments.
Positive detection rates of strongyloidiasis by ELISAs using crude and partially purified antigens
As shown in Table 1, Group 1 showed 93.6% positive detection by ELISA using crude antigen, 93.6% by FF, and 90.9% by WF (McNemar’s test*, P* > 0.05). Group 2 showed 51.4% positive detection by ELISA using crude antigen, 48.6% by FF, and 45.7% by WF (McNemar’s test*; P* > 0.05). Meanwhile, for Group 3, WF antigen, and not FF antigen, showed significantly lower positive detection compared with crude antigen ELISA (McNemar’s test*; P* < 0.01).
Diagnostic performance of purified and crude S. ratti ELISA
Diagnostic sensitivity of IgG**-ELISA based on the FF and WF antigens was similar, that is, >90% sensitivity (McNemar’s test; P > 0.05) (Table 2). The diagnostic specificity of the WF-**ELISA (63.1%) was significantly increased compared to the ELISAs using crude (52.3%) and FF antigen (56.9%) (McNemar’s test; P < 0.001 and P < 0.01, respectively). The degrees of Kappa agreement with fecal examination were similar among the ELISAs using FF, WF, and crude S. ratti (Table S2). Moreover, ELISAs using crude, FF, and WF antigens showed comparable AUC values (Table S3).
ICT using crude and partially purified S. ratti antigens
Positive detection rate by crude S. ratti-ICT and WF-ICT
In Group 1 of proven S. stercoralis infection (n = 169), the positive rate by ICT using crude and WF antigens was equal at 98.2% (Table 3). However, the false-positive rates when tested with sera from subjects with other parasite infections (Group 2) were 36.2% by crude S. ratti-ICT and 10.6% by WF**-**ICT (McNemar’s test, P < 0001). Among the endemic negatives of Group 3, the false-positive detection rate was 18.3% by crude S. ratii-ICT and 0% by WF-ICT.
The diagnostic performance of crude S. ratti-ICT and WF-ICT
The diagnostic sensitivity of S. ratti-ICT using crude and WF antigens was 98.2% (Table 4). Meanwhile, the diagnostic specificity increased from 74.6% with the crude S. ratti-ICT to 95.8% with the WF-ICT (McNemar’s test, P < 0.001). The diagnostic agreement (Kappa) with reference to fecal examination was almost perfect (Kappa value = 0.942, P < 0.001) (Table S4). Moreover, there was a significant increase in AUC by the WF-ICT compared to fecal examination (DeLong’s test, P < 0.0001) (Table S5).
The correlations between IgG ELISA and ICT based on purified S. ratti antigen
The detection rates of ICT based on crude S. ratti and WF antigens were positively correlated to IgG antibody units in serum ( test for trend, 83.1—119.4, P < 0.0001). Based on the cutoff values of the IgG-ELISA based on crude S. ratti (<144.8 units), within the negative IgG-ELISA samples, there were significantly fewer positives by WF-ICT (16.8%, 18**/107) than by crude S. ratti-ICT (32.7%, 35/**107) ( test = 44.5, P < 0.001) (Fig. 5). The grading scores of crude S. ratti-ICT and WF-ICT were strongly and positively statistically correlated with the levels of Strongyloides-specific IgG-ELISA in the samples (Fig. 6, Kruskal–Wallis test, P < 0.0001).
Rates of positive ICT tests for detection of S. stercoralis using (A) crude S. ratti antigen and (B) WF antigen, classified by specific IgG-ELISA units.
Relationship between levels of serum IgG and ICT grading scores using (A) crude S. ratti antigen and (B) WF antigen. Numbers are the mean ± SE of IgG unit in serum (log-transformed value +1).
Cross-reaction study between S. ratti and WF antigen-ELISA and ICT
As shown in Table 5, the cross-reaction with O. viverrini infection by crude-S. ratti ELISA was slightly reduced (4.2% less) compared with WF-ELISA. In the case of ICT, there was no cross-reactivity by WF antigen compared with 33.3% by crude-S. ratti antigen in O. viverrini infection. Based on availability of limited sample sizes (one to three cases), WF-ELISA and WF ICT showed slightly lower cross-reactions for Taenia spp., Trichuris trichiura, and Echinostoma spp. No difference in cross-reaction by crude S. ratti or WF-ICT was seen in Minute Intestinal Flukes. Among the endemic negatives (Group 3, n = 25), the positive rates were reduced from 12% in crude S. ratti to 4% in WF-ELISA. In ICT, with reference to the cross-reaction by crude S. ratti antigen (20%), no cross-reaction was seen in WF antigen.
TABLE 5: The analysis of cross-reactivity based on crude-S. ratti and WF of the purified antigen by ELISA and ICT in the samples with other parasitic infections in group 2 (n = 31) and the endemic negative individuals in group 3 (n = 25)
DISCUSSION
Previous reports showed that several immunodominant antigenic components of S. ratti may enhance cross-reactions with other parasitic infections (21). The widely used commercial ELISA kit (Bordier), which uses crude S. ratti antigen, was reported to demonstrate up to 11.3% cross-reactivity with other parasitic infections (22). Removing those potentially cross**-reacting components by purification via protein fractionation may increase the diagnostic specificity of crude S. ratti antigen. In the present study, cross-reactivity to coendemic parasites using crude S. ratti and purified antigen fractions was studied using ELISA and ICT. Previously, our in-house ELISA using crude S. ratti antigen showed cross-reactions with O. viverrini by serum and urine ELISAs (13). The use of defined antigens such as recombinant antigens rNIE, SsIR, and Ss1a by ELISA and ICT also reported some cross-**reactivity with sera from people with other parasitic infections such as hookworm, trichinellosis, angiostrongyliasis, and capillariasis (8, 9, 14, 18, 19, 35, 36). Thus, improvement of the diagnostic accuracy, particularly the diagnostic specificity of the tests, is needed.
In this study, the crude S. ratti antigen purification using a Protein G affinity column yielded three antigen fractions, namely, EF, FF, and WF. After equilibrated with binding buffer, the crude S. ratti antigen was loaded into column to collect the FF antigen which consisted of large unbound protein component. The second antigen fraction was the WF antigen which may contain small unbound proteins. Finally, the EF antigen consisting of bound protein and was eluted with glycine-HCl buffer, (pH 2.7) leading to dissociation of protein G and Ig-like protein.
The application of purified WF antigen of S. ratti demonstrated high diagnostic sensitivity (98%), comparable to the crude S. ratti antigen by both ELISA and ICT. Importantly, the WF-ELISA and WF-ICT assays showed significantly reduced cross-reactivity with other parasitic infections, particularly O. viverrini and Taenia spp., as well as fewer false positives among endemic negative samples compared to the crude antigen. Notably, the WF-ICT platform exhibited superior diagnostic accuracy (97.2%) compared to WF-ELISA (84.2%), with a diagnostic specificity 20% higher than that of ELISA. These findings were unexpected, as ELISA is generally regarded as more efficient than ICT. While further investigation is warranted, we hypothesize that the improved accuracy of ICT may be due to specific biochemical properties of the purified S. ratti antigen. One possibility is that the removal of the IgG-like domain from the crude S. ratti antigen through Protein G affinity purification enhances the specificity of the WF antigen. This hypothesis is supported by the fact that Ig-like domains, which are widely distributed across vertebrates, invertebrates, plants, fungi, parasites, bacteria, and viruses, may contribute to cross-reactivity (37). Similar findings, where ICT demonstrated higher sensitivity and specificity than ELISA, have been reported in studies on schistosomiasis (38) and echinococcosis (39).
A previous report of S. stercoralis purified by protein size using gel filtration chromatography also improved the diagnostic accuracy of strongyloidiasis by ELISA (24). It was found that F2 (medium size) was the best antigen in the ELISA. The sensitivity and specificity were 95.0% and 96.4%, respectively.
Compared with RDTs based on ICT in previous reports, the crude S. ratti-ICT in this study showed 98.2% diagnostic sensitivity, which is higher than ICT using crude S. stercoralis (93.3% sensitivity) (17). Furthermore, recombinant antigen-based RDTs were reported to show 91.7% sensitivity for IgG-ICT and varied from 78.3% to 97.0% for IgG4-ICT (14, 16, 19).
Regarding the quantitative aspect of diagnosis, the levels of Strongyloides-specific IgG measured by WF-ELISA and WF-ICT scores were quantitatively related, thus suggesting that ICT offers both qualitative and semi**-quantitative diagnosis of strongyloidiasis. A recently published report on SsRapid IgG4-RDT also showed a significant positive correlation between the RDT scores and Strongyloides-**specific IgG and IgG4 levels (10). However, whether the WF-ICT can be used to monitor the outcomes of drug treatment in terms of antibody reduction after treatment remains to be investigated.
We acknowledge several limitations of this study. First, this study used a limited sample size and geographic areas and patient populations. Further investigation is needed to evaluate the use of purified S. ratti antigen in diverse settings, including strongyloidiasis-endemic regions such as Africa and Latin America, as well as non-endemic areas in developed countries like Europe and North America. Second, in order to rule out possible cryptic strongyloidiasis in sample Group 2 (other parasites) and Group 3 (endemic negative), repeated stool examination by APCT and FECT and confirmation by molecular detection methods (2, 6) in cases of false-positive tests should have been done to better evaluate the performance of parasite-specific IgG detection by ELISA or ICT. Lastly, we did not perform immunoblotting to elucidate the specific antigenic bands of the fractions, particularly WF; hence the target antigen(s) which are reactive to IgG detection remained unknown. An in-depth protein analysis study is thus warranted.
In conclusion, the antigen purification approach using the Protein G affinity column yielded a promising antigen fraction (WF) that improved the diagnostic specificity and maintained high diagnostic sensitivity by ELISA and ICT. Since S. ratti antigen preparation is not hazardous and can be readily produced in laboratory animals, the above approach is feasible for an adequate supply of the WF antigen. The corresponding recombinant protein(s) to the antigenic component(s) can be produced to provide an unlimited antigen supply and perhaps enhance the diagnostic performance.
Pending further studies in other Strongyloides endemic areas, using S. ratti WF antigen is promising for improving the diagnostic specificity and accuracy of Strongyloides serodiagnosis.
The reference list from the paper itself. Each links out to its DOI / PubMed record.
- 1Buonfrate D, Bisanzio D, Giorli G, Odermatt P, Fürst T, Greenaway C, French M, Reithinger R, Gobbi F, Montresor A, Bisoffi Z. 2020. The global prevalence of Strongyloides stercoralis infection. Pathogens 9:468. doi:10.3390/pathogens 906046832545787 PMC 7349647 · doi ↗ · pubmed ↗
- 2Chan AHE, Kusolsuk T, Watthanakulpanich D, Pakdee W, Doanh PN, Yasin AM, Dekumyoy P, Thaenkham U. 2023. Prevalence of Strongyloides in Southeast Asia: a systematic review and meta-analysis with implications for public health and sustainable control strategies. Infect Dis Poverty 12:83. doi:10.1186/s 40249-023-01138-437705080 PMC 10498648 · doi ↗ · pubmed ↗
- 3Nutman TB. 2017. Human infection with Strongyloides stercoralis and other related Strongyloides species. Parasitology 144:263–273. doi:10.1017/S 003118201600083427181117 PMC 5563389 · doi ↗ · pubmed ↗
- 4Balachandra D, Ahmad H, Arifin N, Noordin R. 2021. Direct detection of Strongyloides infection via molecular and antigen detection methods. Eur J Clin Microbiol Infect Dis 40:27–37. doi:10.1007/s 10096-020-03949-x 32729057 · doi ↗ · pubmed ↗
- 5Buonfrate D, Requena-Mendez A, Angheben A, Cinquini M, Cruciani M, Fittipaldo A, Giorli G, Gobbi F, Piubelli C, Bisoffi Z. 2018. Accuracy of molecular biology techniques for the diagnosis of Strongyloides stercoralis infection—A systematic review and meta-analysis. P Lo S Negl Trop Dis 12:e 0006229. doi:10.1371/journal.pntd.000622929425193 PMC 5823464 · doi ↗ · pubmed ↗
- 6Iamrod K, Chaidee A, Rucksaken R, Kopolrat KY, Worasith C, Wongphutorn P, Intuyod K, Pinlaor S, Sithithaworn J, Sithithaworn P, Hongsrichan N. 2021. Development and efficacy of droplet digital PCR for detection of Strongyloides stercoralis in stool. Am J Trop Med Hyg 106:312–319. doi:10.4269/ajtmh.21-072934662861 PMC 8733496 · doi ↗ · pubmed ↗
- 7Eamudomkarn C, Sithithaworn P, Sithithaworn J, Kaewkes S, Sripa B, Itoh M. 2015. Comparative evaluation of Strongyloides ratti and S. stercoralis larval antigen for diagnosis of strongyloidiasis in an endemic area of opisthorchiasis. Parasitol Res 114:2543–2551. doi:10.1007/s 00436-015-4458-325877389 · doi ↗ · pubmed ↗
- 8Eamudomkarn C, Ruantip S, Sithithaworn J, Techasen A, Kopoolrat KY, Worasith C, Wongphutorn P, Bethony JM, Laha T, Sithithaworn P. 2023. Epidemiology of strongyloidiasis determined by parasite-specific Ig G detections by enzyme-linked immunosorbent assay on urine samples using Strongyloides stercoralis, S. ratti and recombinant protein (NIE) as antigens in Northeast Thailand. P Lo S One 18:e 0284305. doi:10.1371/journal.pone.028430537043507 PMC 10096234 · doi ↗ · pubmed ↗